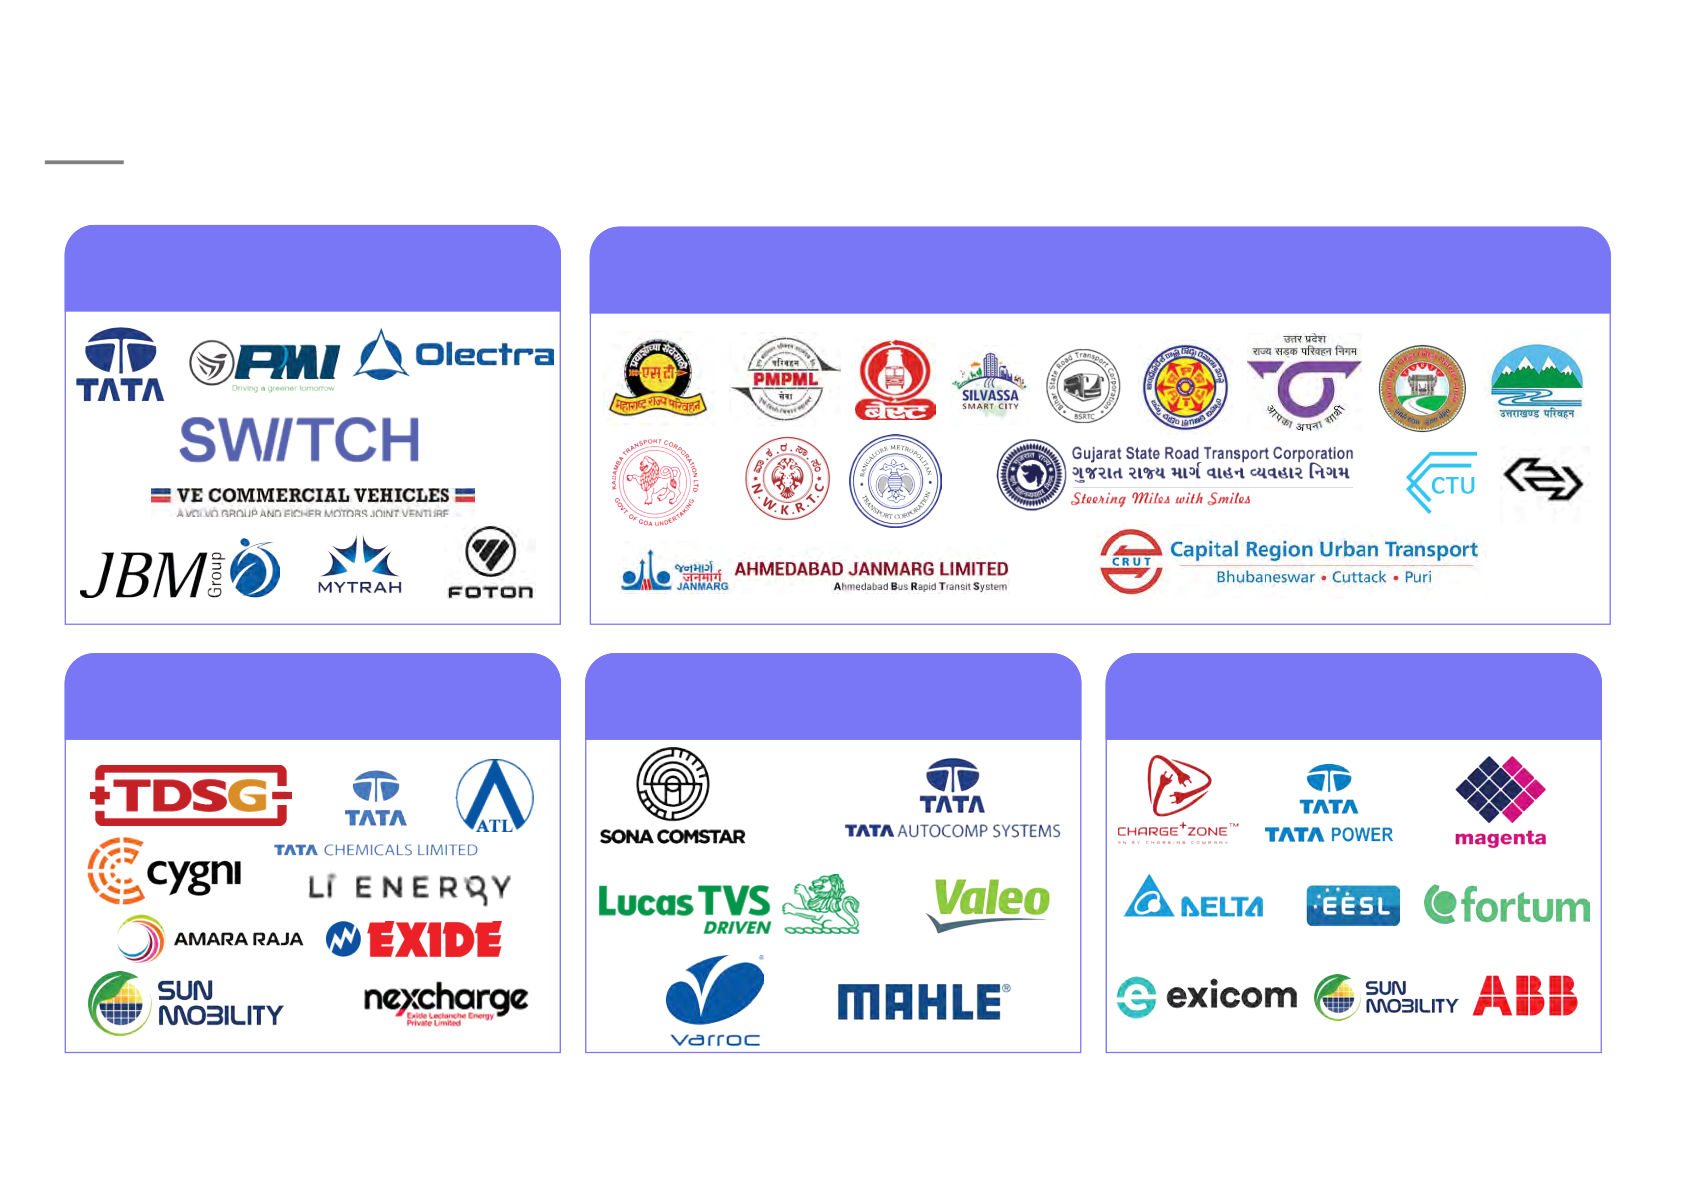
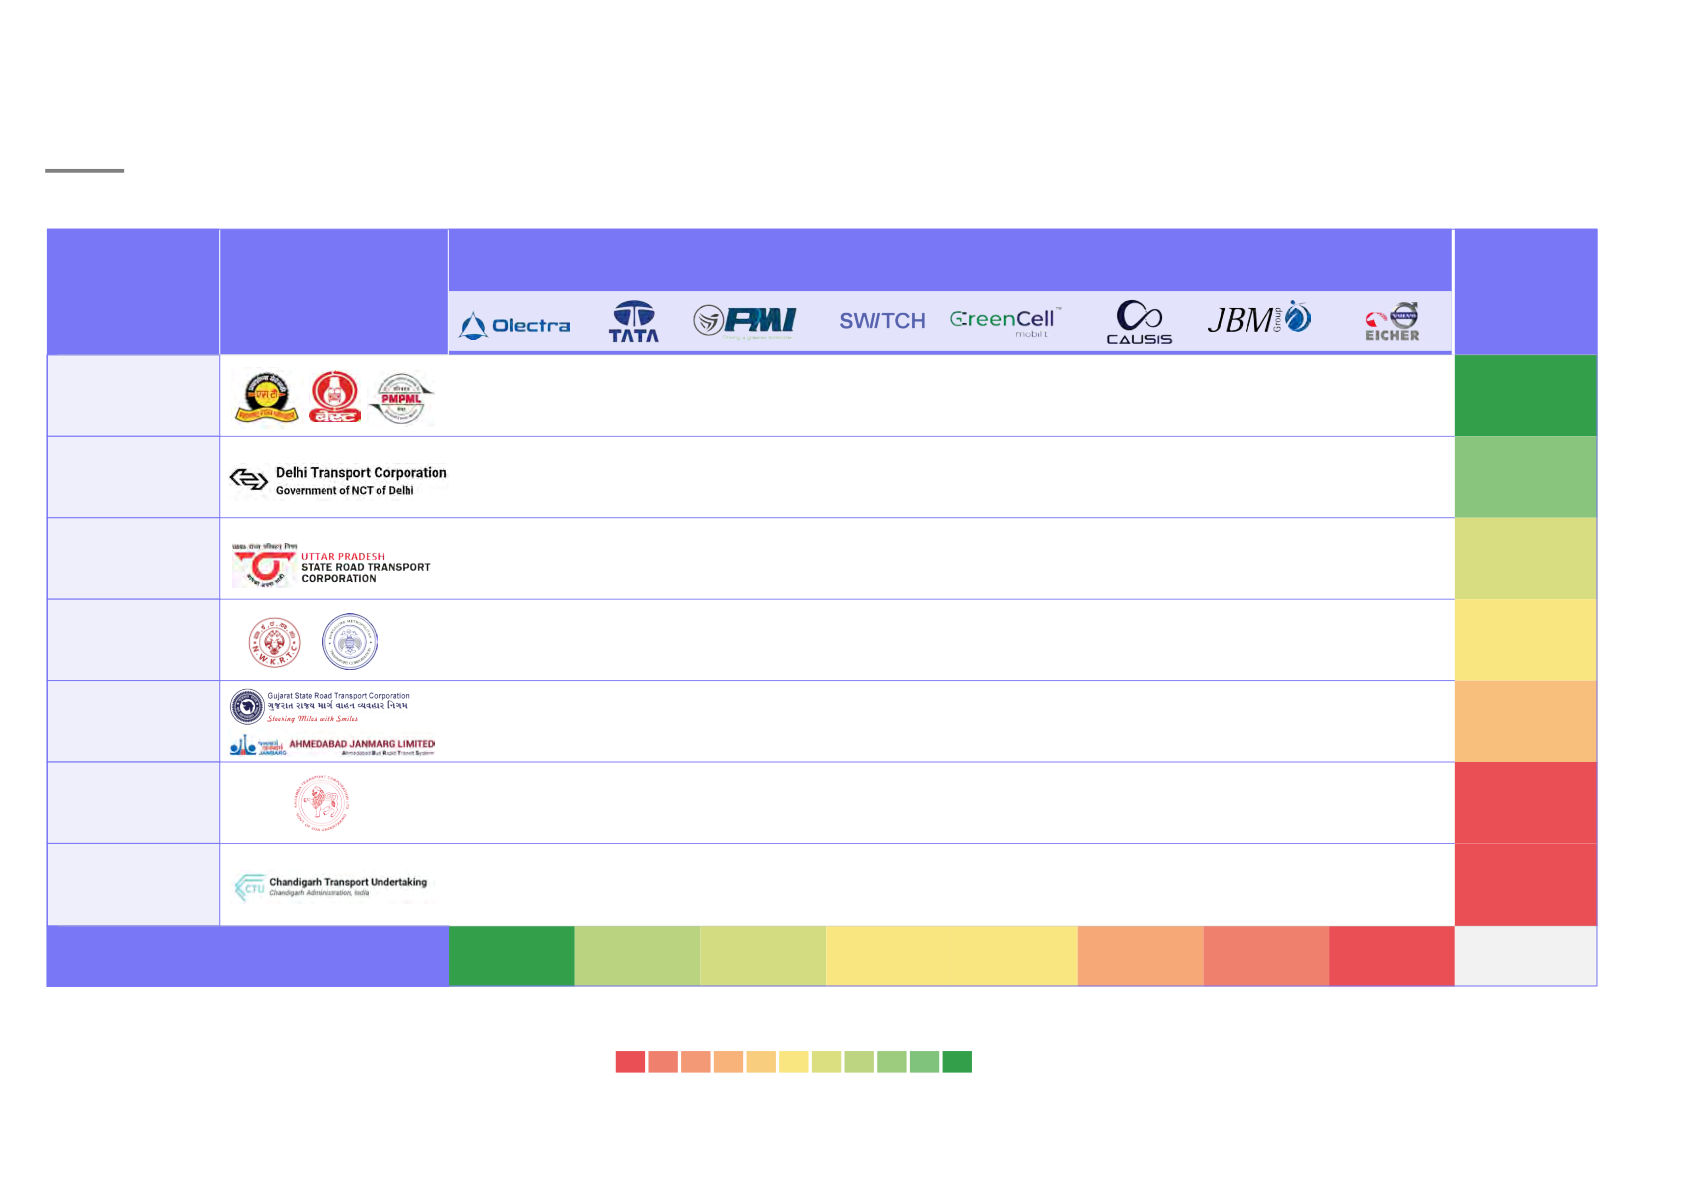
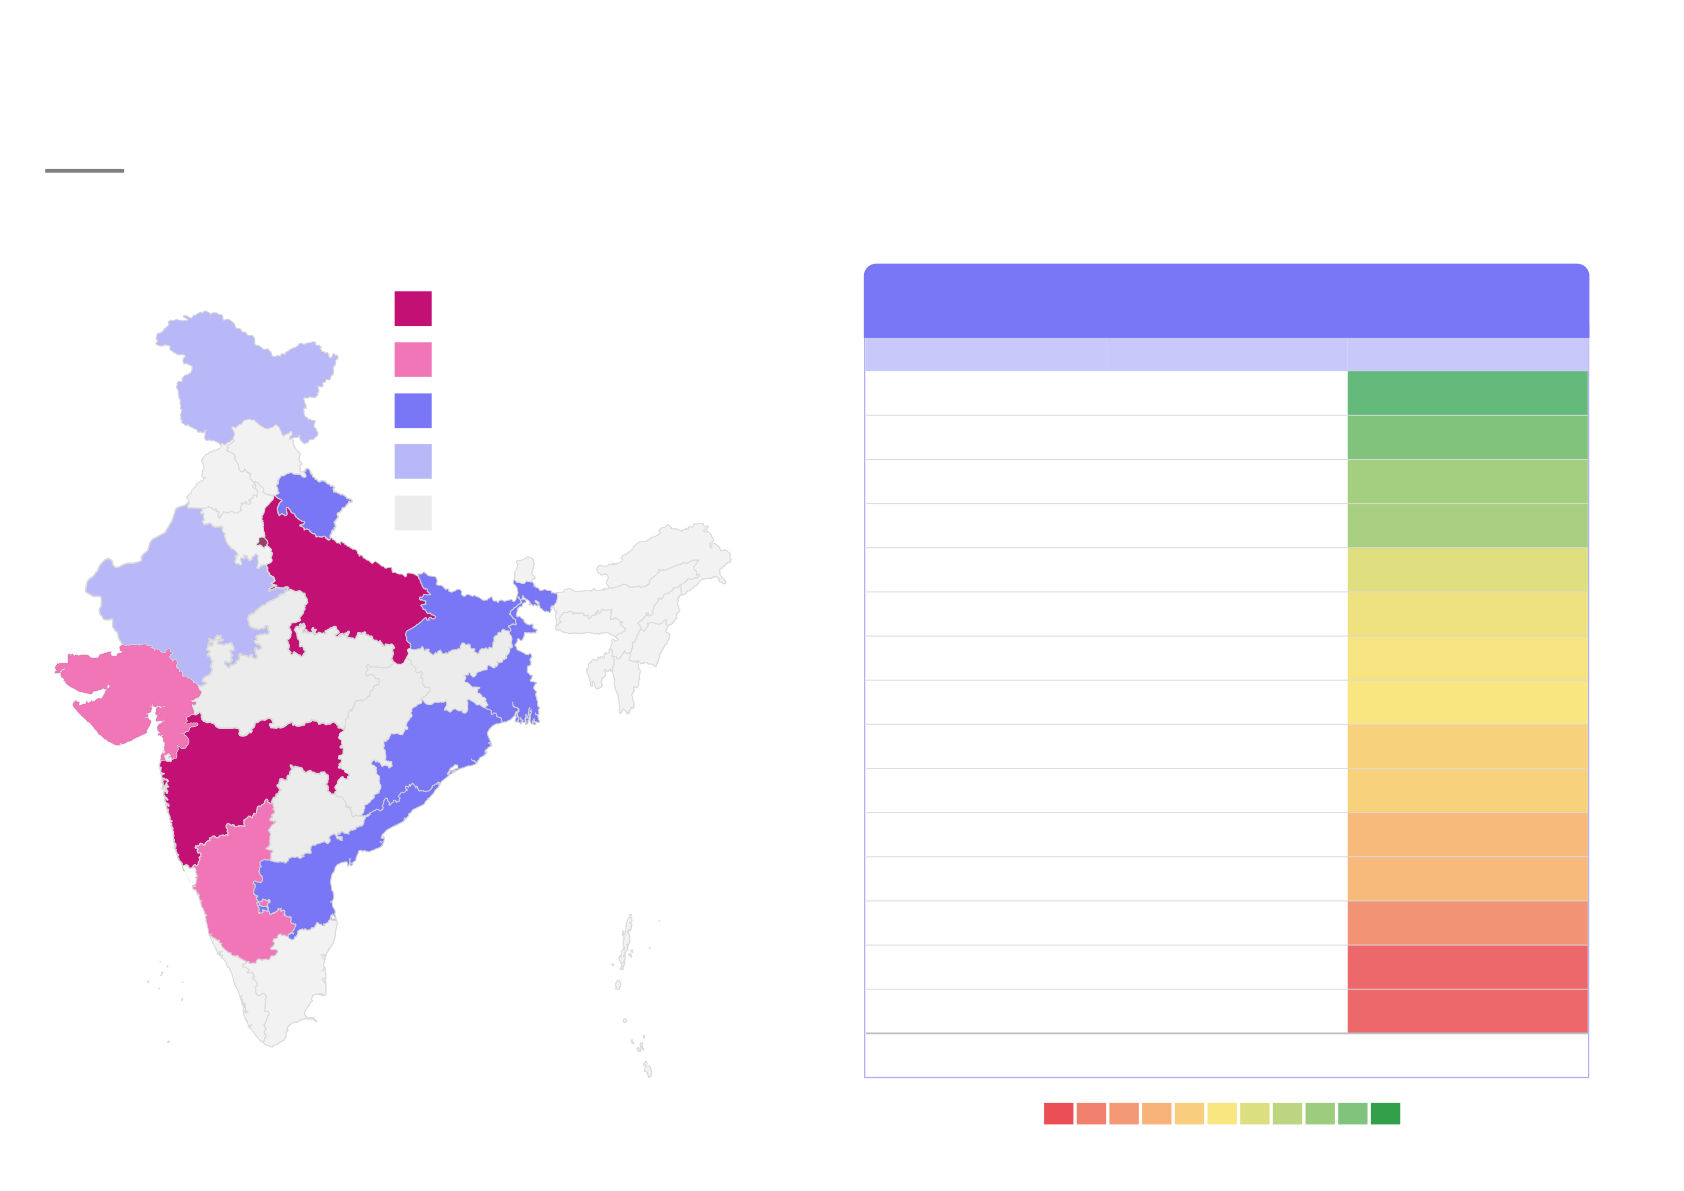
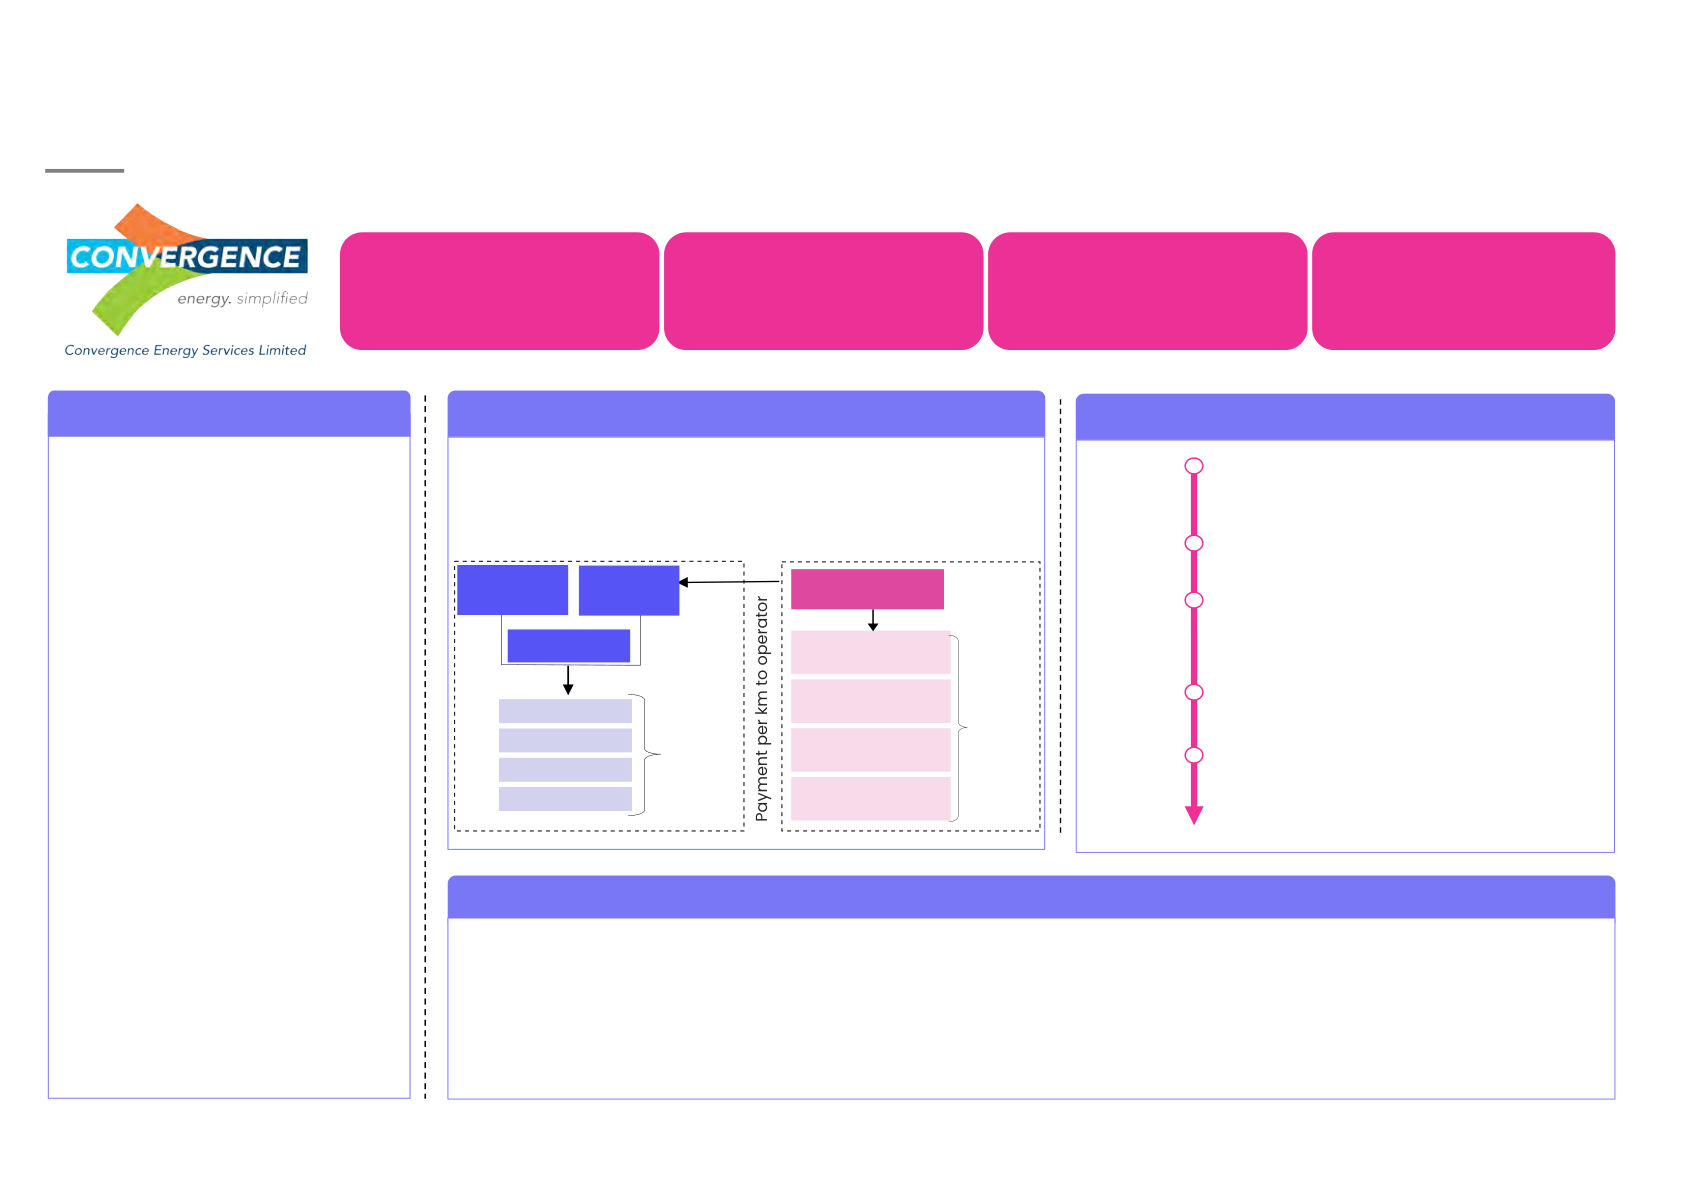
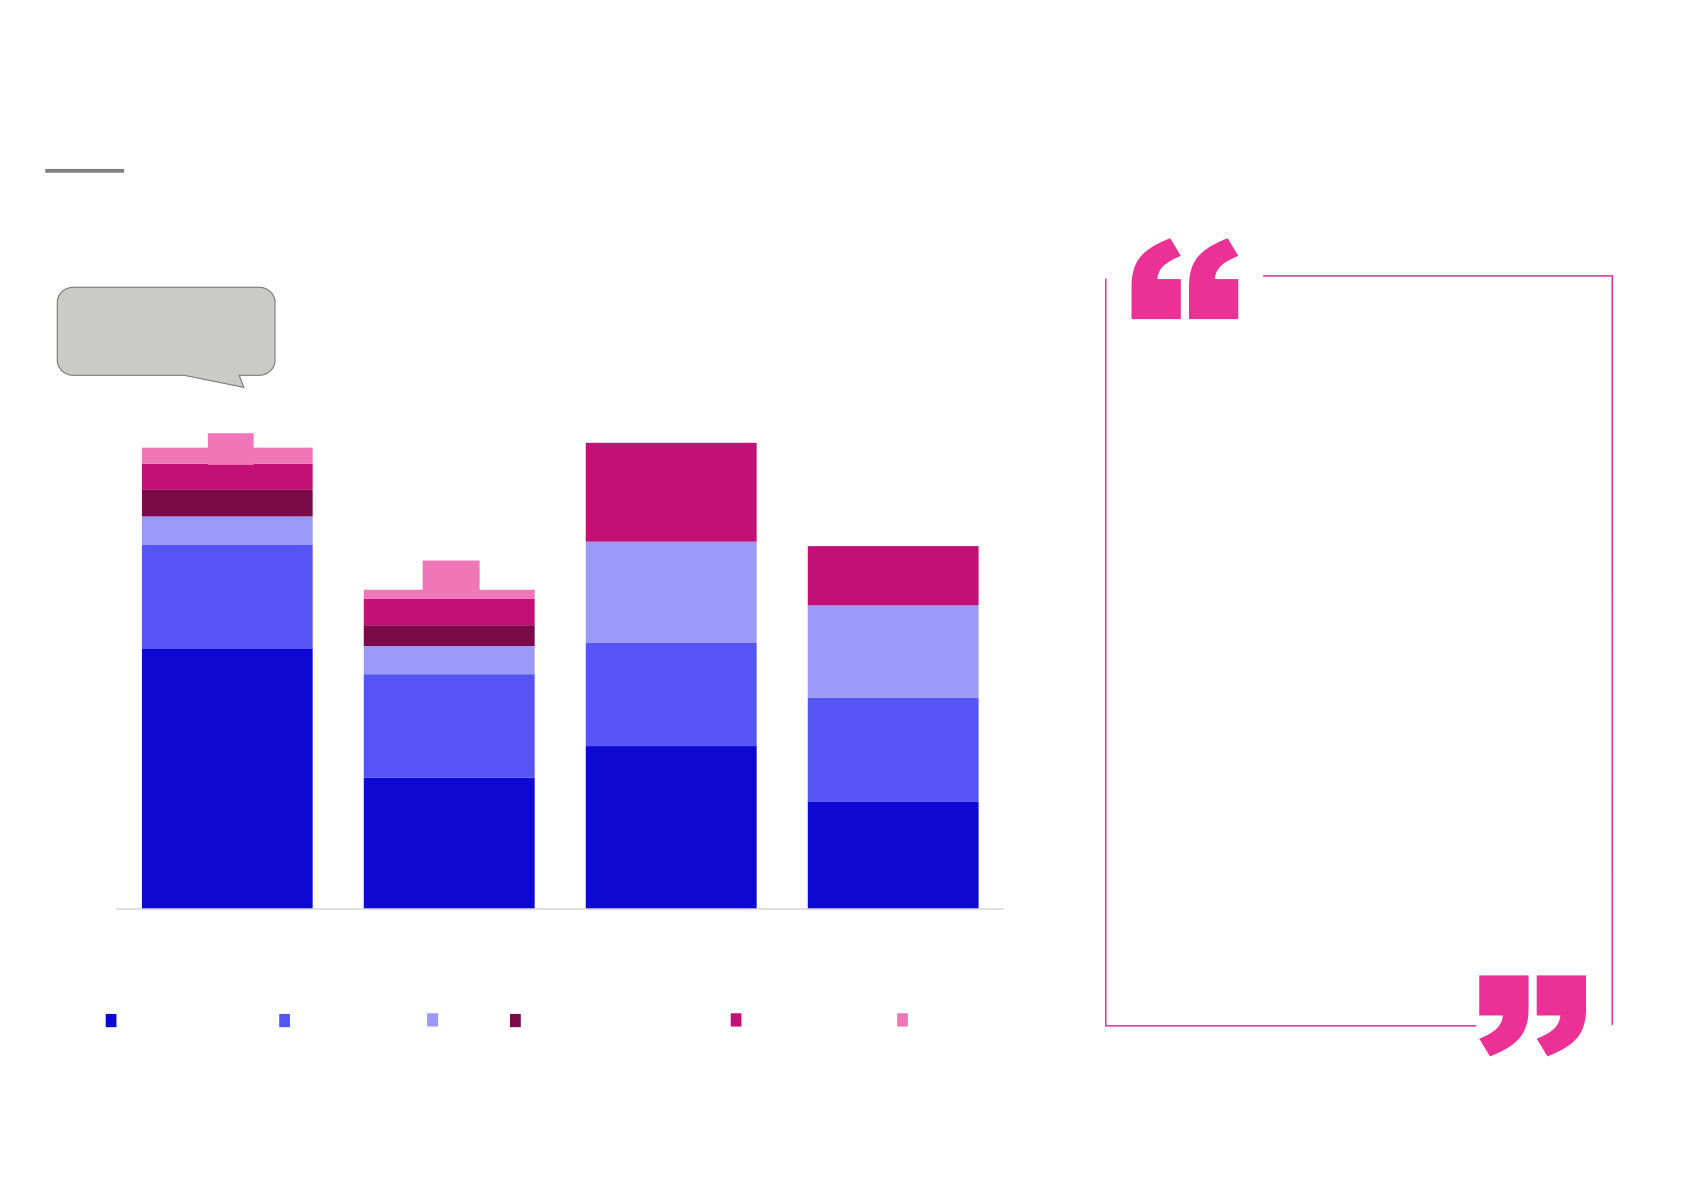
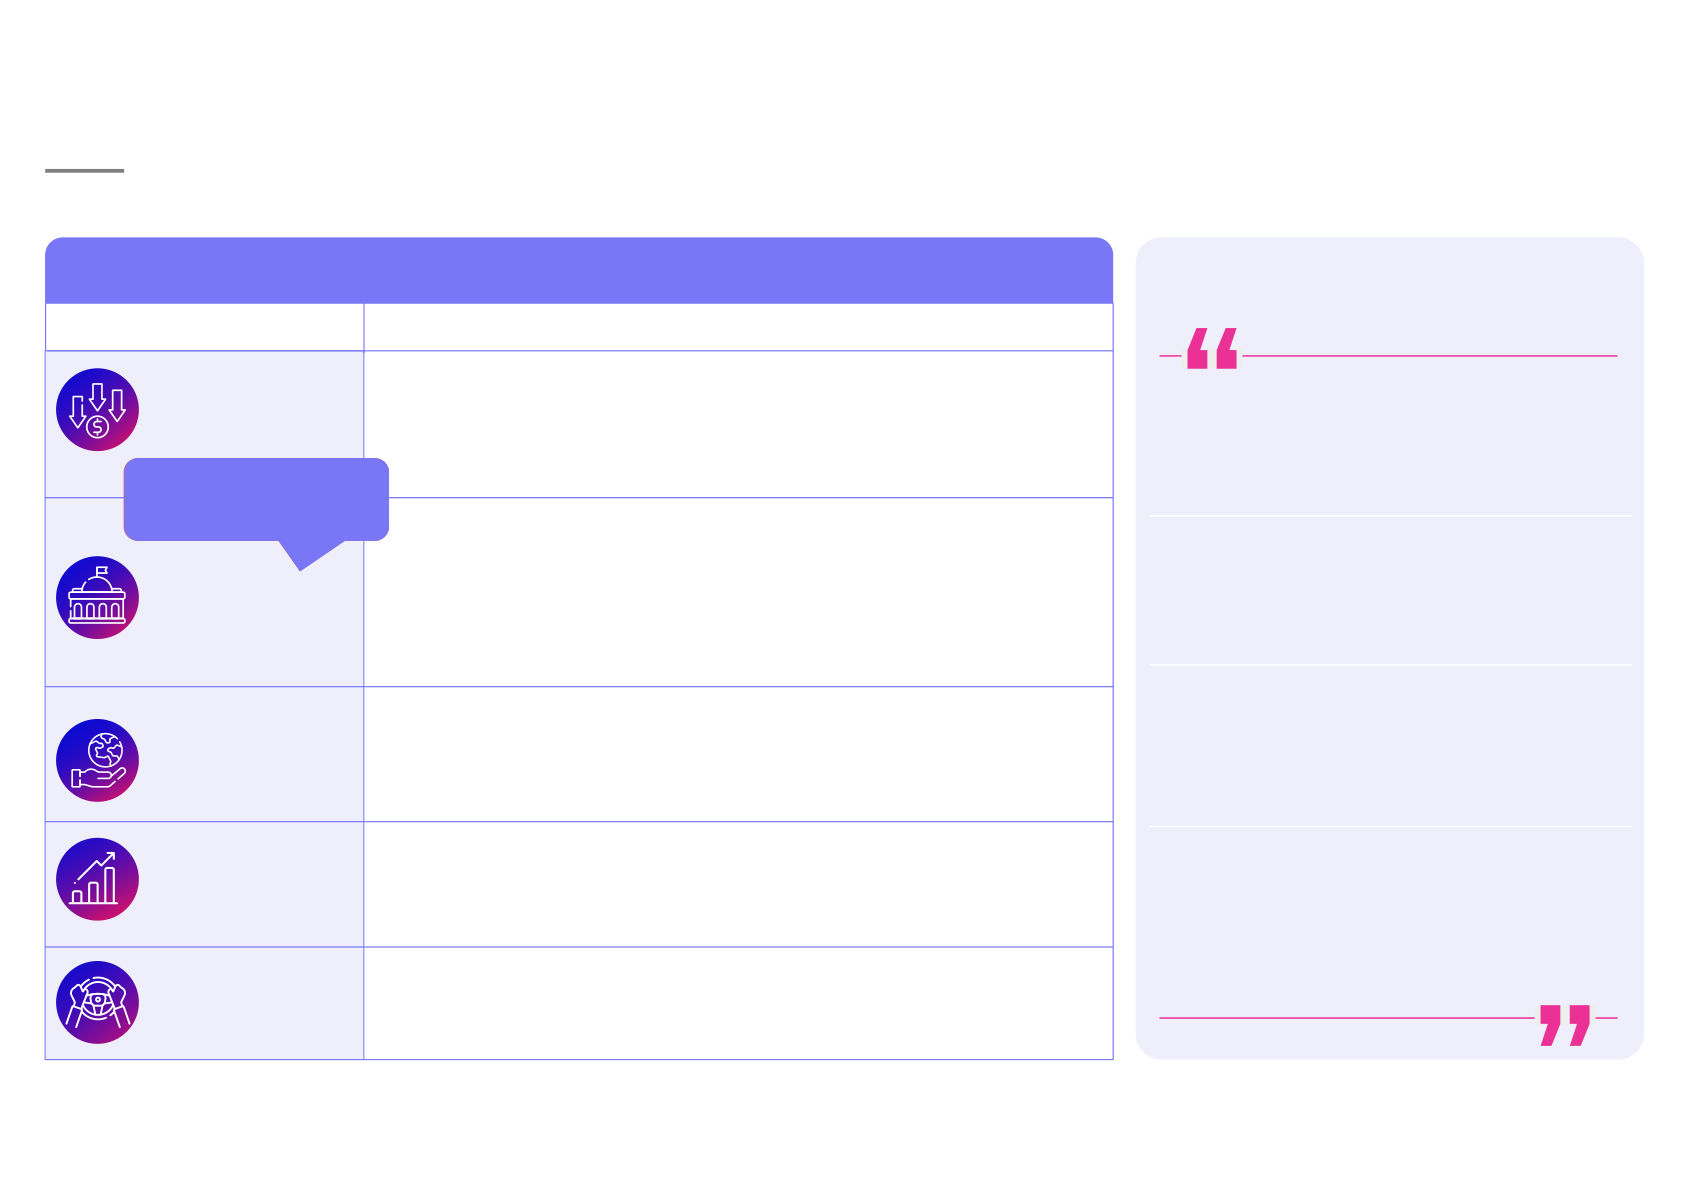
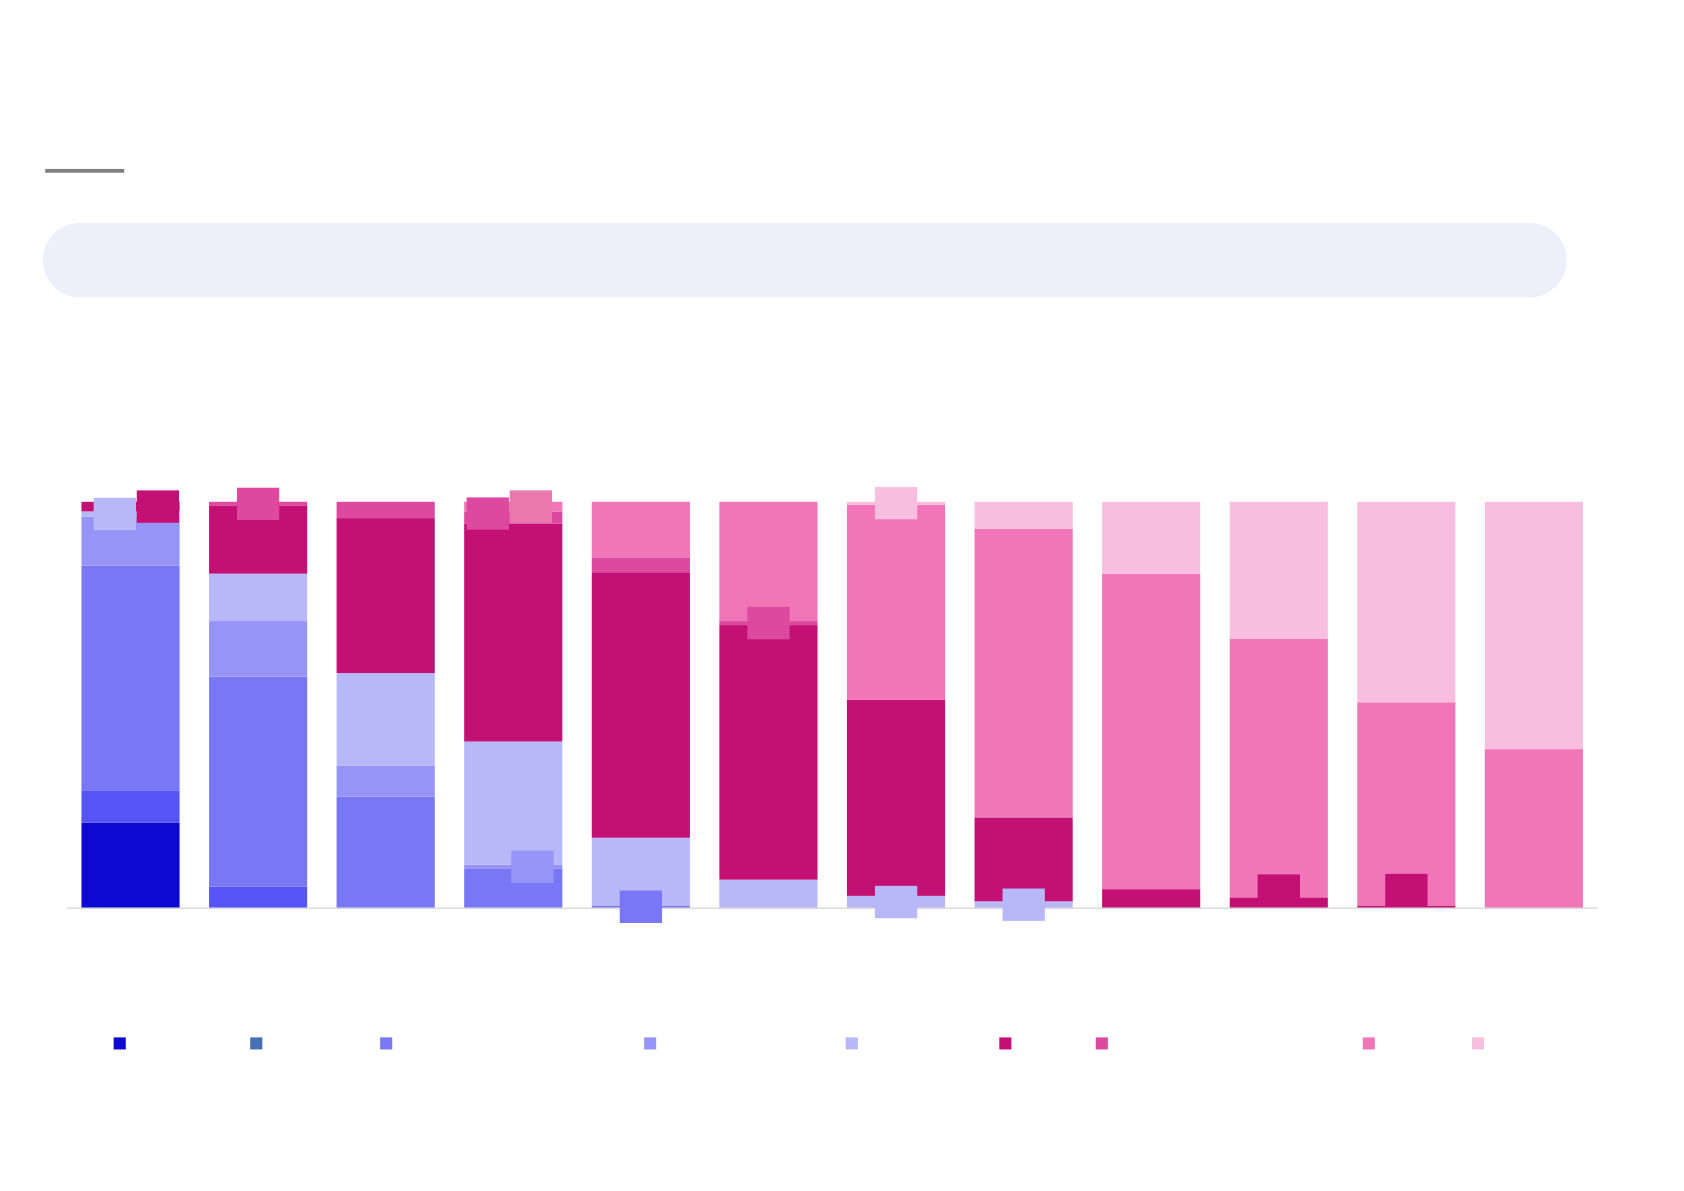
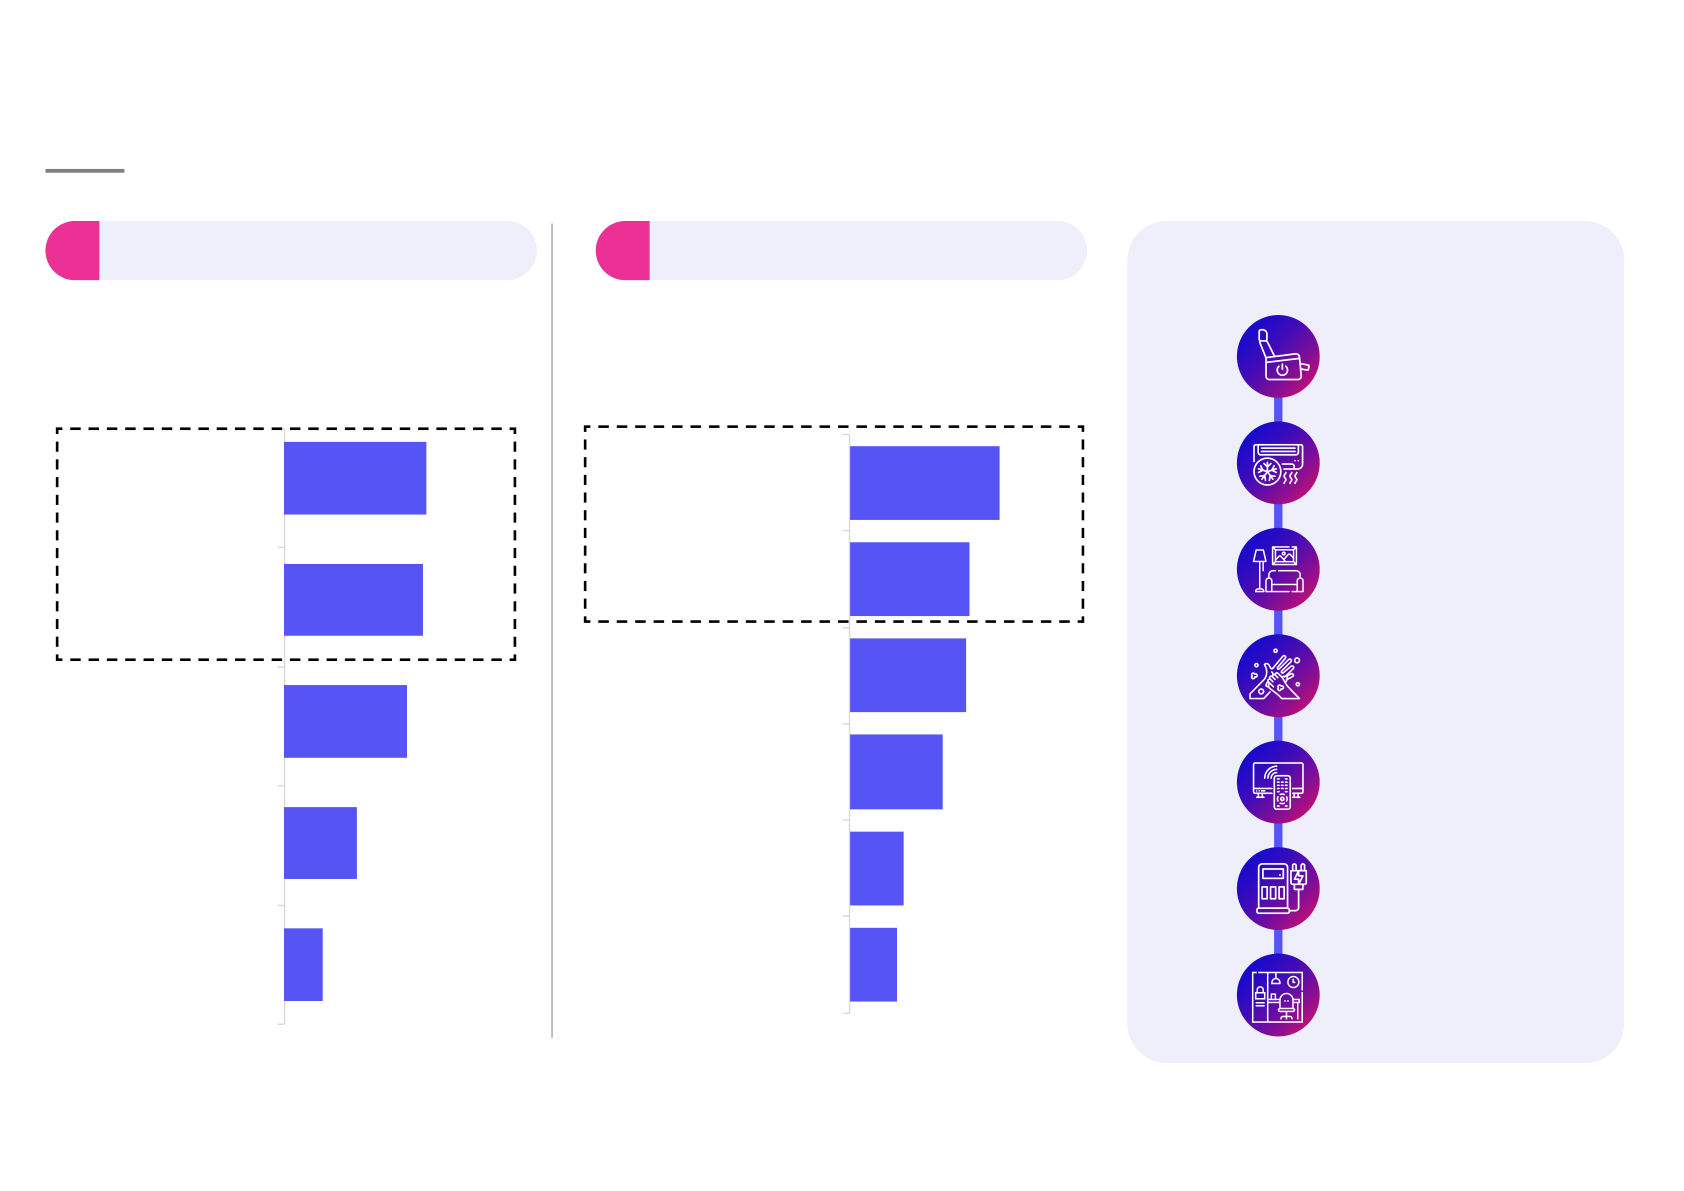
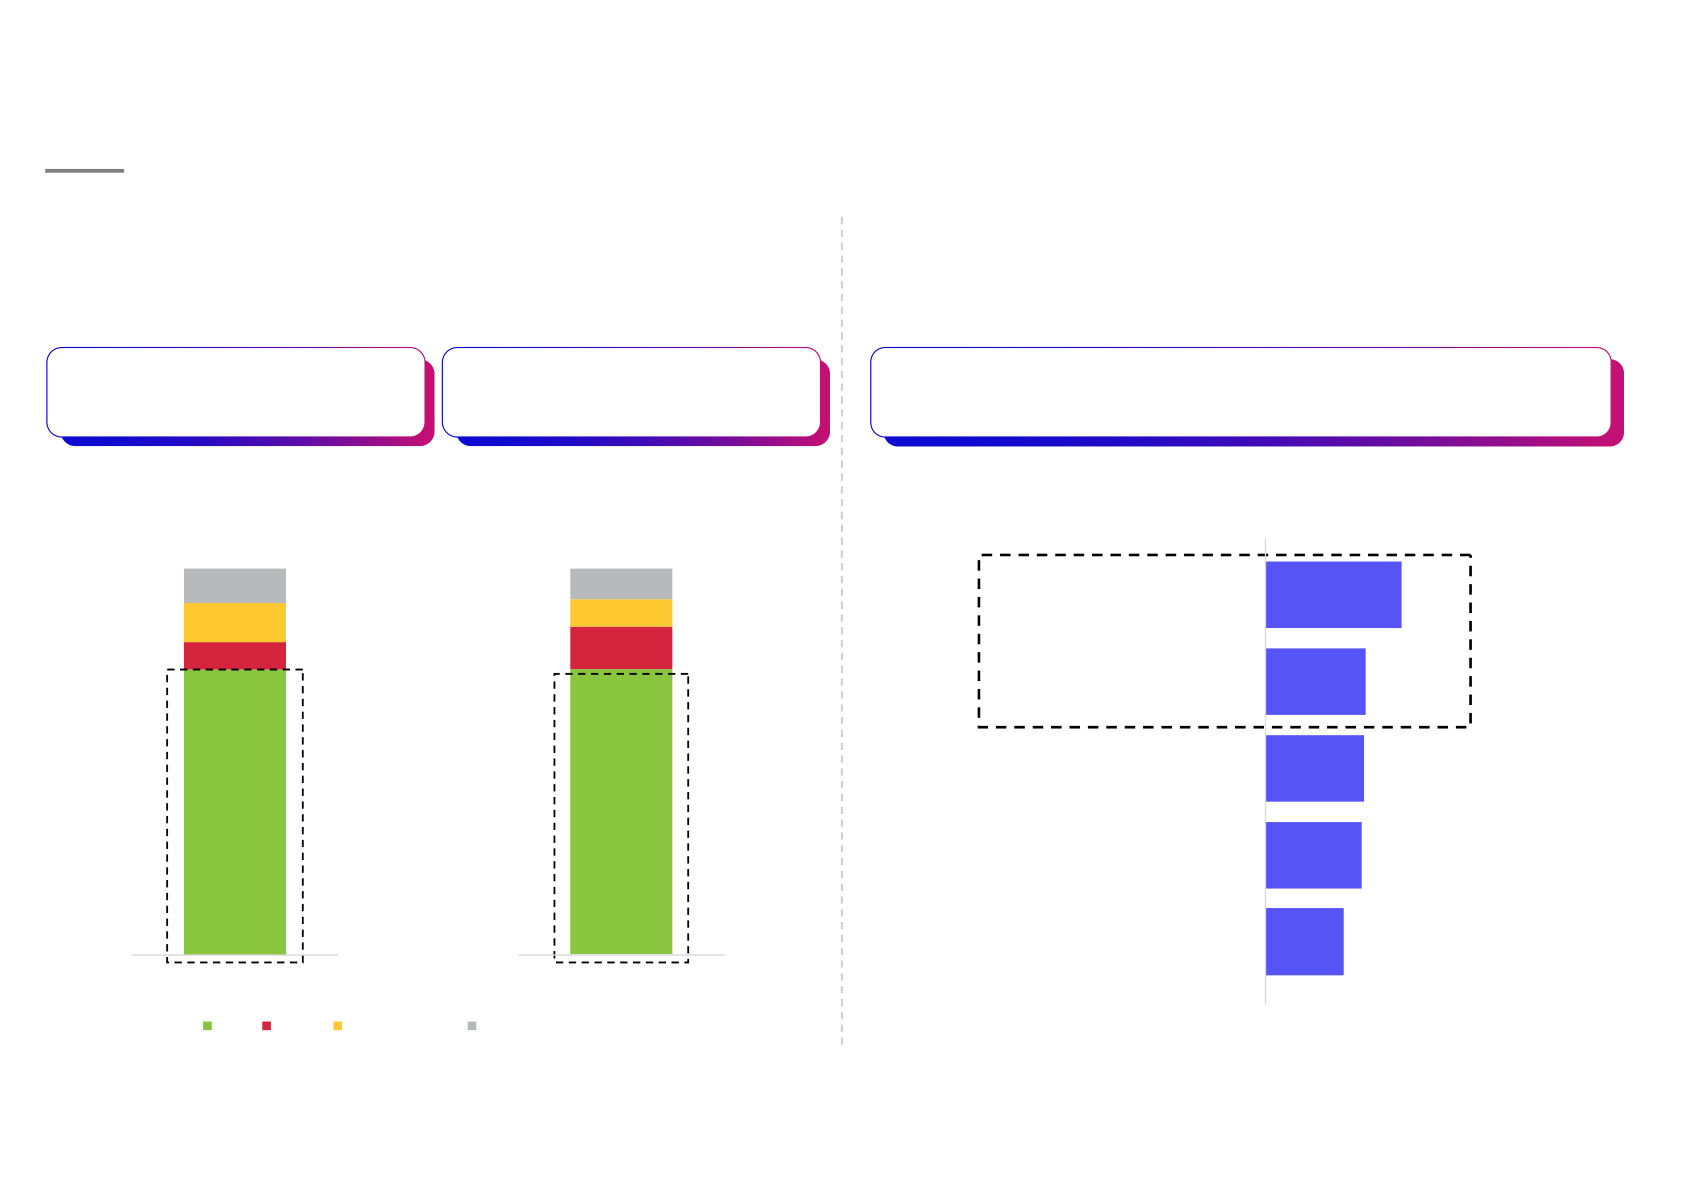
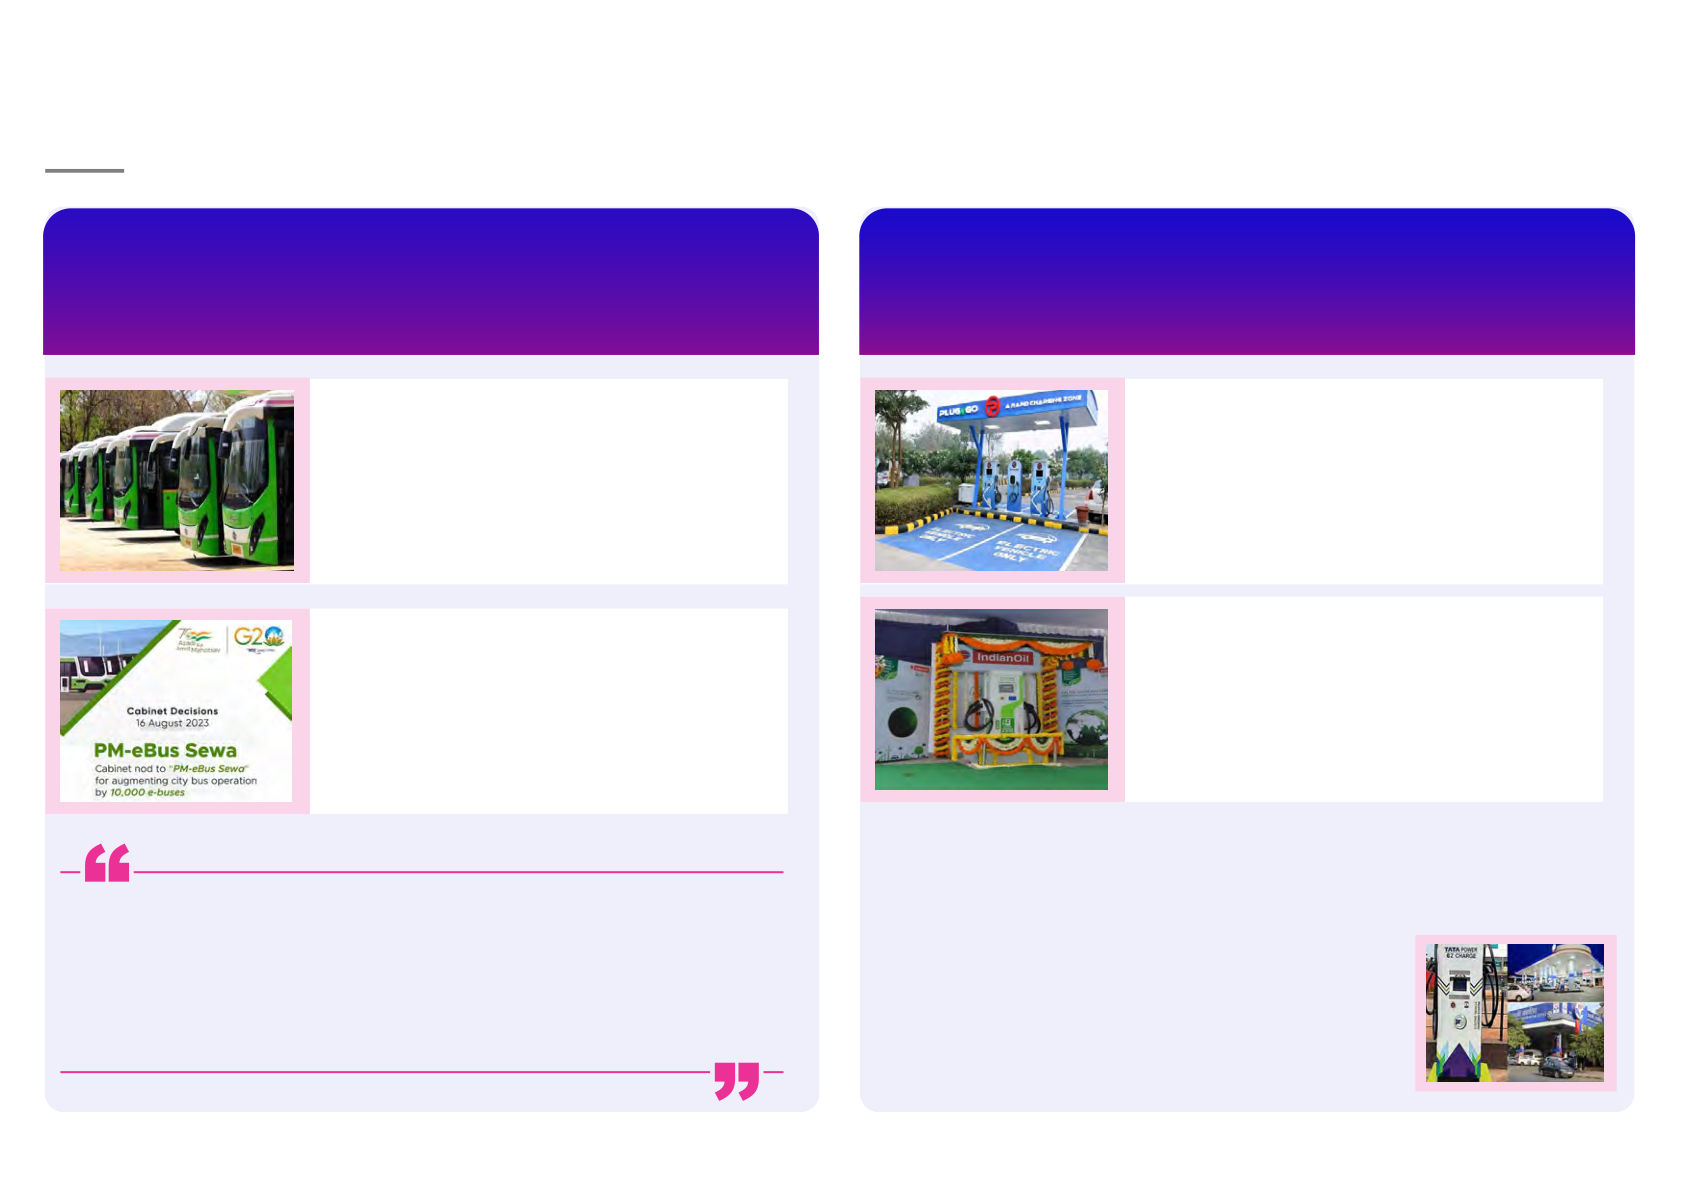
ELECTRIC BUS MOBILITY Report @Lattice Technologies Pvt. Ltd. FEB, 2024 Glossary Abbreviation Definition EV Electric Vehicle OEM Original Equipment Manufacturer FAME Faster Adoption and Manufacturing of (Hybrid &) Electric Vehicles NEMMP National Electric Mobility Mission Plan NEBP National Electric Bus Programme CESL Convergence Energy Services Limited GCC Gross Cost Contract PPP Public-Private Partnership TCO Total Cost of Ownership (includes capital, maintenance, fuel, staff and charging infrastructure costs) RfP Request for Proposal STU State Transport Undertakings PLI Production Linked Incentive EESL Energy Efficiency Services Limited MHI Ministry of Heavy Industries PSU Public Sector Undertakings © 1lattice | 02 Foreword E-buses are gaining rampant popularity in incentivizing purchases through subsidies India in not only the public but the private and deploying both inter and intra-city sector as well. They run on electricity buses across all the states in India. instead of diesel and have zero tailpipe This report is committed to delivering a emissions: holding significant promise in thorough understanding of the market by meeting India’s zero net carbon emissions delving into technological advancements, target by 2070. The industry is being driven and potential challenges. The objective is by an increase in environmental concerns to provide a comprehensive perspective and emphasizing the cost-effectiveness of that not only captures the current state of e-buses in the long term. the market but also sheds light on its In this report, we intend to provide insights future trajectory. This endeavor aims to into the e-bus mobility sector of India. The offer valuable insights to a diverse economics of replacing all diesel buses audience of industry stakeholders, with electric ones is challenging today prominently including business leaders because of the high upfront costs and lack The situation is evolving rapidly, and some of charging infrastructure in India. of the expected scenarios might have However, in India players such as JBM, slight variations. The report reflects our TATA, Olectra and Foton are leading the perspectives as of January 2024. production and mass distribution of We, at 1Lattice, look forward to continuing e-buses and lithium batteries. The the discussion with our friends across government through its FAME initiative is sectors and exchanging notes. also contributing to the sector by Roma Dixit Director- Insights and Consulting, Financial Investors, 1Lattice Executive summary Overview • The government of India has launched several schemes over the years aimed at faster adoption of electric buses in the country - FAME 1 (2015-19): The GoI sanctioned 465 e-buses to various states and provided subsidies worth INR 343 Cr - FAME 2 (2019-24): Phase I saw the deployment of ~2,500 e-buses, with the highest deployment in the states of Maharashtra and Uttar Pradesh - Phase II of FAME 2: Convergence Energy Services Limited aggregated demand for 5,450 e-buses across 5 cities through the Grand Challenge tender • A vast majority of e-buses in India are leased by state governments or State Transport Undertakings - Olectra, Tata, PMI, Switch are some of the biggest Original Equipment Manufacturers (OEMs) in India • The e-bus market encounters significant challenges , including the need for charging infrastructure, restricted distance coverage, and substantial initial expenses © 1lattice | 04 Stakeholders’ perspective • E-buses present a cost-effective and environmentally friendly option despite higher initial capital investment; Lower TCO along with enhanced driving experiences makes e-buses a stable and efficient choice in the long term - Capital investment of e-buses is higher as compared to traditional buses but the TCO is lower due to lower fuel and maintenance costs - E-buses emerge as a more environmentally friendly Road ahead and cost-effective choice over traditional buses, offering greater price stability in the long term • The Government has undertaken - Enhanced ride / driving experiences with electric buses several initiatives like NEBP, PM due to better soundproofing, upgraded features such as e-Bus Sewa Scheme to increase comfortable seating, modern interiors, and lightweight e-buses and developing • Long distance travel by e-buses remains unpopular due to charging stations across India in limited charging infrastructure and limited public the coming years ahead awareness . However, they are gaining popularity in the - Aims to construct 2,877 EV intra-city mobility segment due to the c omfort and charging across multiple affordability they provide states, 1,576 stations across - Bus users prefer buses for travelling distances ranging 16 highways and 9 from 20-500 km expressways by 2030 under phase II of FAME scheme - People choose intercity buses for vacation trips (~65%) and returning to their hometowns (~60%). Intracity buses • GoI also aims to boost are selected for social outings (~65%) and daily production of e-buses and commuting to work (~55%) expanding e-bus fleet by providing PLIs to e-bus - Comfortable seating, AC facility, interiors are some of manufacturers and making the key criteria considered while selecting a bus for crucial investments travel - The first draft of the FAME-III - ~75% individuals who have tried e-buses favor it over scheme has proposed an conventional buses for both intercity and intracity outlay of INR 40-50K Cr to journeys, with the primary reasons being noise promote EVs in the country reduction (~70%) and cost savings (~50% ) © 1lattice | 05 Agenda Overview Understanding stakeholders’ perspective Road ahead E-buses market landscape Majority of the electric buses in India are leased by state governments or State Transport Undertakings (STUs) E-bus OEMs STUs operating e-buses Electric motor manufacturers Charging infrastructure providers Battery manufacturers Press releases, News articles, Secondary research, 1Lattice analysis © 1lattice | 07 Government schemes- Timeline The Indian government has rolled out schemes to expedite the adoption of electric and hybrid buses, supported by financial facilities NEMMP • Launched the National Electric Mobility Mission Plan (NEMMP) 2020 2013 to reduce carbon emissions and promote EVs FAME I (major scheme • Aimed at attaining sale of 6-7M under NEMMP) hybrid and electric vehicles • Direct acquisition of electric buses year-on-year with subsidies offered by the 2015 government The budget outlay was INR 895 Cr • Incentivized purchase of 2.78L xEVs FAME II (Extended version of FAME I) through subsidies worth INR 343 Cr • Allocated ~INR 10K Cr for 3 years to and sanctioned 465 e-buses to support the deployment of 7K e-buses various states 2019 • Focus area was the electrification of public and shared transportation and the establishment of charging infrastructure NEBP • Deployment of 50K e-buses till 2027, supported by a substantial investment 2022 of INR 83K Cr • Aims to achieve economies of scale by PM-eBus Sewa Scheme aggregating demand for e-buses • Introduction of 10K e-buses on a across the country and homogenizing PPP model in 169 cities to enhance the tender conditions & bus urban mobility specifications 2023 • Priority is cities with no organized bus service with central assistance of INR 20K Cr Source(s): Press Information Bureau, Press releases, News articles, 1Lattice analysis © 1lattice | 08 E-buses: STU orders State governments across India have collectively ordered ~15,800 electric buses, with Maharashtra and Delhi being top 2 ordering 6,586 units and 5,046 units respectively Total # orders received by OEMs / Operators State / UT STUs orders Maharashtra 5,150 - - 386 50 700 300 - 6,586 5,046 Delhi - 1,500 2,026 950 570 - - - Uttar Pradesh 200 650 200 500 700 - - - 2,250 Karnataka 50 921 - - - - - - 971 Gujarat 250 150 200 100 - - - - 700 148 Goa 100 - 48 - - - - - 100 Chandigarh - - - 60 - - - 40 Total 5,750 3,221 2,474 1,996 1,320 700 300 40 15,801 Low High Source(s): Press releases, News articles, Secondary research, 1Lattice analysis © 1lattice | 09 E-buses deployment across India: Phase 1 of FAME II Under phase I of FAME 2, a total of 2,435 electric buses have been put into service with highest deployment in the states of Maharashtra and Uttar Pradesh E-buses sanctioned and deployed under FAME 2 High deployment (>400 buses) India Scheme (Phase-I) State / UT # Sanctioned* # Deployed* Medium deployment (101-400 buses) Maharashtra 830 682 Low deployment (1-100 buses) Uttar Pradesh 600 565 Sanctioned but not deployed Gujarat 700 397 Not sanctioned Delhi 400 380 Karnataka 350 150 Chandigarh 80 80 Goa 150 50 Uttarakhand 30 30 Bihar 25 25 Dadra & Nagar Haveli 25 25 Andhra Pradesh 100 20 Odisha 50 20 West Bengal 50 11 Jammu & Kashmir 200 0 Rajasthan 148 0 Total 3,738 2,435 Low High Note(s): The data of buses sanctioned and deployed as on 15.02.2023 Source(s): Press Information Bureau, Press releases, News articles, 1Lattice analysis © 1lattice | 10 CESL GC initiative: Phase 2 of FAME II Based on the learnings from phase I of FAME 2, CESL, a public sector undertaking aggregated demand for 5,450 buses across five cities through ‘Grand Challenge’ Date of announcement Tender size # Cities covered Initiative Grand Challenge 30 September 5,450 5 (GC) Tender 2021 electric buses Key features Gross Cost Contract (GCC) model Timeline: CESL ‘Grand Challenge (GC)’ • Under GCC state retains the ticket revenue & thus • Based on the lessons from Jun 2021 Gazette notification nominating EESL to bears financial risk; private player’s liability is phase-1 of FAME II, NITI Aayog aggregate bus demand under FAME 2 limited to procurement, operation & maintenance identified the need to of buses re-structure the program to: CESL, subsidiary of EESL, launches Sep 2021 Grand Challenge - Reduce tender prices Investor, Operator STUs/ Cities OEMs Dec 2021 NITI Aayog constituted committee to - Homogenize homogenize specifications across procurement Consortium shortlisted cities Electrical Infra specification Jan 2022 RfP for procurement of 5,450 e-buses - Float large scale tender Route planning Ownership launched by CESL State’s • NITI Aayog appointed CESL to Private Revenue Operation scope initiate Grand Challenge player’s Feb 2022 Pre-bid meeting with potential bidders collection Maintenance (GC) for electric bus scope and finalization of homogenized Contract Disposal procurement across 5 cities specifications in response to pre-bid management queries • Five major Indian cities: Delhi, Bangalore, Hyderabad, Kolkata, and Surat Outcome of Grand Challenge • GC aggregated electric bus • Aggregate demand across cities led to the world's largest electric bus tender of 5,450 buses demand across 5 cities, homogenized their • The mega size of the tender contributed to lowering overall bid rates procurement specifications - The tender rate was reduced by 39.8% (from INR 79 per km to INR 48 per km) with the increase in bus lot and carried out the sizes procurement based on Gross • The L1 bid for e-buses without subsidy was 27% cheaper than diesel buses and 23% cheaper than CNG buses Cost Contract (GCC) in Delhi Source(s): CESL report, Press releases, News articles, 1Lattice analysis © 1lattice | 11 Growth barriers Charging infrastructure, limited distance range and high upfront costs are the major challenges faced by the e-bus market in India 1 2 3 4 5 Charging infra- High upfront Limited model Safety Public awareness structure & limited costs availability challenges and perception distance range • Energy density, charging • The initial fixed cost of • The options for electric bus • Safety concerns are • Limited awareness and speed, overall longevity e-buses is generally models are currently critical in gaining understanding among and range anxiety are higher as compared to limited, and transit consumer trust in EVs. the public about the the major concerns for traditional diesel or CNG agencies may find it Risks associated with cost benefits, reliability transit operators who buses due to the cost of challenging to find battery technology, and durability of need buses to cover long the battery technology suitable models that meet such as thermal electric buses impacts distances without and charging infrastruc- their specific operational runaways, fire the acceptance and frequent charging ture requirements incidents and range demand anxiety need to be • EV charging infra is - An average TATA diesel - TATA motors currently • The lack of trust in the addressed unevenly distributed and bus is in the range of manufactures 16 range of e-buses and a significant gap exists INR 20-40L while their models of conventional - Instances such as the absence of between EVs and e-buses start at buses while only that of a BEST e-bus sufficient charging charging stations. For eg, INR 2Cr manufacturing 3 catching fire while stations makes UP has 4.5L EVs but only models of e-buses ; the parked in bus depot customers prefer diesel - Insurance premium for 406 charging stations models differ by size, has been making buses while commuting e-buses is also more battery life, charging customers long distances expensive compared to time apprehensive conventional buses “E-buses are suitable for shorter distances “Traditional buses cost me INR 40-45L and “For e-buses, the running cost is less but the charging “ due to their lower distance coverage range . infrastructure, parking, maintenance, tax, insurance etc. is EVs start from INR 1.10 -1.15Cr . If I increase Diesel buses have higher distance capacity e-buses in my fleet, then my profit will start more. We pay INR 7-8K per bus per month for servicing and higher speed range as well. Hence, we decreasing.” whereas diesel buses go for service once a month costing prefer it for longer distances”. us INR 2.2K per service.” - Owner and proprietor, leased & owned - Business owner, owned buses buses - Manager operation, owned buses ” Source(s): Press releases, News articles, Company websites, Secondary research, 1Lattice analysis © 1lattice | 12 Agenda Overview Understanding stakeholders’ perspective Bus operator Customer Road ahead TCO of e-bus and conventional bus E-buses have a larger capital investment but have a lower TCO compared to conventional buses due to the lower fuel and maintenance costs TCO breakdown (INR/km) TCO per km reduced by ~15% post FAME II subsidy “For e-buses, the running cost is less but the initial payment and insurance is higher. Currently, if I buy more e-buses my profits will 77.75 78.57 go down in the short term but in the long term, along with government subsidiaries, they would 2.7 probably be higher than diesel ones.” 4.43 16.7 - Owned buses, Operations Manager 4.48 61.15 53.77 4.79 10.02 “There is zero maintenance in e-buses unless 1.52 17.45 16.98 there is some malfunction not letting us 4.43 operate properly or there has been an accident. 3.5 We send our diesel buses for service at least 15.57 once a month.” 4.79 17.45 - Leased and owned buses, Owner and Proprietor 17.45 17.45 43.9 “Our e-buses operate primarily within Mumbai (max Lonavala only) due to limited range . It 27.44 needs 4-4.5 hours of charging time. Within 22.08 18.11 Mumbai, I can cover 10-12 trips with my e-bus. The cost of recovery is more in intracity travel as compared to intercity travel.” E-Bus E-Bus Diesel-Bus Diesel-Bus - Owned buses, Owner and Proprietor (12m_AC_BB)** (12m_AC_SB)*** (AC, High End) (AC, Low End) Capital Cost* Sta ff Cost Fuel Ba tt Replacement Maintenance Charging Infra Note(s): *Capital costs include purchase costs and charging infra costs, **12m AC Electric Bus with 320-kWh Battery Pack, ***12m AC Electric Bus with 125-kWh Battery Pack Source(s): Bus operator conversations, World Resource Institute, Secondary research, 1Lattice analysis © 1lattice | 14 Key differences between e-bus and conventional bus E-buses offer a cleaner and more economical alternative to conventional buses in the long run with a lower TCO per km and enhanced price stability Parameters E-buses Conventional buses • TCO per km of a 12m e-bus with a 125-kWh battery pack is • TCO per km of a 12m high-end diesel bus is I NR INR 53.77/km and INR 77.75/km for a bus with a 320-kWh 78.57/km and INR 61.14/km for a low-end model TCO battery pack • For a 9m bus, TCO per km is INR 61.78/km for a • For a 9m bus, TCO per km is INR 49.77/km high-end model and INR 50.09/km for a low-end one • Maintenance costs have increased historically hence with • With a 50% increase in maintenance costs, the TCO a 50% increase in maintenance costs, the TCO per Km of per km of conventional buses rises 8-11% up e-buses rises only by 3-4% up • A conventional bus costs ~INR 40-80L and insur- • An e-bus costs around INR 1.10-2Cr and the insurance ance premium ~INR 50K premium is ~INR 65K • Fixed costs account for around 58% of the total cost Fixed costs • Fixed costs account for 73% of the total cost for a 12m bus for both a 12m high-end and low-end bus with a 125-kWh battery and over 75% of the total costs for a 325-kWh battery • Maintenance & fuel costs account for only 15% for a 12m 125 • Maintenance & fuel costs account for 42% for a 12m kWh battery bus and 10% for a 325-kWh battery (both being high-end bus (INR 33.23 /km) and 40% for a low-end INR 8.2/km) bus (INR 25.59/km) Fuel & • In accordance with the rising trend in electricity and fuel • With a 50% rise in diesel costs, the increase in the maintenance costs, a 50% increase in electricity costs would increase the TCO per km is ~11-13%, making its operation more costs TCO per km by ~3-4%, making its operation more stable and volatile in the future economical in the future Carbon • A 12m e-bus emits 669g of CO per km (g/km) • A 12m diesel bus emits 1,665g of CO per km (g/km) 2 2 Emissions • Expected life span ranges from 8-12 years based on the • Life span ranges from 12-15 years size of the battery • Time taken to fill a bus fully is around 8-15 minutes Lifespan and • Time taken to charge from 0-100% in 6-8 hours on slow depending on the bus capacity Range and 2-3 hours on fast charge • A high end 12m Volvo bus with a 600L capacity can • A 12m bus with a 125-kWh battery can optimally run for 120 cover 180 kms kms on full charge Source(s): Bus operator conversations, World Resource Institute, Secondary research, 1Lattice analysis © 1lattice | 15 Preference for e-buses by bus operators Bus operators prefer e-buses for intracity travel due to lower TCO & maintenance cost, government subsidies and increasing demand Lower operational costs, government mandates, Go Green demand by Voice of bus operators the clients, etc are the key reasons for e-bus adoption Parameters E-buses • Cost of running and TCO is much lower in e-buses than tradi- “The running cost in the case of traditional Lower running tional buses buses is ~INR 7-8/km whereas e-buses cost costs and TCO - For a 9m bus, TCO per km for e-bus is INR 49.77/km whereas INR 1.5/km. For intracity travel, I will switch to it is INR 61.78/km for high-end model of conventional bus e-buses soon. ” Bus operators will prefer e-buses and INR 50.09/km for a low-end model even if reduced / removed subsidies - Owned buses, business owner due to other multiple benefits which • FAME, NEMP, NEBP, and e-Bus Sewa are schemes launched by the will lead to further adoption “Passengers prefer good suspension so that government to promote the adoption of EVs and facilitate subsidies they can enjoy the ride. No one likes the - Government allocated INR 10K Cr for deployment of 7K e-buses Government sound of diesel buses when you are sitting - Assistance of INR 20K Cr under PM-eBus Sewa Scheme next to the engine.” schemes • Belief that the government might mandate the use of E-buses in the - Leased and owned buses, owner and proprietor future has augmented bus owners to include E-buses in their fleet “Our corporate clients are moving to the “Go • Less pollution and lower carbon footprint are a few reasons Green concept” and strictly want EV. EV is customers (specifically big corporations) are increasingly preferring one-time investment, so I have received cost Environmental E-buses benefits.” impact - Many Corporate clients are adopting E-buses for staff - Owned buses, Manager operation commute under the “Go Green” concept • Better soundproofing and suspension leading to an increased “Drivers prefer e-buses more because e-bus- Better ride sense of comfort for customers es never run without AC. While driving CNG experience - Improved amenities and facilities in terms of seats, modern buses, you will get rashes on your body. Diesel interiors, etc buses are very noisy which impacts your body and brain.” • Preference of E-buses by bus drivers due to the buses being - Leased and owned buses, owner and proprietor Better driving lightweight experience • Better equipped with facilities like ACs, comfortable seating Source(s): Bus operator conversations, World Resource Institute, Secondary research, 1Lattice analysis © 1lattice | 16 Agenda Overview Understanding stakeholders’ perspective Bus operator Customer Road ahead E-bus users Bus users prefer bus for distances ranging from 20-500 km; trains are preferred for distances ranging between ~500-1,500 km and aircraft for 1,500 km and above Q. Which mode of transport do you prefer for each interval of distance? Preference for mode of transport (%, N = 300) 1% 1% 2% 2% 4% 1% 3% 7% 14% 18% 17% 12% 29% 4% 34% 38% 12% 48% 49% 1% 61% 54% 14% 71% 55% 65% 23% 78% 63% 64% 52% 8% 48% 30% 50% 8% 39% 27% 21% 21% 1% 17% 10% 3% 1% 7% 5% 5% 3% 2% 1% 0-10 km 11-20 km 21-50 km 51-100 km 101- 201- 301 501- 801- 1201- 1501- >2000 km 200 km 300 km 500 km 800 km 1200 km 1500 km 2000 km Walking Bicycle Scooter / Motorcycle Autorickshaws Car / Taxi Bus Metro / Suburban rail Train Aircraft Source(s): Indian bus user survey (N = 300), 1Lattice analysis © 1lattice | 18 Occasions for choosing intercity vs intracity buses Intercity buses are opted when embarking on vacations (~65%), returning to hometowns (~60%); Intracity buses are chosen for social outings (~65%) & daily commutes to work (~55%) What were the reasons for outstation / intercity What were the reasons for intracity bus travel in Q. Q. bus travel in the last 6 months? the last 6 months? Key selection criteria for buses Occasions for choosing intercity bus Occasions for choosing intercity bus Comfortable (%, N = 197*) (%, N = 203*) / recliner seats Social visits (meet Air conditioning Holiday friends, visit restaurants 67% 63% destination / movie theatre etc.) Interiors Commute to work 53% Travel to 61% hometown Hygienic Shopping 52% Travel to a 54% religious place Local sight-seeing 42% Television Family outings 32% Commute to /other chores 24% school / college Charging point For work: Airport / Train 17% 21% Official visits station travel Private cabin Note(s): *Respondents have used intercity buses or intracity buses or mix of both in the last six months for intercity / intracity travel, Source(s): Indian bus user survey (N = 300), 1Lattice analysis © 1lattice | 19 Preferences and reasons for choosing ~75% of those who have tried e-buses prefer e-bus over conventional bus for intercity & intracity travel; Noise reduction (70%) & cost savings (~50%) are main reasons for choosing e-buses Respondents prefer to travel by e-bus over non-EV / Noise reduction, lower costs are key factors along with conventional buses both for intercity and intracity journeys energy efficiency & health benefits for preferring e-buses Q. Do you prefer e-buses over Q. Do you prefer e-buses over Q. What are the reasons for choosing e-buses traditional / non-e-buses for traditional / non-e-buses for over traditional / non-e-buses? intercity travel? intracity travel? Preference in intercity travel Preference in intracity travel Reasons for choosing e-buses (%, N = 222) (%, N = 203*) (%, N = 197**) 9% 8% Noise reduction 70% 7% 10% 11% 7% Cost savings 51% Greener / energy efficient 50% 74% 73% Health benefits (less pollution) 50% New fleet of buses 40% Yes No Indifferent Haven't tried it yet Note(s): Preference of buses in intercity and intracity travel question was asked only to those who have tried both EV and non-e-buses earlier, *Respondents using e-buses or EV and traditional buses for intercity travel; **Respondents using e-buses or EV and traditional buses for intracity travel Source(s): Indian bus user survey (N = 300), 1Lattice analysis © 1lattice | 20 Agenda Overview Understanding stakeholders’ perspective Bus operator Customer Road ahead Road ahead Despite the challenges, e-buses in India hold a good growth potential backed by several factors like more charging stations, technological advancements, etc Future potential of e-buses in India • Out of 7,090 electric buses approved under the FAME subsidy scheme, 2,435 e-buses are Increase in currently in operation as on 30th October 2023, remaining units are awaiting deployment the number of e-buses • STUs and intercity buses to reach penetration levels of 40-50% by 2030 • The charging infrastructure in India is still developing with 6,586 public charging Expansion stations are operational in India of charging stations • India aims to attain 46,397 stations to achieve its 2030 goals • Public sector company CESL aims to deploy 50K buses by 2028 under NEBP Government policies & • Government announced PLI for companies to manufacture advanced battery programmes cells in India and set up Li-ion manufacturing plants in the country • The government has increased the adoption of lithium-titanate batteries Advancement in technology • Lithium-titanate batteries are improved versions of the lithium-ion batteries “With the government attempting to modernize the fleet with “The cabinet's decision for the deployment of 10K electric buses across major electric buses and total cost of owners works in favor of e-buses, cities, Union Territories, hill states and the northeast region will truly take electric the penetration of the same has been increasing steadily. School buses to the grassroots level pan India. This initiative will now really propel bus segment is yet to see the adoption of e-buses. However, the green public transportation and will aid the development and expansion of an overall penetration will continue to increase going forward.” EV ecosystem across the country. Finally, the momentum gained from this move will catapult India as the EV capital of the world.” - Senior Vice-President & Co-Group Head – Corporate Ratings, ICRA - Vice Chairman & Managing Director – JBM Auto Source(s): Press releases, News articles, Secondary research, 1Lattice analysis © 1lattice | 22 Road ahead The Government has undertaken several initiatives with an aim to increase electric buses and developing of charging stations across India With an aim to increase the electrification of buses Government is focusing on developing charging in India to the grassroots level, GoI has announced infrastructure by incentivizing public and private several schemes like e-bus Sewa, NEBP sector companies, integrating renewable energy, etc National Electric Bus Programme (NEBP) Increase in public charging infrastructure • GoIaims to deploy 50K e-buses pan • GoI has sanctioned the construction India under NEBP by 2027 to bring a of 2,877 EV charging across multiple massive turnaround in public fleet states, 1,576 stations across 16 management of STUs highways and 9 expressways by 2030 under phase II of FAME scheme • It has announced an investment of INR 83K Cr to achieve the target Development of fast charging technology PM e-bus Sewa Scheme • MHI has sanctioned INR 800Cr under • Government aims to deploy 10K buses phase II of the FAME India scheme to 3 along with supporting charging infra PSU oil-marketing companies, i.e. Indian across 169 cities with poor or no bus Oil, Bharat Petroleum, and Hindustan transport facility under the PPP model Petroleum to set up ~7K fast -charging • India and the US to provide joint support stations across the country for a payment security Integration of renewable energy • Government plans to increase renewable energy generation capacity to 500 GW by 2030 . This will help in achieving “Electric buses are expected to witness increased adoption going uninterrupted electricity for charging EVs, cheaper and EV charging forward, aided by the favorable cost economics. While limited Role of Private sector companies charging infrastructure, range anxiety and high capital costs have been the key deterrents in electrification across segments, these are • Private players like Tata Power, Ather Energy, etc relatively low for the bus segment. Overall, ICRA expects that electric are investing in the development of fast-charging buses are likely to account for 8-10% of new bus sales by FY2025. ” technology - Vice President and Sector Head, ICRA Ratings • The GoI has allowed 100% FDI in the EV charging infrastructure sector Source(s): Press Information Bureau, Press releases, News articles, Secondary research, 1Lattice analysis © 1lattice | 23 Road ahead The government, through its policies and key investments, aims to further support the EV initiative aiming to convert all diesel buses to electric in key states by 2030 Government aims to boost production of e-buses Focus is on expanding the e-buses fleet by providing in the future based on the large outlay proposed PLIs to e-bus manufacturers and by making crucial and adoption of better technology investments Promising future based Advancement Increased incentives Role of central and state on FAME-III in technology to boost production governments • The first draft of the FAME-III • The GoI has planned for the • The government has • By 2025, the government scheme has proposed an adoption of lithium-titanate announced INR 18.1K Cr of plans to have about 8K outlay of INR 40-50K Cr to batteries over the old Performance Linked e-buses in Delhi which will promote EVs in the country lithium-ion ones in their Incentives for companies to account for 80% of the e-buses manufacture electric overall fleet • The government is vehicles, components and contemplating both demand • Lithium-titanate batteries • The BMTC is set to advanced battery cells in and supply incentives for are improved versions of augment its fleet of India supporting EVs, and is working lithium-ion batteries and electric buses by 3.5 times on two to three models to can sustain faster charging • The Union Budget recently taking the total number of support the EV industry over rates, have a lower fire risk made an allocation of INR e-buses to ~2K and five years and are lighter 35K Cr has been earmarked aiming to convert all their for crucial capital diesel buses to electric by investments aimed at 2030 Cleaner energy for charging achieving energy transition • By 2030, the government plans to increase renewable energy and net zero targets by 2070 generation capacity to 500 GW, which represents 50% of total energy requirements. If realized, this increase would reduce pollution and provide uninterrupted electricity for charging EVs Source(s): Press releases, News articles, Secondary research, 1Lattice analysis © 1lattice | 24 We are here for you Let us know how we can meet your business requirement? Roma Dixit Director Intelligence and Insights For media queries, Vaishnav Kumar Rai please contact Manager – Corporate Communications E: communications@1lattice.com M: +91 782 794 4925 www.1lattice.com Disclaimer: This material has been prepared by 1Lattice, which is the trade name of Lattice Technologies Private Limited (“1Lattice”, “we” or “our”) with the intent to showcase our capability and disseminate learnings to potential partners/clients. This material can be referred to by the readers on the internet but should be referenced to 1Lattice, if reused or adapted in any form, or medium and on any forum. The frameworks, approaches, tools, analysis and opinions are solely 1Lattice’s intellectual property and are a combination of the collection of the best data we could find publicly, and the 1Lattice team’s own experiences and observations. Any information provided herein is only for informational purposes and you are advised to perform an independent analysis of the same before making any decision based on such information. The information does not constitute any business advice or guidance and is to be construed as a general summary based upon the publicly available information and our interpretation of the same using our resources. For this material, we may have relied upon different sources of information which may be primary sources, publicly available information, and relevant information available with us. We make no representation or warranty, expressed or implied, that such information is accurate or complete, and nothing contained here can be construed as definitive predictions or forecasts. Before reading further, the Recipient expressly agrees that this might not address any and all risks and challenges facing the Recipient, its business, and the markets within which it operates, nor all possible market conditions. Any use of the information provided herein by the viewer shall be at the sole risk of the viewer and 1Lattice or its business partners, affiliates, agents, officers or employees shall not be liable for any unintended or adverse effect or outcome from the use of such information by the reader. 1Lattice does not have any duty to update or supplement any information in this document. 1Lattice shall not be responsible for any business or commercial loss sustained by any person who relies on any information provided herein. Any and all logos of companies used in the information provided herein have been published for information purposes only and 1Lattice does not hold any liability in connection therewith. Enabling Better Decisions 500+ 30% Technology-backed business annual engagements faster to outcomes support that helps you ENABLE BETTER 8 600+ practices years domain expertise DECISIONS Deep on-ground insights that you can act on 130+ 98%+ team members accuracy 4 offices, deep experience across geographies – India, the USA, Europe, MEA, and SEA regions One-ness of data and people networks to 100+ 2.5M harness the collective power of data, network, towns & cities panel members and technology Multi-faceted teams offering a stack of consulting, advisory, and research services 15+ 40:60 languages covered she/he ratio +91 962 522 6697 roma.dixit@1lattice.com Delhi NCR | Mumbai | Bengaluru | UAE | KSA | Singapore