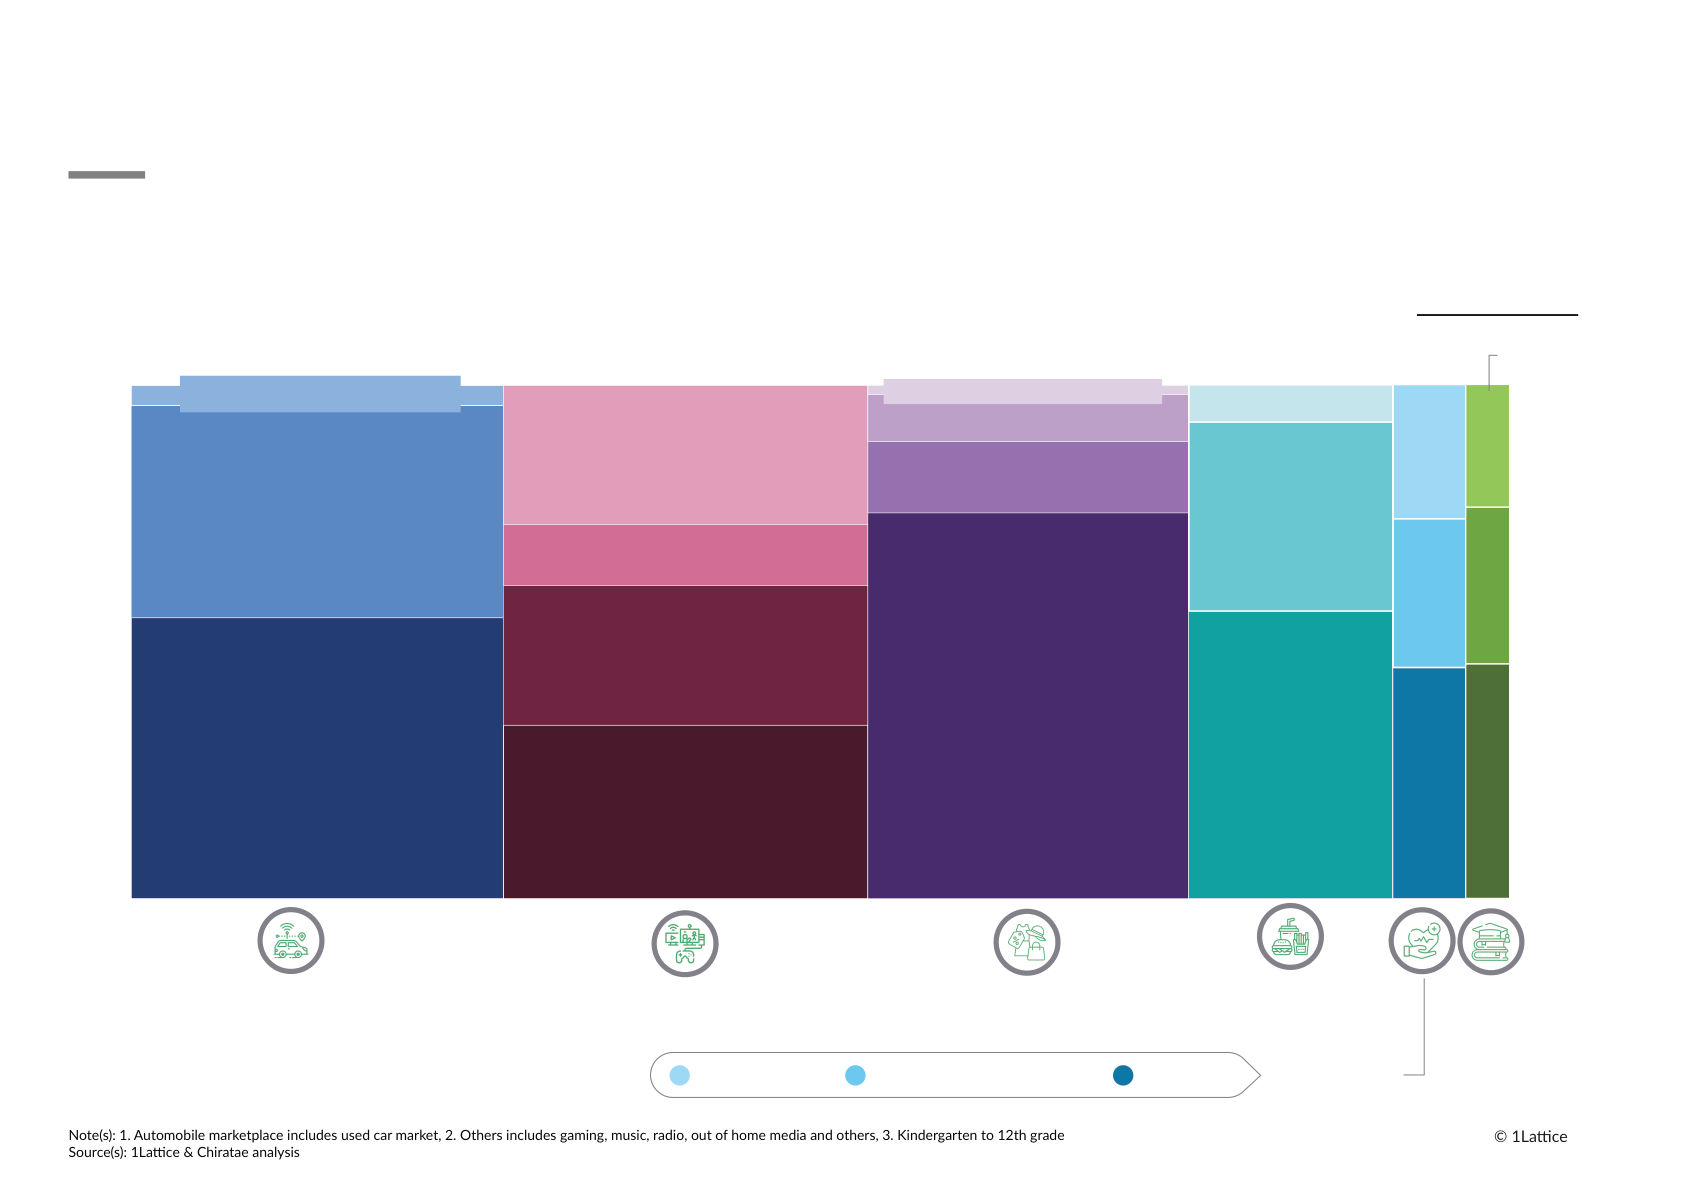
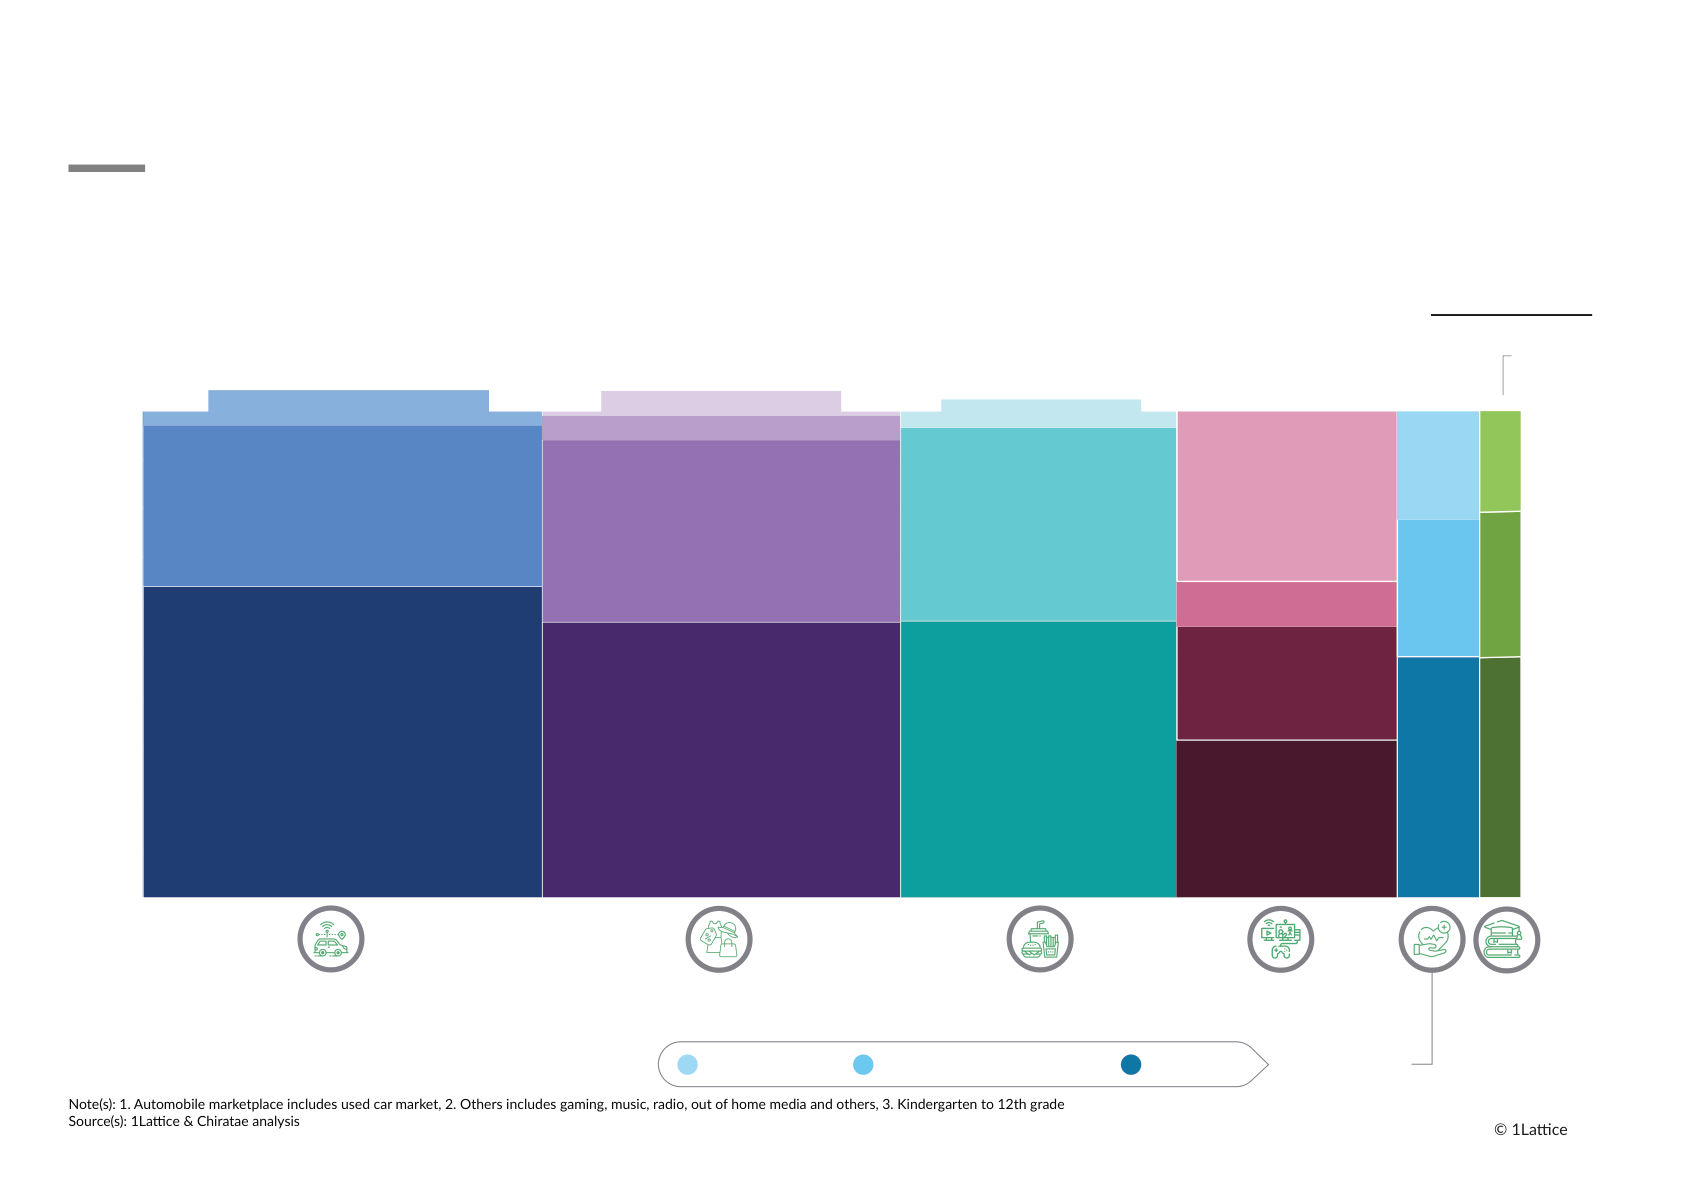
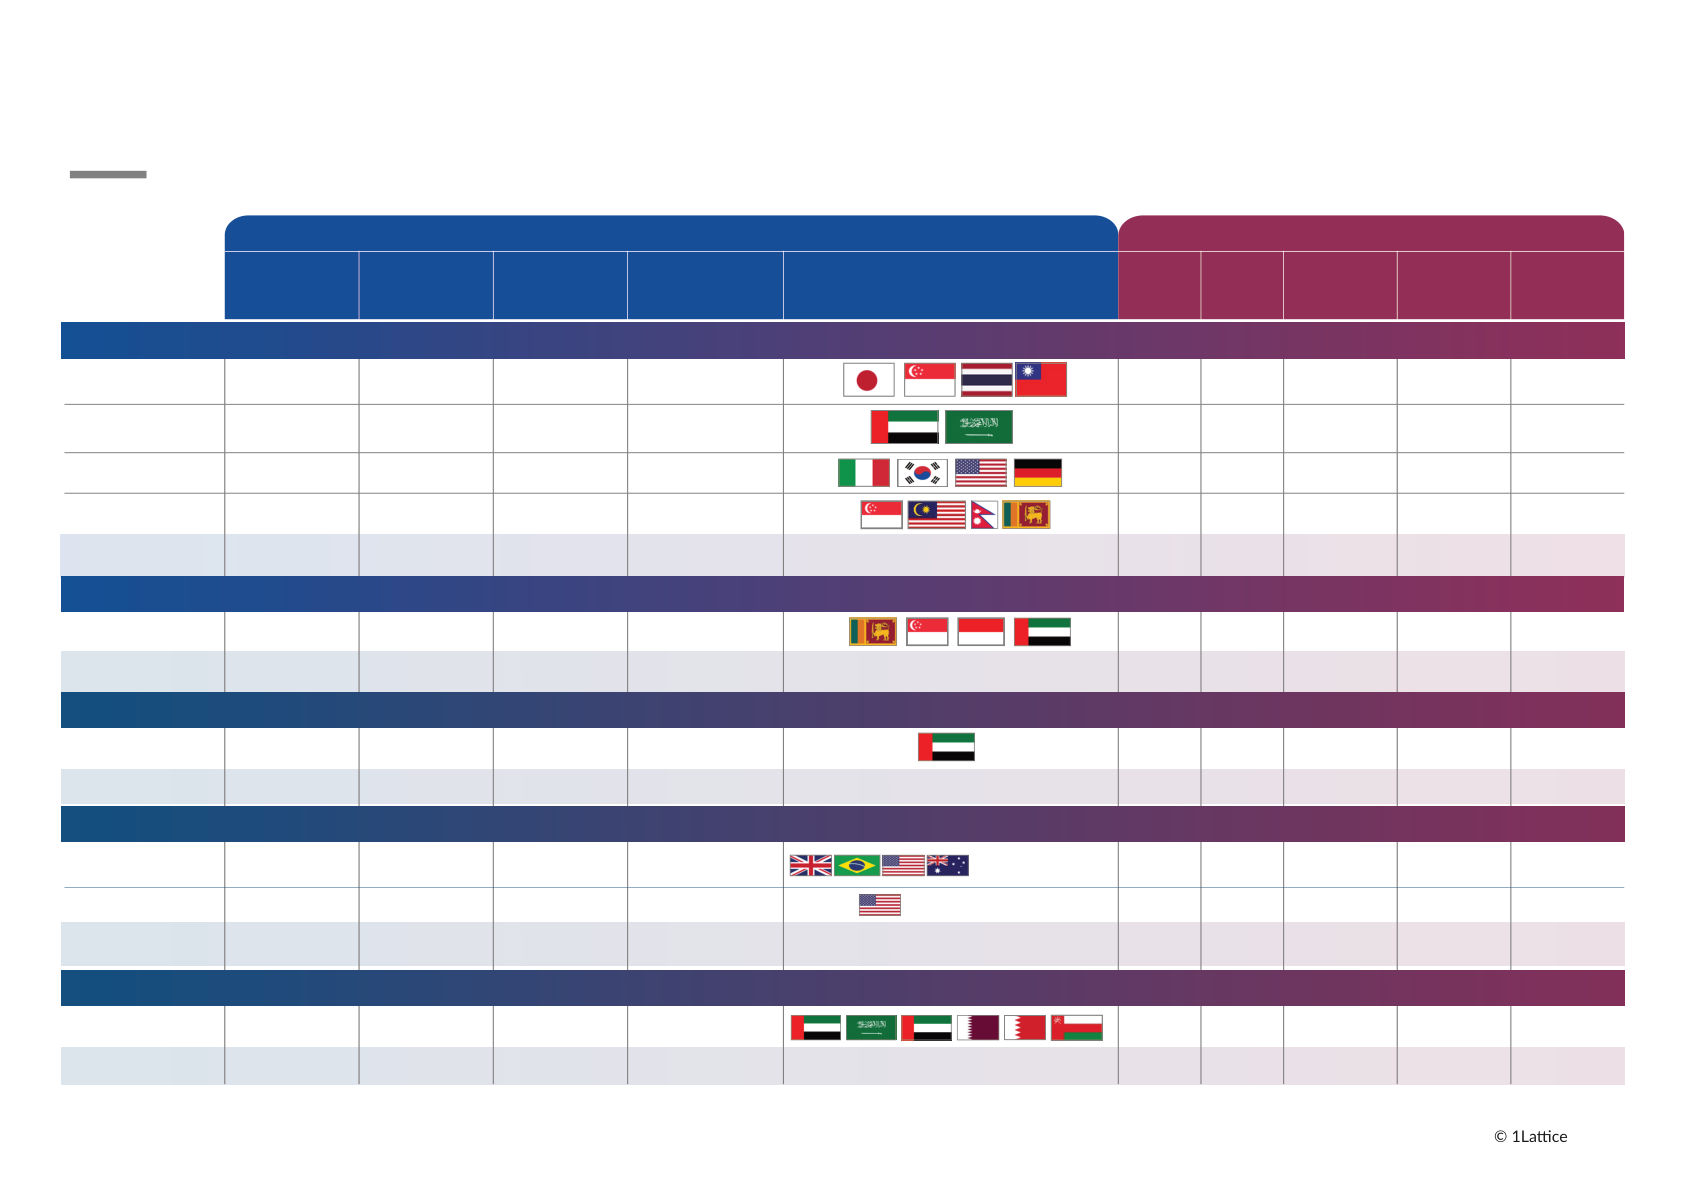
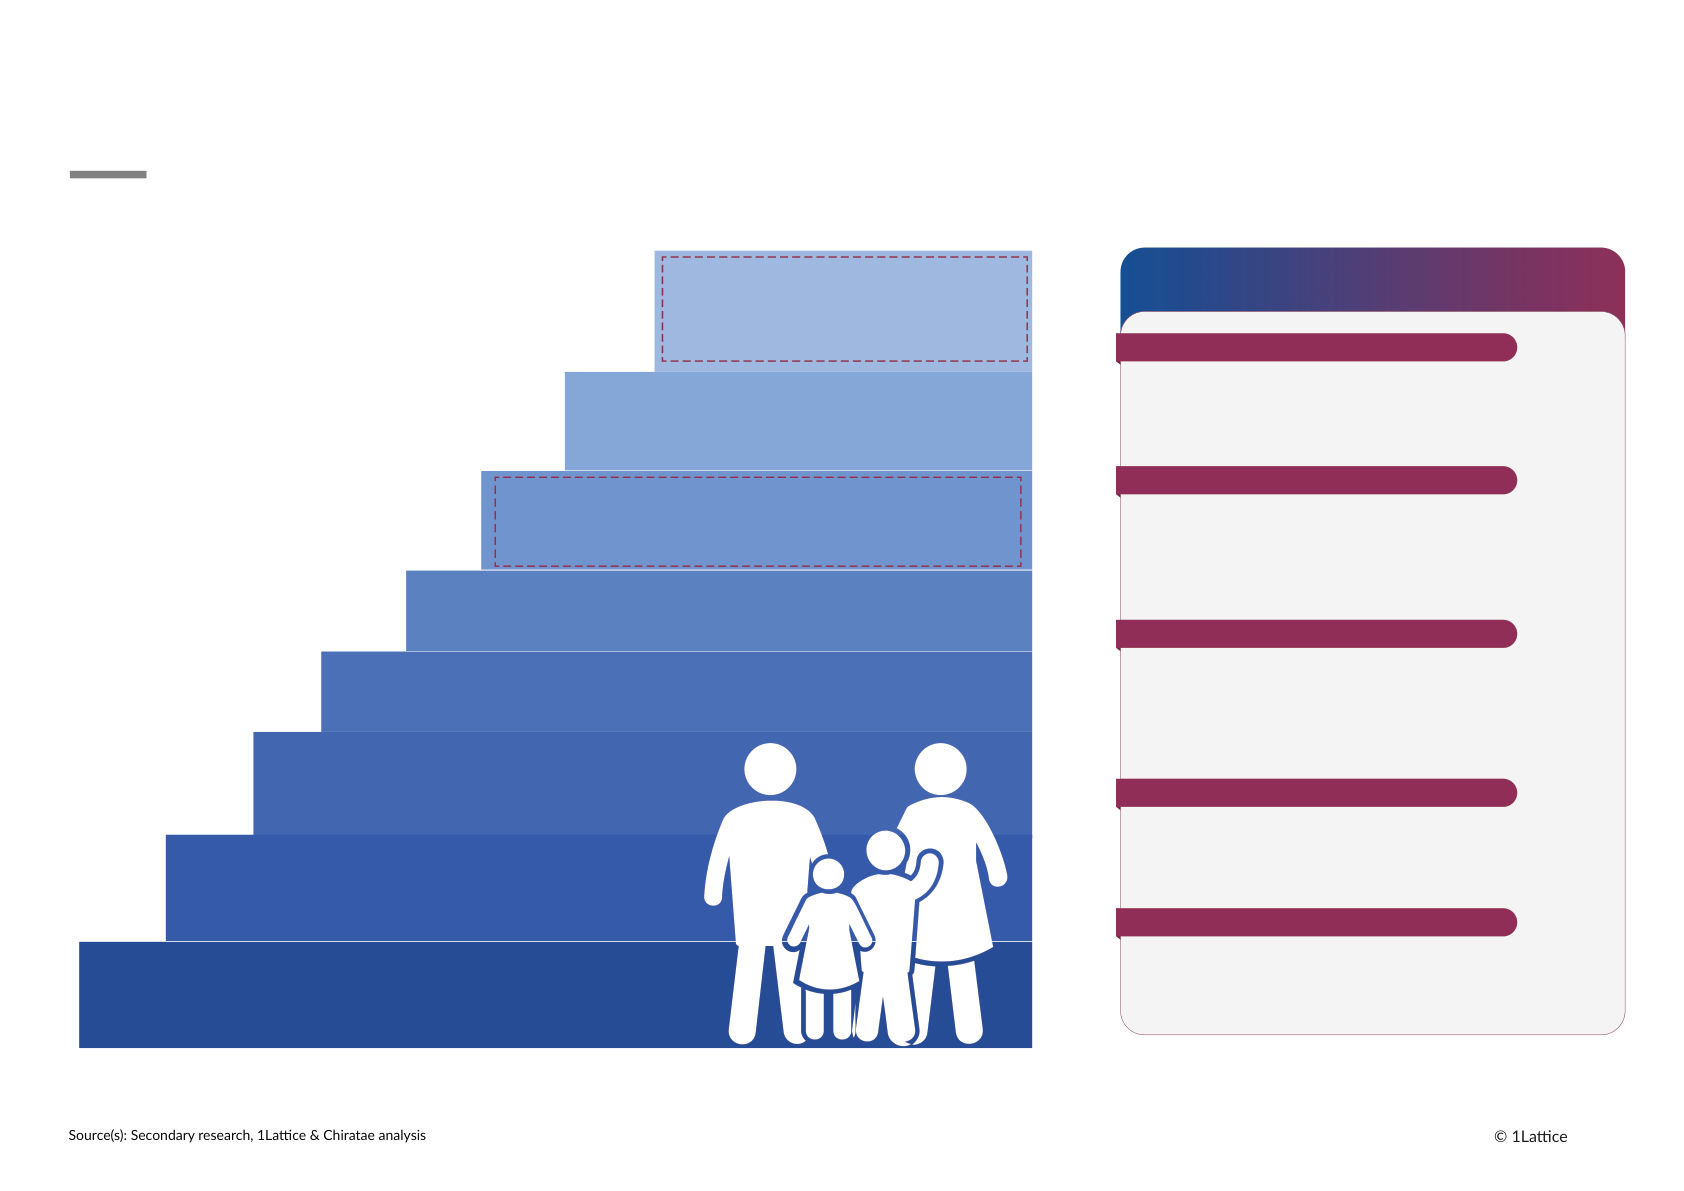
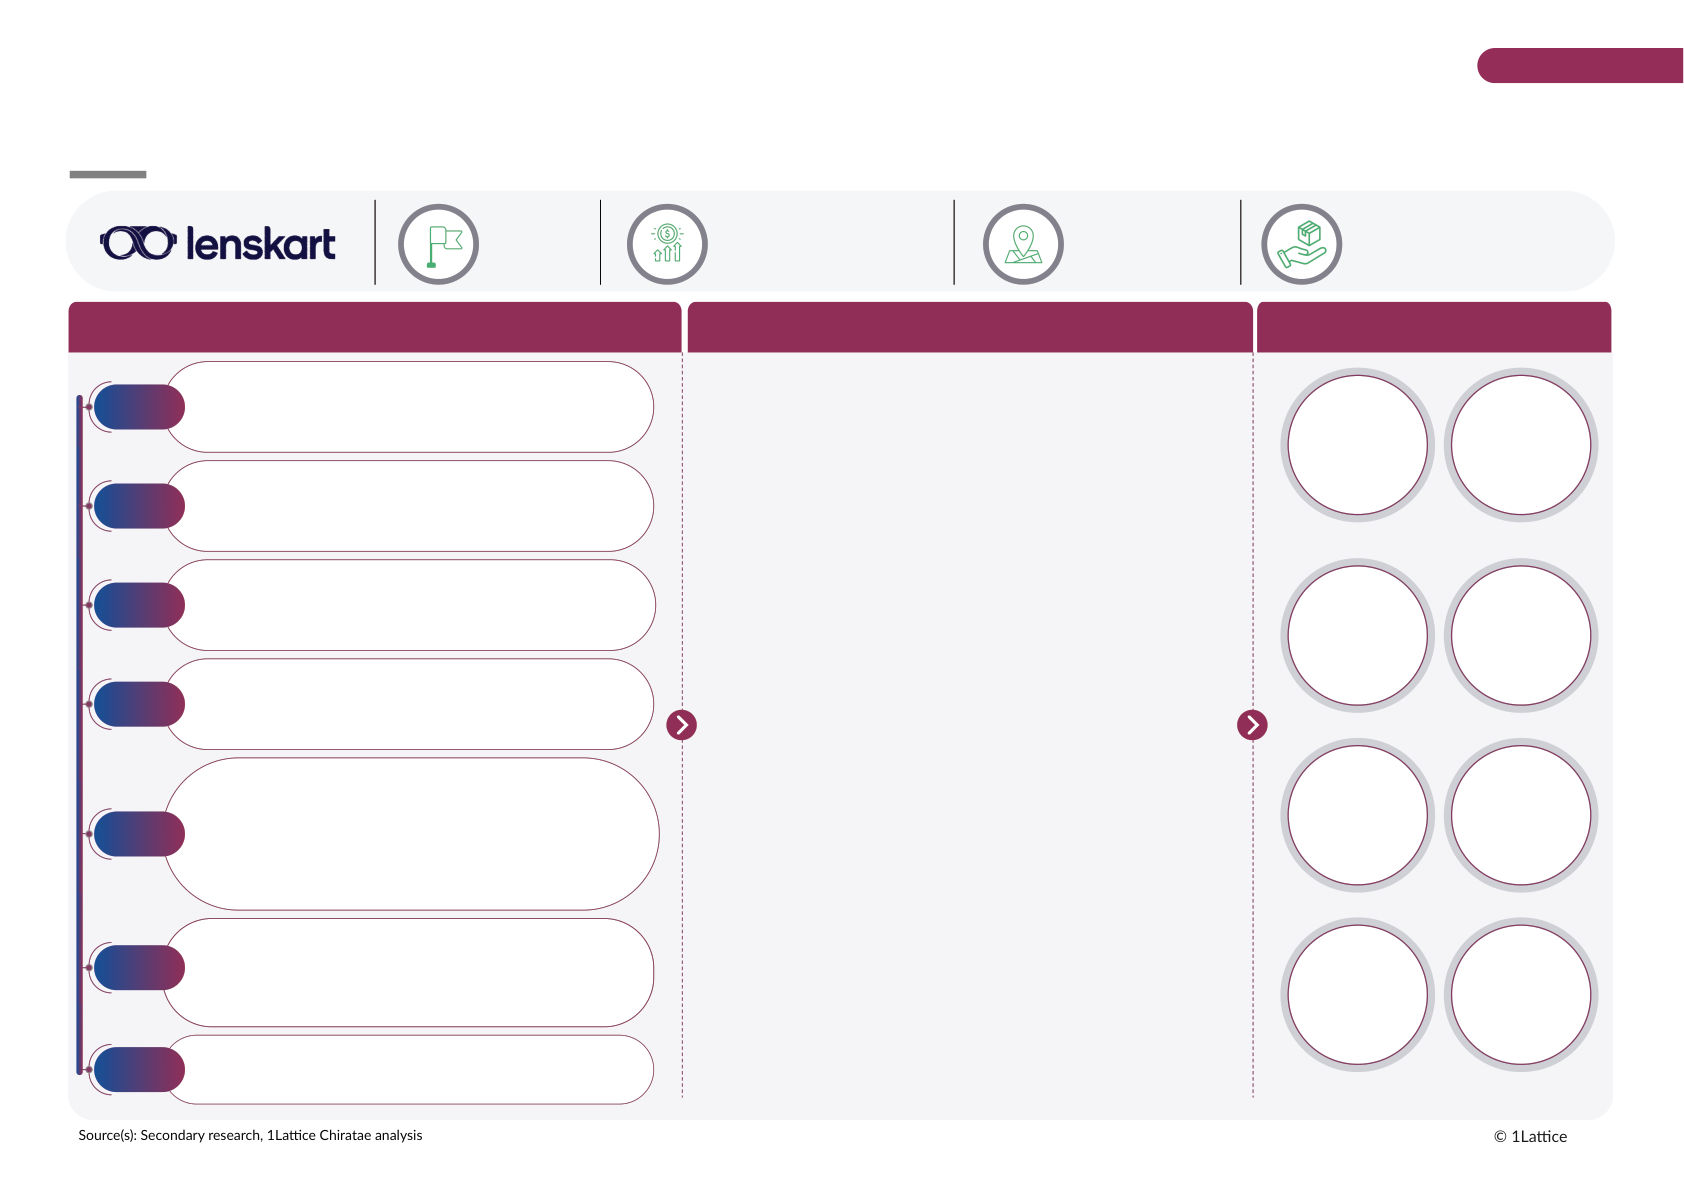
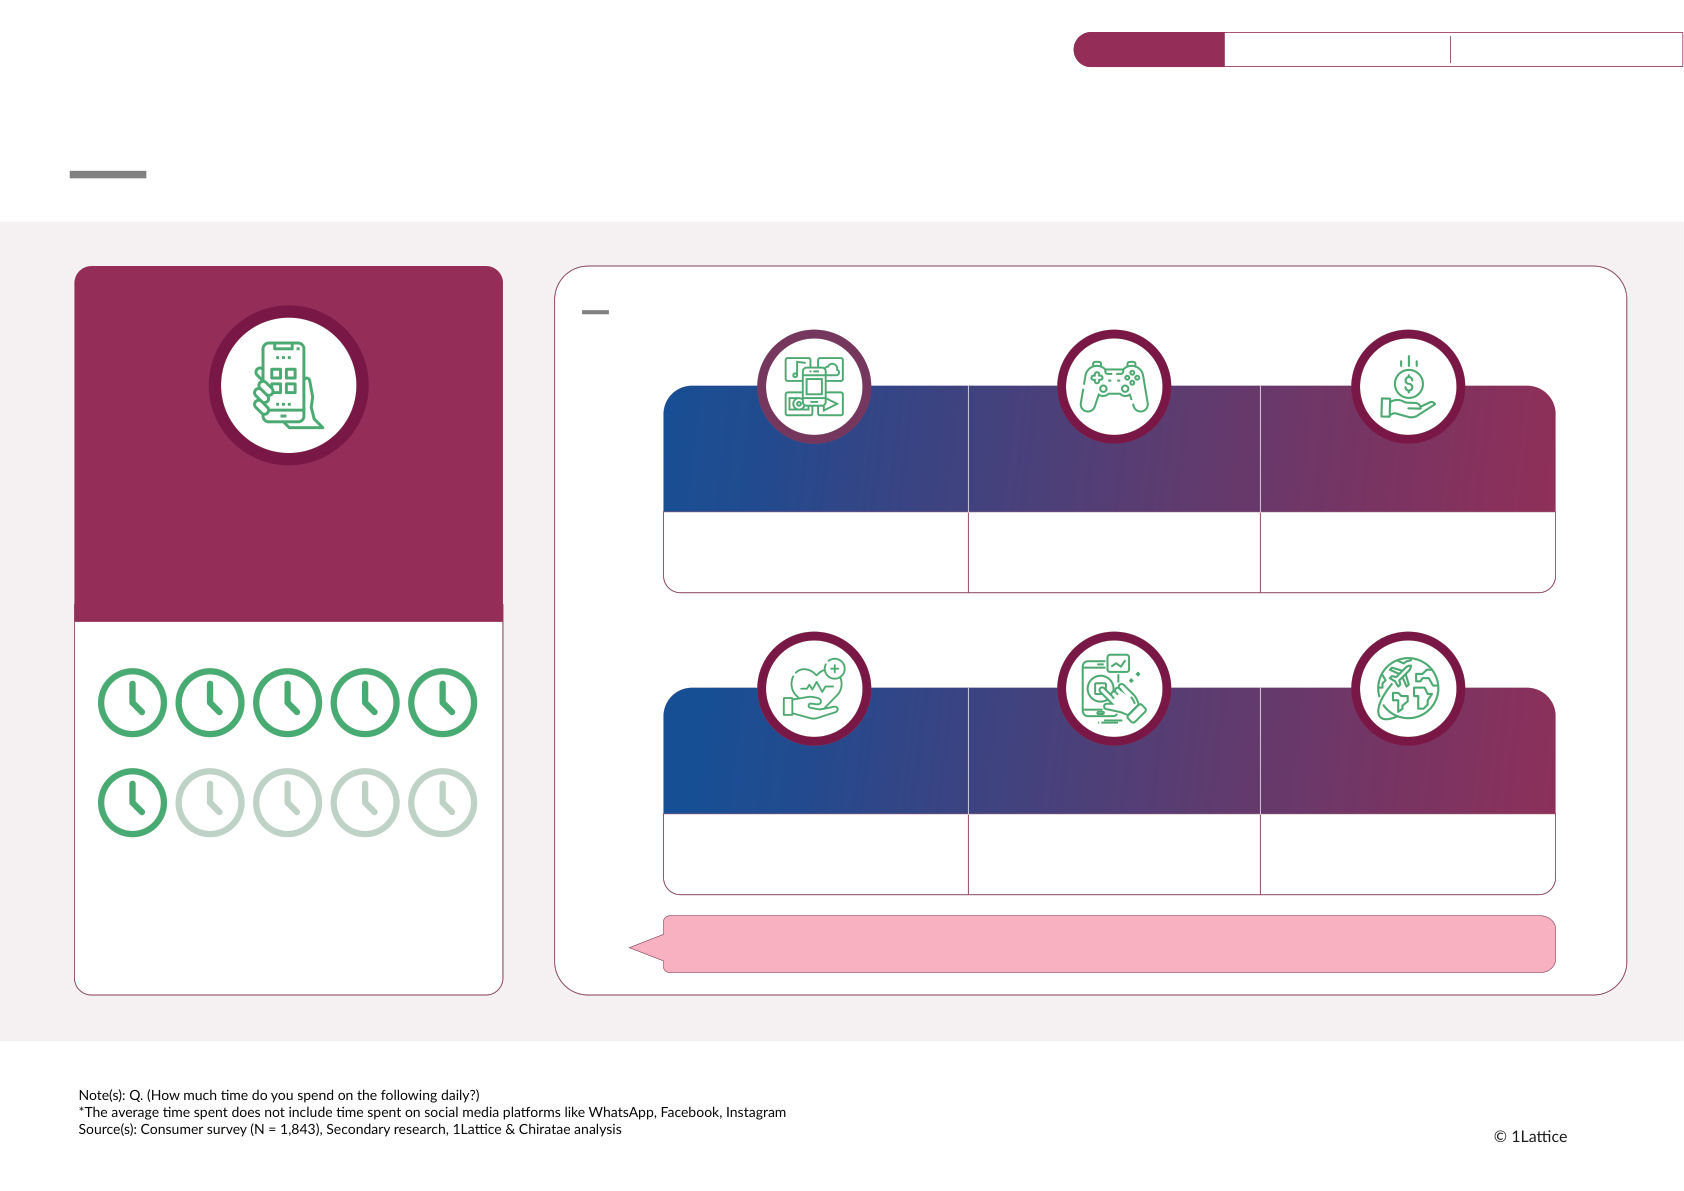
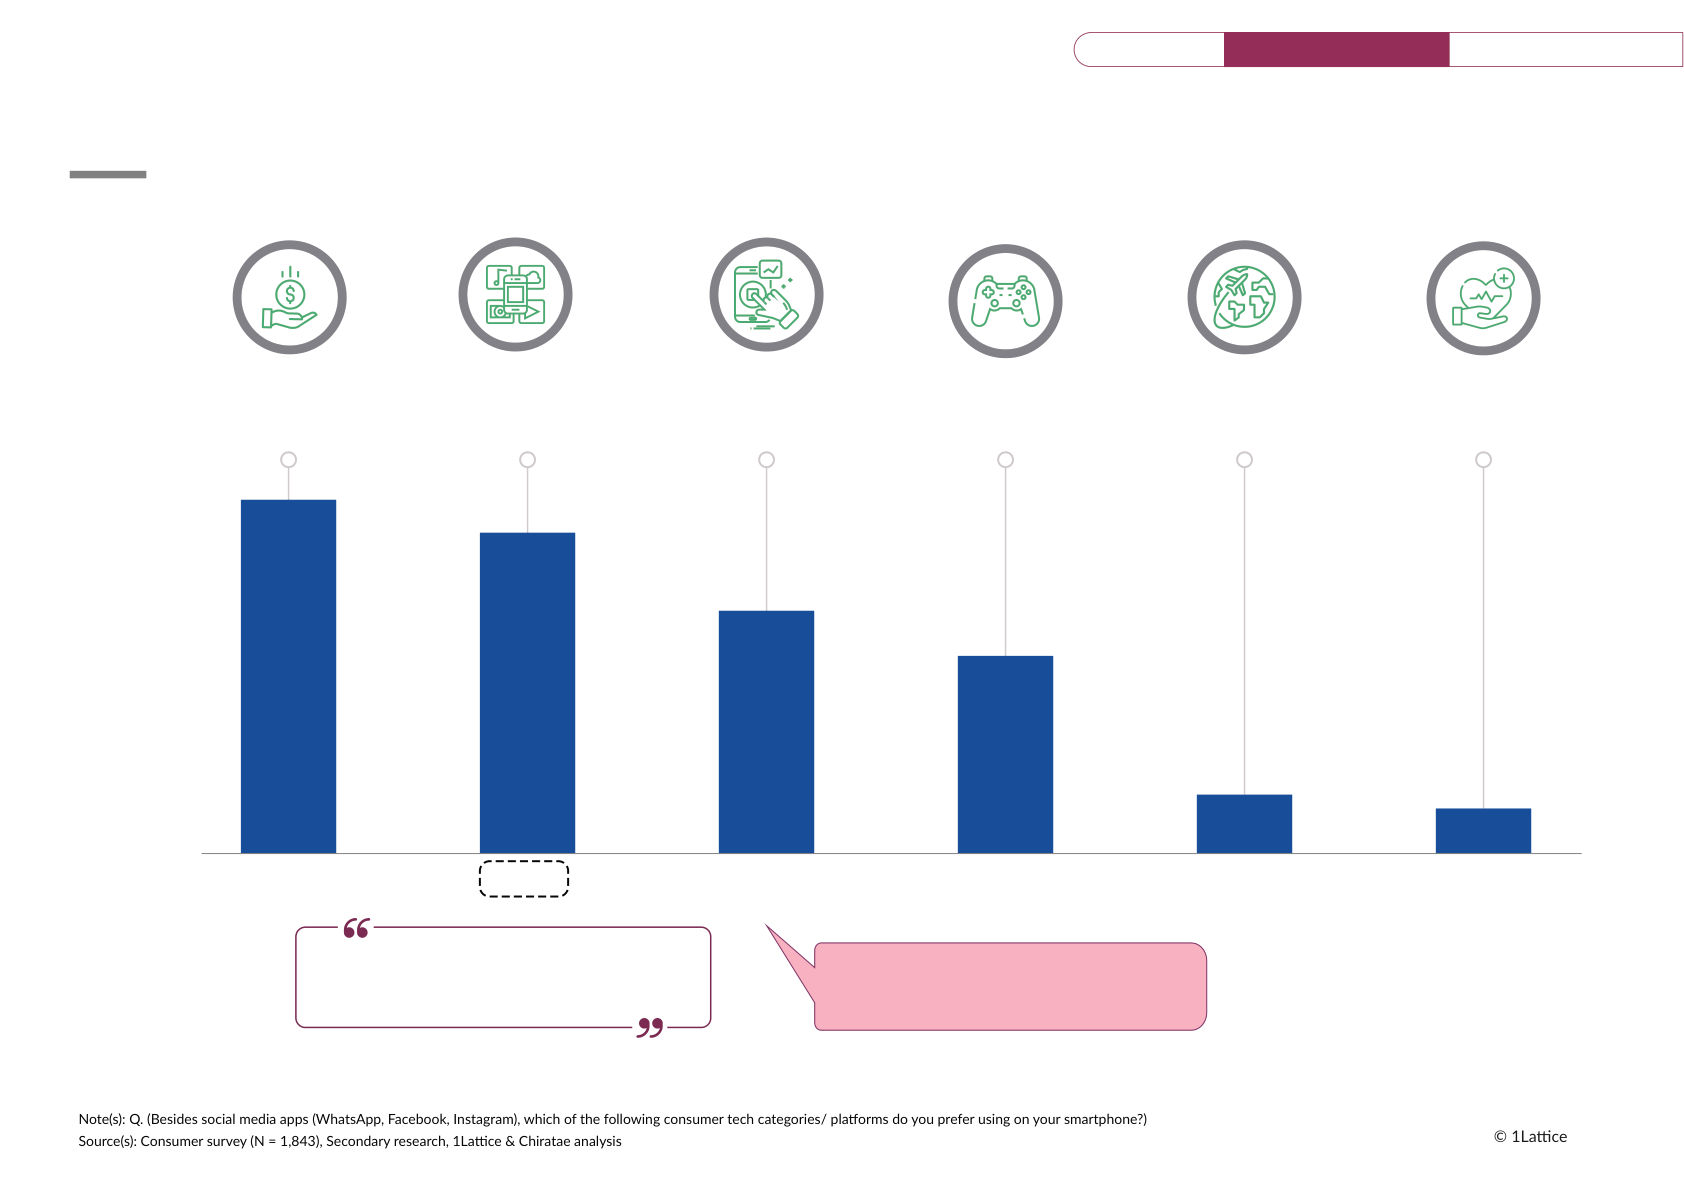
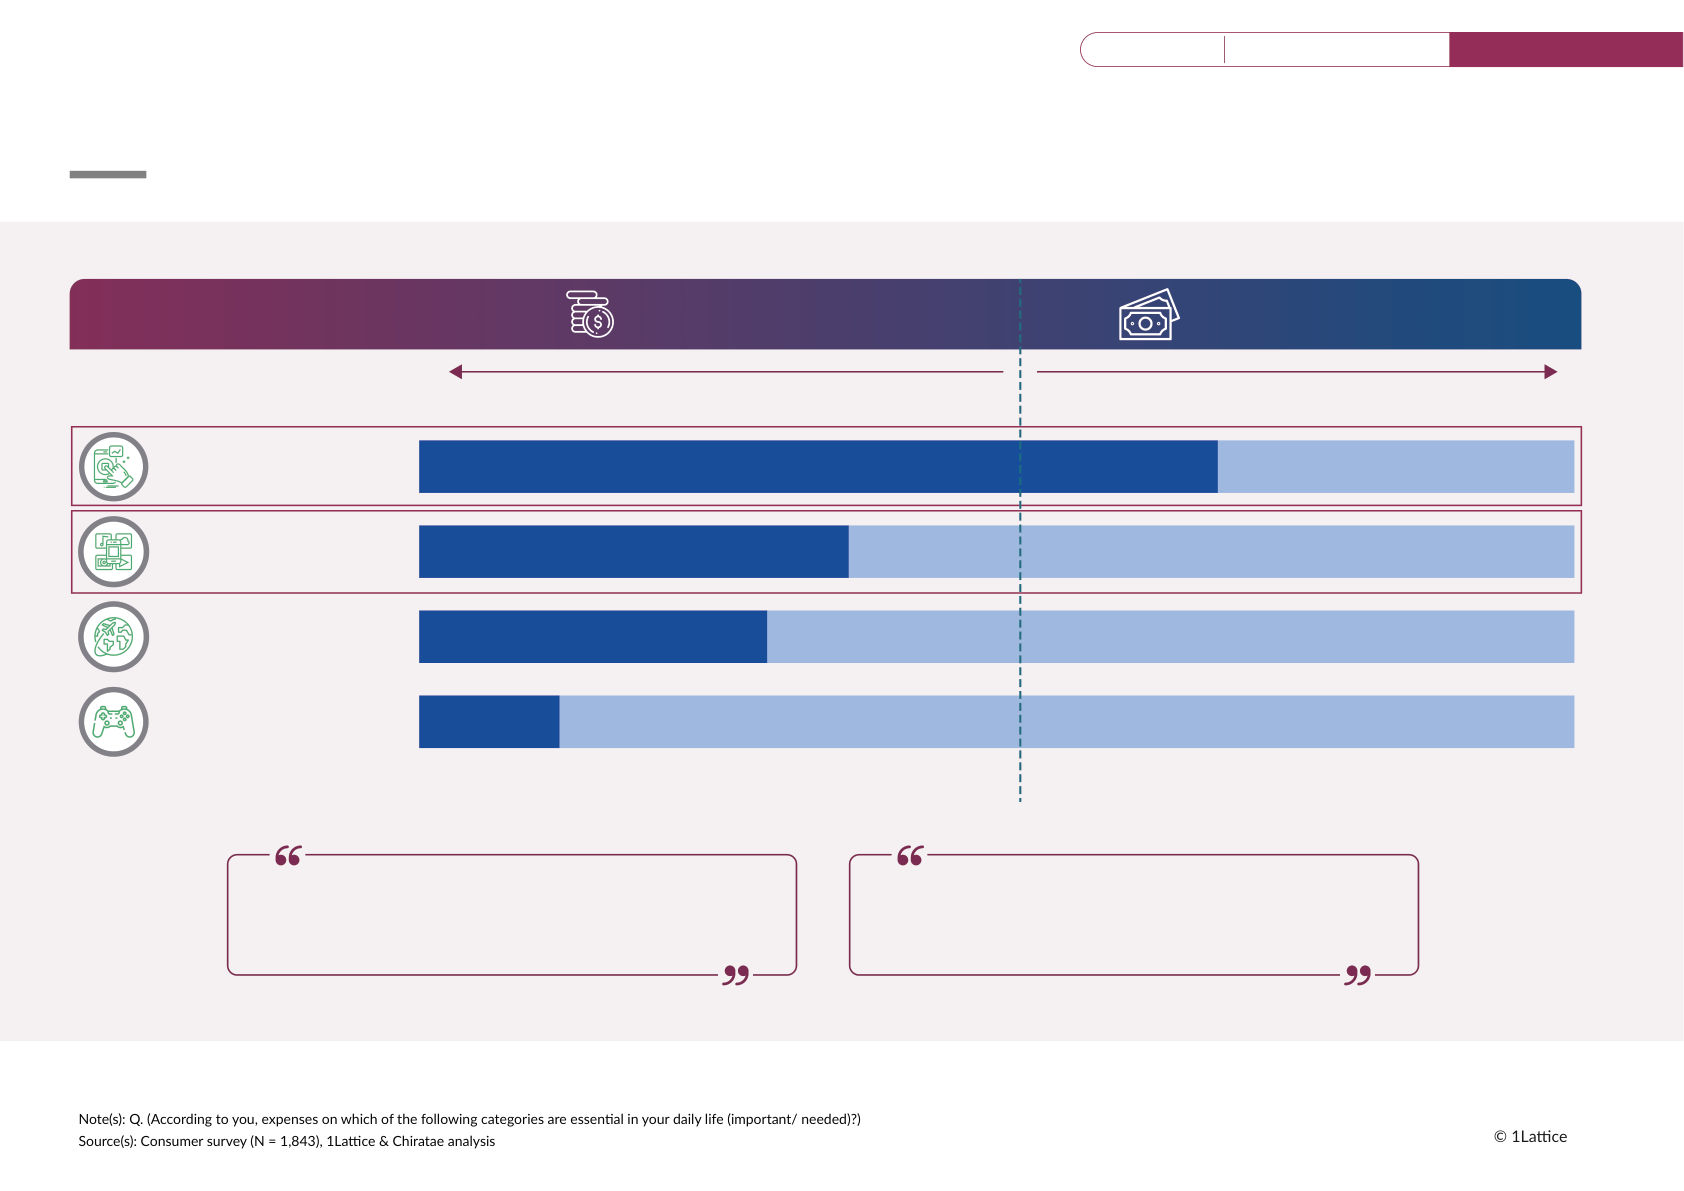
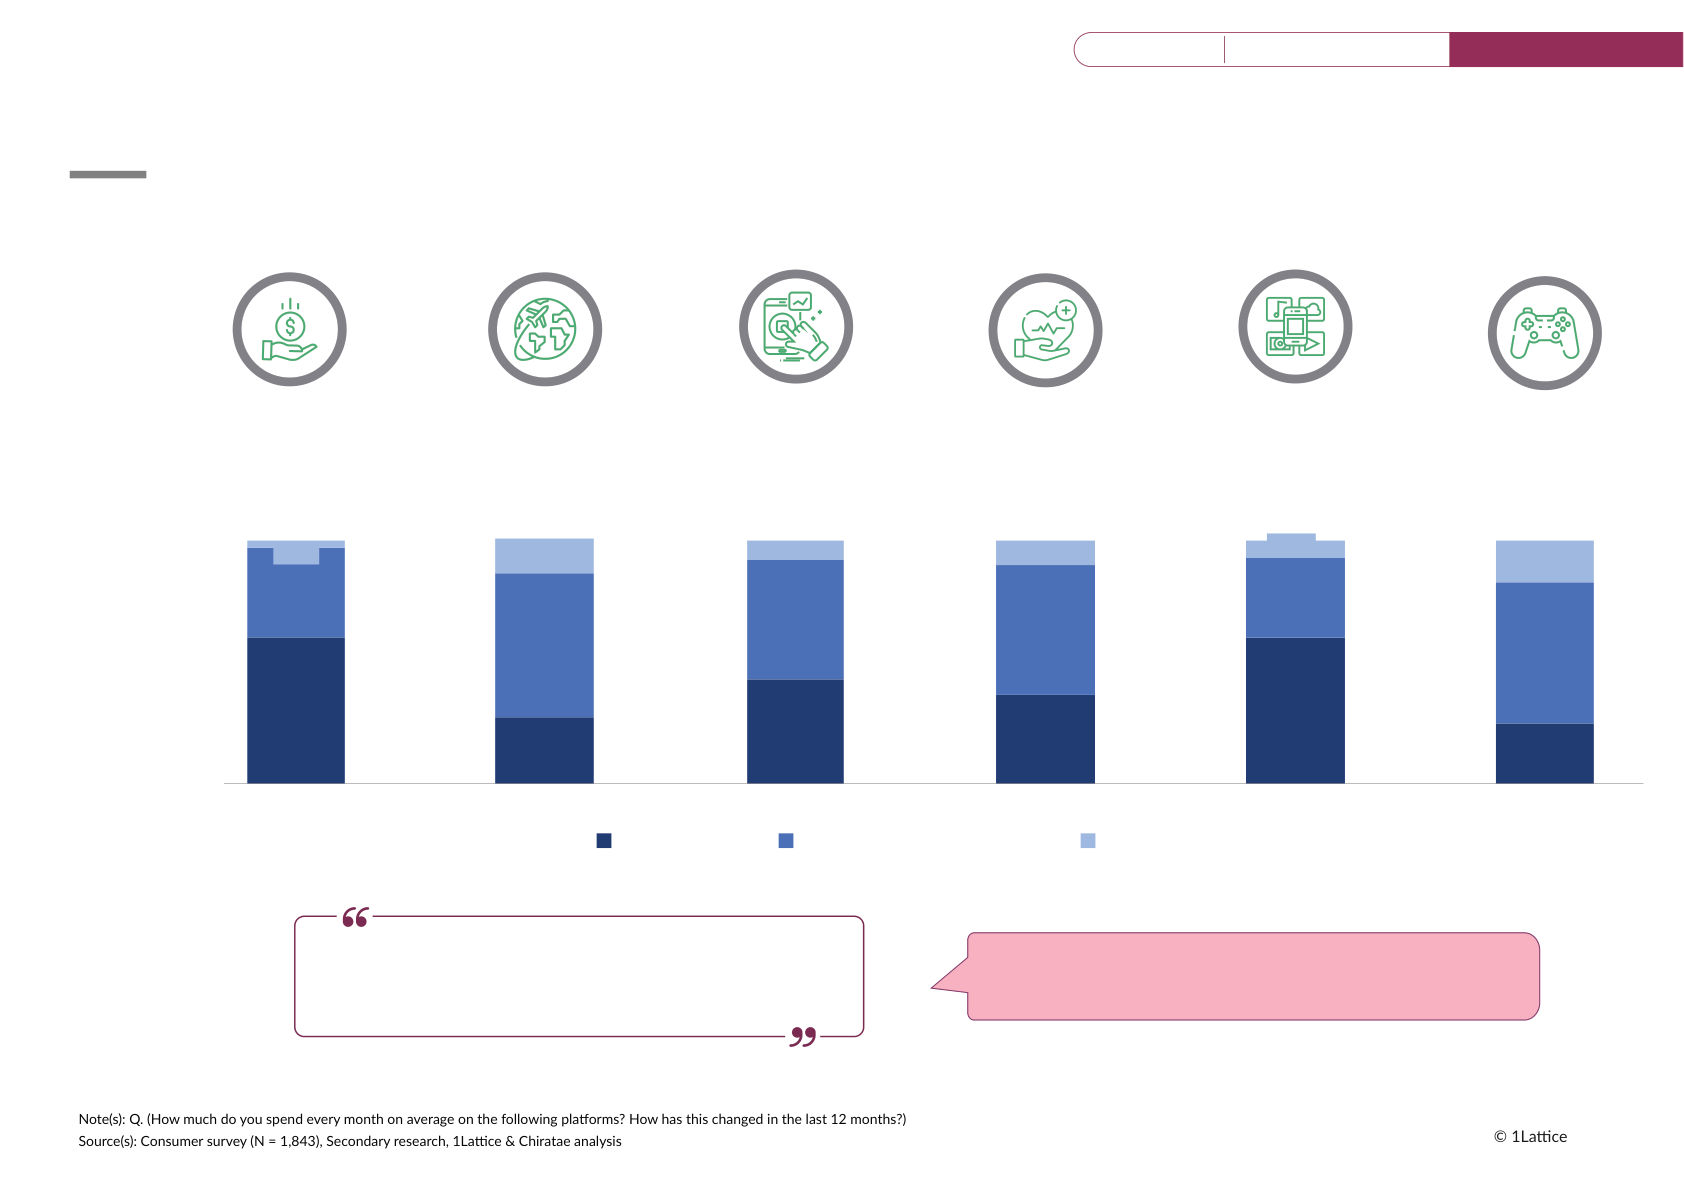
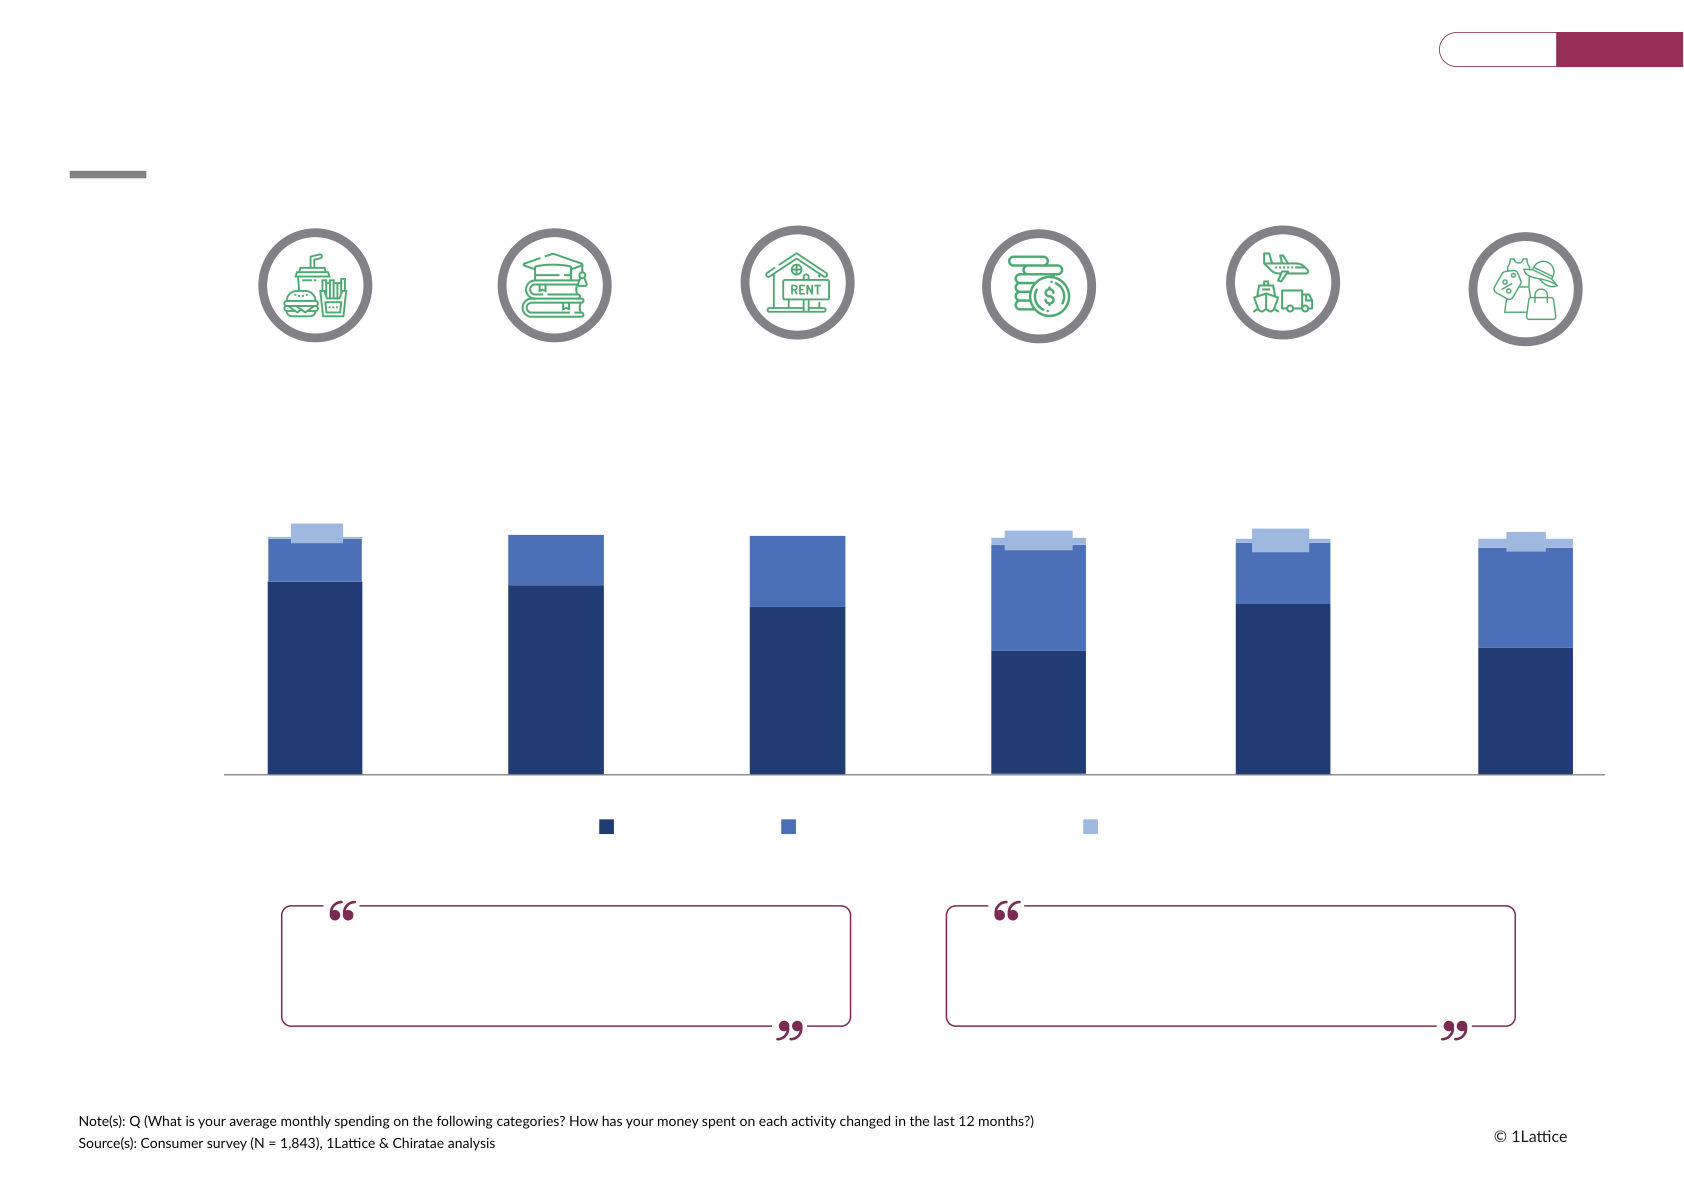
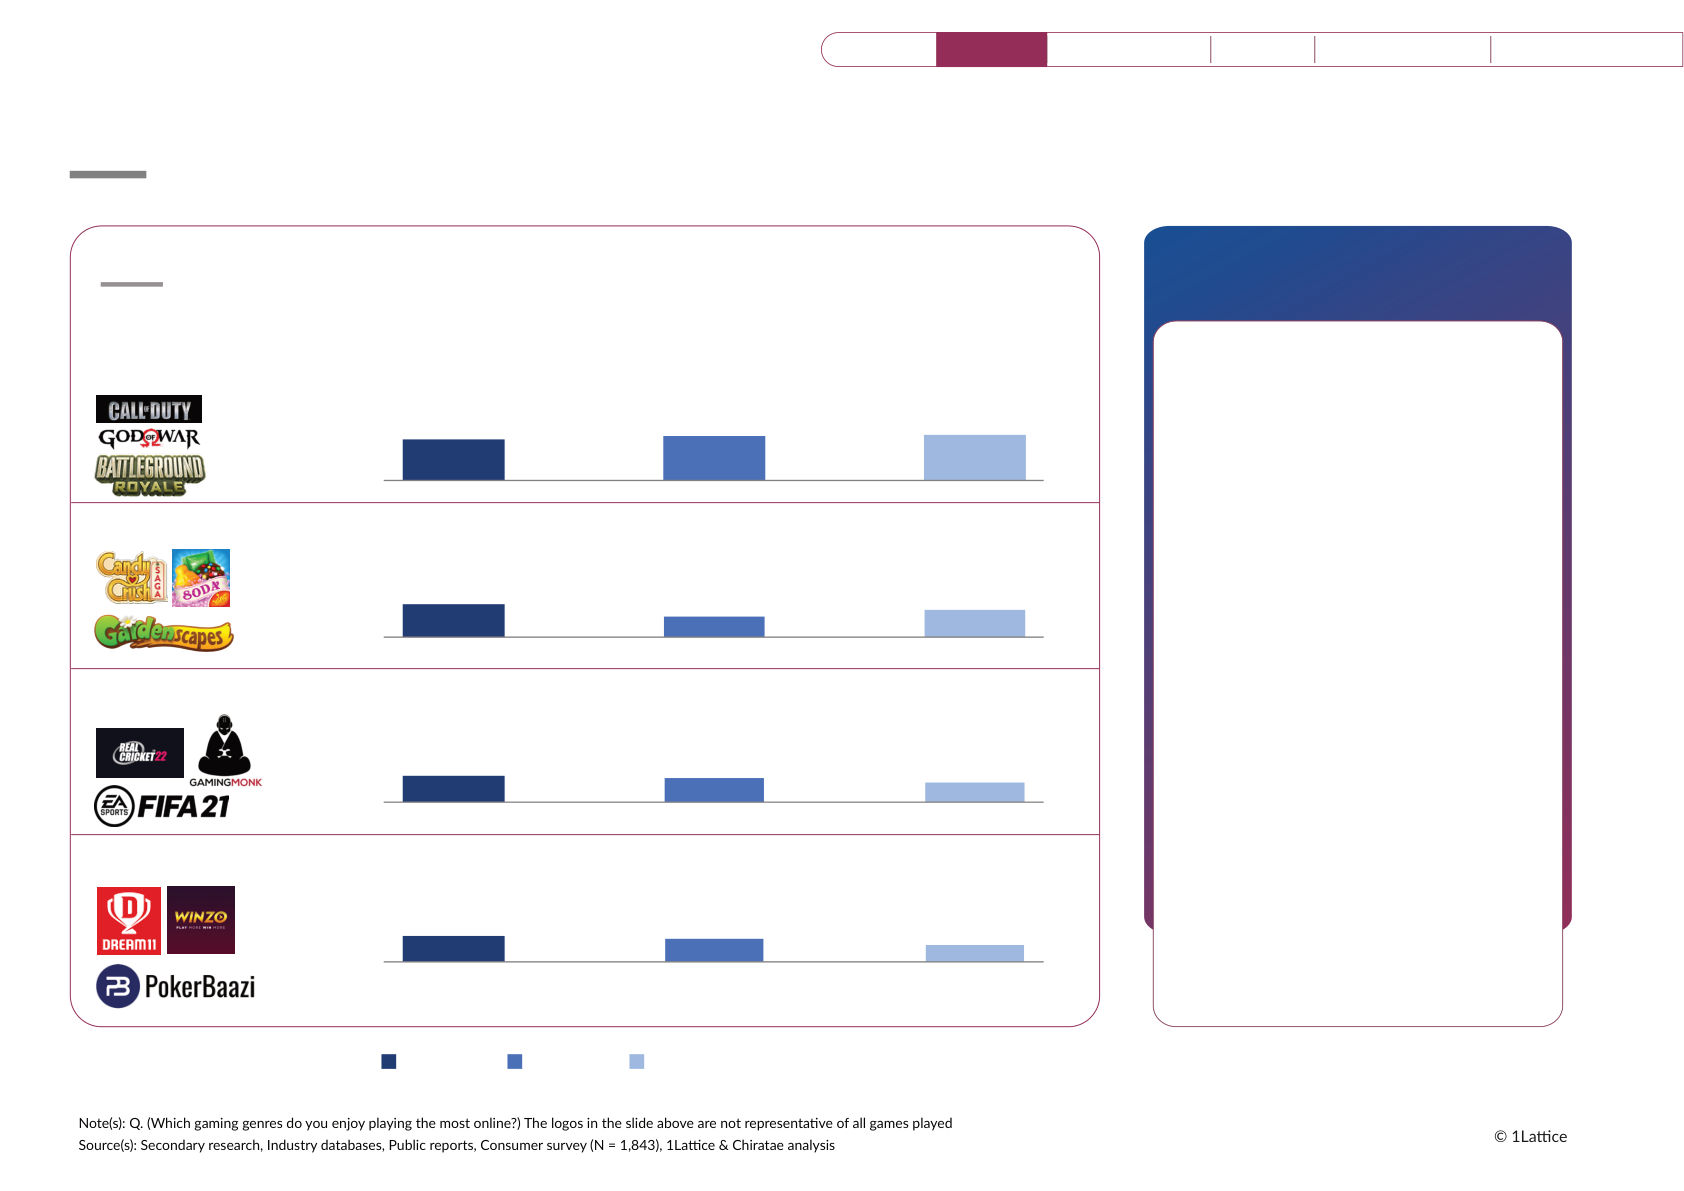
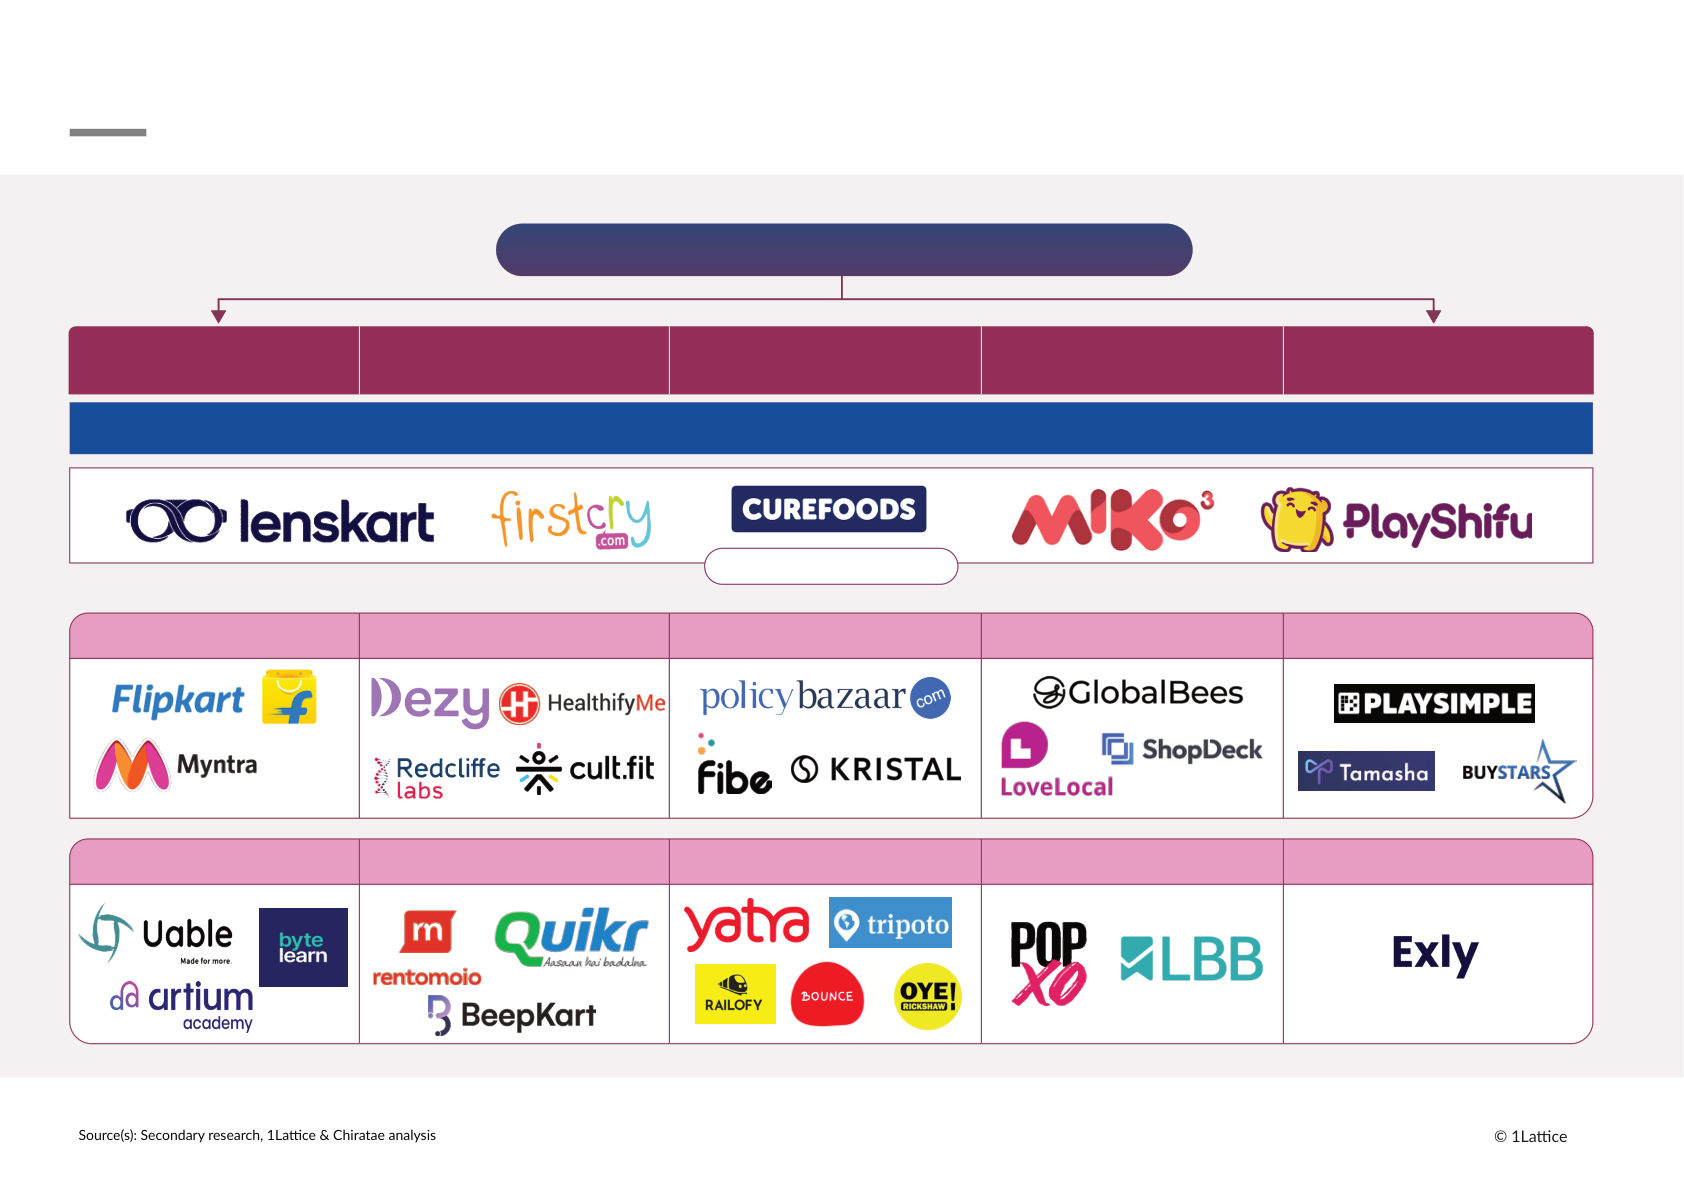
UNVEILING INDIA'S CONSUMER LANDSCAPE Leveraging Digital Public Infrastructure Powered by December, 2023 About the Authors SUDHIR SETHI ANOOP MENON Founder Chairman, Sector head, Chiratae Ventures Consumertech Chiratae Ventures ROMA DIXIT VANSH ATHWANI Director, Senior Associate, Financial Investors Financial Investors 1Lattice 1Lattice ROMA DATTA CHOBEY ABHISHEK PANDEY Managing Director Head Digital First Businesses, Venture Capital & Startups, Google India Google Cloud India has firmly established itself as Chiratae’s ConsumerTech thesis an economic growth engine by hinges around five pillars – Foreword breaking into the top five world population scale solutions, DeepTech ranking in terms of GDP ($); on the product innovation, Vertical integration, Omnichannel and economy by 2030. The last year also Globalization of scaled products. We saw, India becoming the world’s have backed companies such as most populous country overtaking Myntra, FirstCry, Lenskart, which have China. These two factors lay out leveraged four or more of these what we believe are the biggest themes to build marquee tailwinds for the ConsumerTech organizations in this space. The next generation of startups from our portfolio, such as Miko (Emotix), With the Digital Public Infrastructure Aether, Artium, KBCols Sciences have (DPI), India has firmly built out the demonstrated all five of these pillars Technology for the future to democratize access to products and services. 330M+ Indians transact We, hereby, launch a series of today on UPI – a number that is reports – first of which lays out our expected to reach ~750M in the next core thesis in the sector and brings three - four years. The Technology out the nuances of India’s stack also saw an addition in terms consumption story through a of ONDC – whose true impact is combination of deep primary and being observed by all stakeholders. secondary research done in This entire technology stack has partnership with Google and 1Lattice. become a hotbed for innovators and Hope you have a good read and entrepreneurs to build population- contine engaging with us. scale businesses. SUDHIR SETHI Founder Chairman, Chiratae Ventures Agenda ConsumerTech playbook Digital Public Infrastructure & population scale have played a major role in unlocking India’s consumer potential with ConsumerTech market valued at ~US$ 100B (FY22) US, EUROPE, US$ 100B APAC, MENA • Indian • Social commerce , ConsumerTech 500M Indians Fintech, OTT, EV immersive sector stands at shopping & mobile • Expanding Digital • Transformation in ~US$ 100B in FY22, gaming are Public Infrastructure Indian Success factors with the mobility bringing a major has led to, 500M ConsumerTech • Success in the sector holding shift in the global Indians, or 35% of market on the back market hinges on ~30% & consumer space the current of growing Digital factors like p roduct entertainment and with significant population, aspiring Public innovation , media holding 25% impacts seen in the for entertainment & Infrastructure , rising heightened of the total market US, Europe, APAC & gaming services in OTT integration , consumption due to share MENA their daily lives, growing expanding Digital additionally, 220M contribution of Public Indians, or ~15% of women in gaming & Infrastructure , the population, social media as well vertical backward aspiring to spend as higher electric integration , & on-demand services vehicle sales comprehensive omnichannel presence | 05 ConsumerTech in India has a market size of ~US$ 100B; Mobility & entertainment are the most dominant sectors Total Addressable Market (TAM) (%, FY22) Total ~ US$ 99B ~ US$ 36B ~ US$ 25B ~ US$ 18B ~ US$ 14B ~ US$ 3B ~ US$ 3B 100% Jewelry & watches, 2% Online car rental market, 4% Cloud kitchen, 7% Beauty & personal care, 9% 90% Reskilling 2 24% Others , 27% 11% & online Footwear, 14% 80% Food and Ride-hailing apps, 37% grocery, 37% 70% Print, 12% Test 30% 60% 36% preparation 50% Digital media, 27% 40% Apparel & accessories, 75% Automobile marketplace¹, 59% 30% Food delivery, 3 54% 46% K-12 20% Television, 34% 56% 10% 0% Mobility Entertainment Fashion Food Education & media E-consultation Health & wellness apps Pharmacy Healthcare | 06 ConsumerTech in India is expected to have a market size of ~US$ 300B by 2027, growing at a CAGR of ~25% per annum Total Addressable Market (TAM) (%, FY27P) Total ~ US$ 281B ~ US$ 83B ~ US$ 73B ~ US$ 58B ~ US$ 42B ~ US$ 19B ~ US$ 6B Jewelry & watches, 2% Online car rental market, 3% 100% Cloud kitchen,3% Footwear, 5% Test 21% 90% 22% preparation 2 Others , 36% 1 80% Automobile marketplace , 33% Beauty & personal care, 37% Food & grocery, 40% 70% Reskilling 28% 30% & online Print, 8% 60% 50% Television, 24% 40% Ride-hailing apps, 64% Apparel & accessories, 56% 30% Food delivery, 57% 49% 3 50% K-12 20% Digital media, 32% 10% 0% Mobility Fashion Food Entertainment Education & media Health & wellness apps Pharmacy E-consultation Healthcare | 07 Indian startups are now looking at global expansion after seeing higher revenue growth, fueled by a growing digital native user base Operating scale Platform engagement IG FB Google Latest Post-Money Players $ Funding $ Annual DAU / WAU/ International presence 1 followers followers reviews funding valuation till date revenue MAU MAU E-commerce 25.7% 4.2 748K 1.5M $830M $455M $100M $4,500M 5.7% Lenskart FirstCry $965M $631M $31M $2,700M 5.9% 26.5% 4.4 1.1M 2.1M 3 2 Sugar $82.2M $30M $0.61M $100M - - 4.5 2.7M 0.5M Mamaearth $126M $180M $0.76M $1,050M 13.3% 26.7% 4.1 1.3M 0.43M Sub-total $2,003.2M $1,296M $132.4M $8,350M Online services 3 BookMyShow $225M $33.3M - - 5.4% 27.9% 4.3 259K 7.6M Sub-total $225M $33.3M - - FoodTech 3 - - FreshToHome $291M $10M $104M $566M 4.2 39K 0.14M Sub-total $291M $10M $104M $566M EdTech 3 BYJU’s $4,680M $1,340M $250M $5,100M +116 countries - - 4.1 264K 1.2M $47M $31.2M $10.5M $302M +140 countries - - - - 0.02M Miko Sub-total $4,727M $1,371M $260.5M $5,402M Others Dailyhunt $129M $217M $9.84M - - - 4.5 238K 1.3M - $129M $217M $9.84M Sub-total Note(s): 1. Post-Money valuation includes primary funding 2. As of February 2021; 3. Annual revenue reported as of FY2022; DAU- Daily active users, MAU – Monthly active users, WAU – Weekly active users, st *FY2020-21 data, Annual revenue values as of 31 March 2022 . | 08 Source(s): Secondary research, Tracxn, 1Lattice deal databse, 1Lattice & Chiratae analysis ~500M people in India aspire to spend on digital entertainment; ~15% of the total population aspires to spend on ‘on-demand services’ Key emerging macro trends 220,000,000 220M people in India aspire to spend on ‘ ON-DEMAND SERVICES’ Increased focus on personalization Population • Consumers are increasingly seeking out 280,000,000 personalized products / experiences that 280M people in India aspire to spend on cater to their individual needs & preferences scale & needs ‘ TRAVEL’ Rise in experiential retail 500,000,000 • High demand for experiential retail 500M people in India aspire to spend on experiences, where consumers can ‘ DIGITAL ENTERTAINMENT’ engage with products & brands in a more immersive way 700,000,000 700M people in India seek good ‘ EDUCATION’ Growing influence of social media • Influencer marketing & other social 880,000,000 880M people in India aspire to spend media-driven marketing strategies are on on ‘ FASHION & APPAREL’ the rise, as brands change their marketing approach 1,100,000,000 1.1B people in India have a bank a/c & Increase in disposable income seek to invest in ‘ FINANCIAL SERVICES’ • Growing Indian economy has led to an increase in disposable income, & higher 1,200,000,000 levels of consumer spending 1.2B people in India need good ‘ HEALTHCARE’ Digital adoption • Significant rise in digital adoption, as more 1,400,000,000 people have access to internet & 1.4B people in India need ‘ FOOD’ smartphones today | 09 Pillars of success: Indian ConsumerTech playbook Product Higher consumption due to Backward Omnichannel presence to innovation Digital Public Infrastructure integration appeal to a wider audience • Product innovation is • Open Network for Digital • Startups like Lenskart, • Omnichannel presence has empowering brands to Commerce (ONDC) has FirstCry, Teabox, Miko & helped customers access & differentiate themselves, facilitated integration of PlayShifu integrated experience products meet evolving consumer small retailers into the backward to improve their seamlessly across needs , & stay competitive e-commerce landscape , margins, quality & for better channels in dynamic markets offering consumers a convenience • Nykaa, The Souled Store, variety of options • Atomberg Versa Drives • Lenskart is domestically Mamaearth , & several other have created a name in • India is witnessing high producing products for their D2C players have both BLDC* fans, a largely new global FinTech adoption in-house brands like John online & offline presence to market while multiple platforms like Jacobs & Vincent Chase to reach a wider audience DigiLocker, API Setu , etc. improve margins • Brands like Go Colors & The have surfaced to improve started by • Curefoods acquired brands accessibility to niche like Yumlane, Aligarh House government services market & identifying the & more to help enable them white spaces in the market to control their entire business operations from start to end 01 02 03 04 | 10 Product Innovation Digital Public Infrastructure Vertical Backward Integration Omnichannel ‘Product innovation’ is key to win & thrive in today’s competitive market landscape Creation of a new segment • Atomberg joined the market introducing BLDC fans • Versa Drives launched their BLDC coupled with AI technology technology-enabled fan segment • It captured a new segment, overtaking traditional Superfan in 2012 players, reducing electricity usage to 28W • Superfan offered equivalent airflow • Established itself as a segment leader with per-day to traditional fans lowering manufacturing capacity growing from 30 in 2016 to electricity usage from 75W to 35W 10,000 in 2022 Capturing a niche sub-segment • Baby Care market is unorganized and FirstCry wanted to be a convenient one-stop solution for anything related to baby care • Go Colors positioned itself as • They have a robust omnichannel presence across India to a high-quality & affordable capture the offline market with its ~2 Lakh+ SKUs & ~2000 bottom wear brand in an brands • To target the lower income strata , FirstCry launched • It has a market share of ~10% , products starting as low as , similar to the Gold with more than 3,000+ SKUs membership launched by Lenskart to attract lower income & 500+ stores across India consumers Addressing the growing demands of Indian youth • The Whole Truth entered a growing market for • The Indian affordable audio market was healthy food with a unique , minimally niche until boAt entered with a range of processed product budget-friendly products • They connected with the younger generation • boAt's marketing strategy was successful due by offering health-focused products & to its emphasis on social media & influencer educational content through digital marketing marketing to target younger audiences • The Whole Truth raised $15M in Series B funding • boAt leads the Indian TWS* market with 41.7% to capitalize on the rapid growth of the Indian market share energy bar market | 11 Product Innovation Digital Public Infrastructure Vertical Backward Integration Omnichannel Expanding ‘Digital Public Infrastructure’ will be influential in driving India’s digital consumption story forward India’s Digital Public Infrastructure (DPI) fueling growth in consumption India’s FinTech stack Open Network for Digital Commerce Others India has the highest global ONDC in India will help in Other initiatives taken has led to creation FinTech adoption rate (87%)* various forms: of new apps to solve for multiple reasons: with around 350M digital • The objectives of the ONDC are • API Setu: Provides access to govt payment users, estimated to interoperability, data services & data like UPI, Aadhaar, etc. reach 700M by 2030 empowerment, consumer choice • GeM: Facilitates online procurement & protection, innovation & fair ~7,800 FinTech start-ups and 23 of goods by various govt. competition FinTech unicorns departments • Increase digital consumption • DigiLocker: Stores important Impact on Indian society: • Push up the number of digital documents such as driving licenses Impact transacting consumers by 3-4 • Promoted financial • Diksha: Provides access to learning times inclusion by providing resources , teacher training modules access to financial services • According to ONDC CEO, ONDC • NDHM: Creates secure, seamless, expected to have 2 lakh daily • Digitized and changed the standards-based health data transactions by 2023 face of the banking industry platform Impact of ONDC: • Enabled the growth of SMEs Impact: and created more job • Freedom of choice to the • Improved accessibility to govt. opportunities customer with a variety of options services to buy from • Enabled growth of • Access to important information for e-commerce in India by • Create a fair game for all players the citizens providing secure & to co-exist & benefit mutually • Improved management, collection, & convenient payment • Encourage small retailers to step storage of govt data solutions foot into e-commerce Models | 12 Product Innovation Digital Public Infrastructure Vertical Backward Integration Omnichannel ‘Vertical Backward Integration’ has helped improve supply of goods & increased profit margins Impact / effectiveness of vertical backward Companies performing vertical integration on companies backward integration Vertical backward integration occurs when a business acquires a supplier of the goods or services required for manufacturing of its products which significantly Chiratae’s portfolio companies enhances profit margins Increased control • Complete control from obtaining raw materials to selling final products • Control over the quality of products & raw materials increases ability to save costs Reduced costs • Elimination of any profits across different stages of the value chain • Increased profitability from sale of finished goods • Elimination of markup fee Timely supply • Ensures adequate & timely supply of raw materials • More stable with fewer operational disruptions from primary inventory delays • Control over speed of conversion into final product Chiratae’s portfolio companies have 15+ manufacturing facilities that work with almost 300+ manufacturers to unlock margins | 13 Product Innovation Digital Public Infrastructure Vertical Backward Integration Omnichannel Brands are utilizing their 'Omnichannel' presence to connect with various segments of consumers & tap into the highly fragmented market Omnichannel approach “We realize e-commerce is the • Omnichannel retailing approach refers to transacting across multiple channels , future and most of our marketing which may include marketplaces, social channels, brick-and-mortar stores, and more spend goes for our online channels. • Brands have increasingly started creating their brand presence across multiple But to be considered a strong online & offline channels to ensure an integrated as well as cohesive customer brand, we need to have an experience omnichannel presence. When the • Focus on multi-channel approach to provide can help brands brand has an offline presence, deliver a consistent brand message: there is good brand visibility.” Own platform -Founder, leading BPC brand Marketplace Physical stores General Trade “Initially, many brands treated • General Trade encompasses local retailing through conventional e-commerce & brick-and-mortar channels like stores & markets , granting access to a wider consumer stores as two separate channels. But base they eventually realized that it was all • of the retail market is still serviced by the unorganized sector which overlapping. And, today, they must constitutes of mostly general trade work towards unifying the customer experience, product, & price across • Mamaearth, Beyond Snack, & Spice Story are expanding into the unorganized sector post-establishing significant online presence & channels. If they don’t, then they’ll lose customer acceptance out on their loyal customer base.” • Chiratae’s portfolio company FirstCry currently works with over 1.7M Senior VP Marketing, general trade outlets to increase access to baby care products leading fashion brand | 14 Value creation: Brands that created value through successful exits in recent years Company Founded Sector Sub-sector Exits Exit value (US$) Investment exit by Accel, Chiratae 2007 ConsumerTech E-commerce 2.5-3.5B Ventures and Tiger to Walmart 1 IPO of which 88% was investor exits 2012 ConsumerTech E-commerce ~565M Titan acquired the remaining 27% stake 2008 RetailTech Jewelry 555M from the founder 2 2010 ConsumerTech Eyewear 450M Secondary Acquired by Swedish gaming giant 2014 ConsumerTech 350M Gaming Modern Times Group (MTG) Marico acquired remaining 55% stake Men’s grooming 2015 BPC 45M from the founders Mothers and The Good Glamm Group acquired 90% 2016 BPC Undisclosed baby products stake from founders Jewelry 2019 RetailTech Undisclosed First cheque exit through secondary Grocery delivery 2011 ConsumerTech Undisclosed Majority stake acquired by Tata Digital | 15 Trends such as fast-growing FinTech market, increased OTT penetration & rise in EV sales have been influential in changing consumer behavior Fastest Women creating Consumer growing a mark in the inclination FinTech 2 ConsumerTech OTT revenue India expects towards ‘vocal markets space Social media to reach INR an increase for local’ driving a shift 30K Cr by 2030 in EV sales in food choices • India has an • In India, ~75% of • Indians have adoption rate of female mobile recently changed ~85% , far ahead gamers are their focus to • The number of • The market of the global active players • Social media domestically electric vehicle would grow at a average of ~65% • 45% of the top inspiring produced goods registrations in remarkable 20% in FinTech 1,000 social customers to India increased • Growth of the year-on-year 1 • MSMEs are media make healthier nearly thrice startup basis increasing the influencers are food decisions ecosystem • Reduction in EV • Expansion of use of FinTech women • Healthy greens through Ola subsidy to 15% smart TV sales & services currently Cabs, OYO, indicative of accessibility of accessible all Zomato, Paytm , rising demand & high-speed Illustrative companies Illustrative companies year round and & others willingness to pay broadband in right outside the higher price Tier 2 & 3 cities Illustrative companies door Illustrative companies Illustrative companies Illustrative companies 01 03 05 02 06 04 | 16 Social commerce & immersive shopping experiences are set to revolutionize the global consumer purchasing landscape US EUROPE APAC MENA • Social commerce market is • Europe's social • Social commerce market is • Social commerce to grow at expected to grow to ~US$ commerce market is expected to grow to US$ a CAGR of 55% , in the region 191B in 2025 expected to grow to 895B by 2028 , at a CAGR of from 2022-28 ~US$ 25B in 2023 ~10% • 36% of the US internet • Social commerce on users have made at least • >50% of the UK depends • Conversational commerce Instagram, Facebook & Social commerce one purchase from a social on social commerce to is predominantly influenced reshaping media platform buy fashion products by the dominance of engagement e-commerce WhatsApp & Messenger by • Anticipated to have Meta approximately ~110M social buyers by 2025 1 • ~70% shoppers expect • Retail XR market to grow • XR market to grow by 49% • Snap Inc. launched MENA’s first shopping to increase as at a CAGR of ~25% by between 2020-2026 with a AR-powered virtual mall in 2022 AR engagement is 2028 TAM of US$ 288B • AR-based retailer campaigns integrated into their • ~60% consumers • ~70% consumers saw 4.3 times higher average experience advocated for immersive advocated for immersive purchase value Immersive shopping • Retail stores reported technologies in online technologies in online • 70% consumers use AR for transforming ~90% conversion rates for retail retail shopping consumer behavior AR-based transactions • ~90% SMEs widely use XR 2 • Mobile gamers market to • Mobile gaming is popular • APAC with the highest daily • GenX lagging in the MENA -3 reach 182M users by 2027 among GenX with 25% of average mobile game play ~75% of the market in hyper casual (7.2 min.) currently dominated by players • ~75% of the gamers are 45 and social casino (21.4 below the age of 35 over the age of 18 min.) games category • 50% of Esports viewers in • ~75% of gamers in the region Mobile & organized • Rise in viewership of Europe are Millennials • APAC leading with 55% involved in Esports in some Esports, expected to reach competitive gaming followed by GenZ (~25%) views of competitive way (amateur/professional ~45M in 2023 on the rise gaming from the region tournaments) | 17 Case Study Lenskart has successfully implemented vertical backward integration & has built a unique omnichannel play to grow its business Offerings Key financials (FY23) Headquarters Founded Gurgaon, Internet’s first Revenue audited 2010 Haryana eyewear brand US$ 455M Evolution of Lenskart Value chain analysis Key highlights Vertical integration (backward) • Company was formed 2010 • Established own manufacturing facility for 6 • Sale of contact lenses & eyeglasses 5K+ eyewear frames & lenses Broad SKUs categories • Enabled greater control over quality & design • Chiratae Leads Series A of products, with timely delivery 2011 • Expanded portfolio & added sunglasses • Owns three private label brands , John Jacobs, in accessory category Vincent Chase, & AquaLens • Opened its first franchised 2014 Omnichannel play ~$830M 1.5K+ brick-and-mortar store; TPG leads Series C Total Total funding Online stores in primary • Offers virtual try-on feature • Closed its highest funding round till date • Allows customers to order products online & • Raised US$ 60M+ from investors 2016 pick them up from their nearest Lenskart store including Premji Invest • Offers ‘ Home Eye Check-up ’ service Offline • Expanded into Singapore and made its 225+ 15 early global footprint • Provides a large variety of frames & assistance Indian Countries 2019 • Earned the unicorn company status by by trained optometrists cities raising ~US$ 230M in Series G funding • Free eye tests at their outlets round led by SoftBank Product assortment • Completion of 1,000 stores • Offers a wide range of products , including • Acquisition of a major stake in the 2 2022 eyeglasses, sunglasses, contact lenses , & more 10M Japanese & SEA eyewear brand Owndays , Business Customers • Offers a diverse range of designs, styles, colors, & valued at US$ 400M acquisitions per quarter materials • Expanded beyond eyewear to offer customers • Company valued at $4.5B 2023 other products & services like eye check-up exams | 18 Case Study Nykaa's omnichannel presence has helped customers access products seamlessly across online & offline channels Nykaa has expanded beyond beauty & wellness to become a one-stop-shop for all lifestyle needs Tailwinds Headwinds Technical integrations • Multiple payment gateways providing a seamless • Quality maintenance from multiple • Increase in demand for beauty & experience vendors wellness products • Personalization techniques-tailored shopping • Operational challenges across inventory, • Omnichannel presence experience logistics, & delivery • Partnership with global brands • CRM system to manage its customer interactions • Limited control over customer (Estée Lauder, M.A.C) experience • Marketing automation tools to automate • Strong social media presence campaigns & reach outs • High competition from Flipkart & Amazon Consumer Awareness Interest Purchase viewpoints Step 1 Step 2 Step 3 Search online via websites Nykaa app Click & Collect Digital and the Nykaa app People become aware through Order products online & collect them from the nearest Nykaa store modes Attend online events TV, social media, & online ads Virtual Try-On Tryon products virtually before they make a purchase Step 1 Step 2 Step 3 Nykaa stores Nykaa luxe stores Free sampling, discounts, Physical Outdoor advertising such as Premium shopping experience with exclusive products & offers, customized modes poster, billboards, or flyers product range Nykaa beauty kiosks Range of travel-sized beauty products that customers can purchase on-the-go | 19 Agenda Decoding The Indian consumer Key Takeaways Growing digital adoption in India has led to increased smartphone usage, higher digital spending, & shift from offline to online in recent times Key Takeaways • India's lower-income & Tier 2/3 cities are rapidly Smartphone usage FinTech Gaming adopting digital technology and are aware of the various platforms / apps ~4hrs ~90% ~45% • Wide usage of FinTech Is the average time spent by FinTech users use payment apps, Consumers play games on platforms, driven by payment users on smartphones‘ other facilitating financial inclusion & smartphones out of which 7% are apps even in remote cities than social media apps’ digital payments adoption professional gamers • Growing willingness to pay for premium & personalized subscription models • Online gaming growing with rising professional gamers • Changing preference from Online shopping offline to online across Subscription apparel, BPC, & grocery shopping ~70% ~50% • Trends reflect transformative impact of digital adoption Subscribed to entertainment Consumers prefer shopping platforms, with Disney+ Hotstar & online for apparel, beauty, & across cities Amazon Prime driving personal care as well as grocery subscriptions | 21 Demographic Insights collected from interviews conducted on Indian consumers (N=1,843) across the country Gender Age (Years) Annual income (INR LPA) 15% <3 22% 25% 3-6 22% 56% 44% 27% 20% 26% 7-12 9% 19% 13-18 <18 19-25 26-30 31-40 >40 15% >18 Location Occupation 25% 26% Tier 2 Metro Working Professional/ 27% Private employee 21% Student 24% 26% Self-employed/ 18% Business owner Tier 1 Tier 3 15% Homemaker | 22 Time Spent Usage & Preference Consumer spends On average, consumers spend more than 4 hours every day on their smartphones; Almost 2 hours on average are spent daily on entertainment platforms Average time spent daily Entertainment Gaming Finance ~4*hours spent on average on ~2hr ~1hr ~0.4hr smartphones daily Health On-demand services Travel ~0.3hr ~0.3hr ~0.2hr 6 in 10 digital consumers reported a significant rise in time spent on various finance “In terms of time spent on gaming , consumers in Tier 2 and beyond cities surpass those in Metro cities” platforms in the last 12 months | 23 Time spent Usage & Preference Consumer spends >75% consumers use finance apps, while entertainment platforms are the most preferred platforms by consumers Finance Entertainment On-demand Gaming Travel Health services % Consumers using the category / platform 77% 70% 53% 43% 13% 10% 26% 58% 14% 22% 1% 3% Most preferred category / platform (%) I enjoy spending my leisure time binge-watching “Zomato alone saw 647M orders, a YOY shows on Netflix and Amazon Prime. I feel a growth of 21% in the year 2022-23 ” major chunk of my screen time goes into this. | 24 Time spent Usage & Preference Consumer spends Consumers today consider on-demand services (~70%) & entertainment (~35%) as part of their essential expenses in their daily lives Essential expenses Discretionary expenses Categories On-demand services Essential Entertainment Travel Gaming Discretionary 0% 20% 40% 60% 80% 100% My day is not complete if I do not watch an episode of a show I’m For me, on demand service platforms comprise as an essential following on any OTT platform be it Netflix, Amazon Prime, or Hotstar. spend. Since I’m a bachelor and fresh out of college, a majority of my Since different platforms offer a different variety of content, I take up meals are ordered through Zomato or Swiggy. Besides this, I use annual subscriptions of almost all platforms out there. apps such as Uber, & Ola for commuting. | 25 Time spent Usage & Preference Consumer spends Indian consumers spend ~3.5K monthly on finance platforms; 60% have seen an increase in their FinTech spends over the last 12 months Finance Travel On-demand Health Entertainment Gaming services Average spend by smartphone ~3.5K ~1K ~0.8K ~0.8K ~0.4K ~0.1K users on apps 7% (INR) 8% 3% 10% 14% 17% Change in 33% 37% 49% spending over 54% 58% the last 12 58% months* 60% 60% 43% 37% 27% 25% Increased Remained the same Decreased I had developed an interest in the stock market during the pandemic and since then I have been actively investing in stocks. I have bought “India’s middle-class income households currently hold 31% of paid memberships of stock trackers such as Tickertape & India’s population, and is expected to reach 40% by 2031 ” Moneycontrol for my analysis. | 26 Awareness Subscription Preference Increased awareness of various services / platforms among consumers across Tiers due to increased digital adoption in recent years Awareness of platforms (%) Metro Tier 1 Rest of India Metro Tier 1 Rest of India Social media & 90% 10% 92% 90% 87% Entertainment E-commerce 85% 15% 93% 85% 80% platforms On-demand 81% 19% 88% 80% 78% services Online 75% 25% 86% 79% 68% grocery 68% 32% 79% 68% 62% personal care “The number of online shoppers in India, which stood at 180-190 “Online consumers prefer shoes and sarees as a category, million in 2021 , is projected to witness a substantial growth, while they prefer black as a colour” reaching 400-450 million users by 2027 ” Low High Yes No | 27 Awareness Subscription Preference Growing willingness to pay for premium & personalized subscriptions, especially for entertainment (~70%) & e-commerce (~50%) platforms On-demand Online Entertainment E-Commerce services grocery 71% 49% 42% 36% 7 in 10 digital consumers have subscriptions for Beauty & Fitness Social media Travel the entertainment personal care platforms/apps they use 30% 24% 22% 20% “India is going to see 25% I have subscriptions to Netflix, Amazon Prime, and Disney+ Hotstar I have a subscription for Amazon Prime. I bought it because it was growth in consumption over because I'm an avid consumer of TV shows and movies, and each offering me a lot of services with just one subscription such as the next eight years due to platform provides a diverse range of content. movies, tv shows, music as well as one day free delivery. premiumization” | 28 Awareness Subscription Preference Preference for online purchase of clothing & fashion is higher outside Metro cities due to unavailability of desired products in offline stores City-wise % usage of platforms/categories online Key findings N= 397 397 736 • Clothing & fashion 68% 62% 61% estimated to grow at a CAGR of ~20% till 2026 • Social commerce is driving shift from offline to online; Expected to Groceries & grow at a CAGR of ~35% from 60% food items 55% 52% 2023-2030 • ~70% users are shopping for clothes & fashion online in Tier 2 & 3 cities Beauty & • Rising awareness and lack of personal care 50% 50% 45% availability of products/offline stores are major factors behind the shift to online • Natural & organic BPC comprises ~40% of the total BPC market Electronics & appliances which allows the overall market to 32% 30% 29% grow at 1.5x due to rising consumer awareness Metro Tier 1 Rest of India | 29 Trends Spends Among the non-smartphone users, online platforms are still not prevalent and the adoption of UPI & credit cards is also low Shopping Offline Low credit card preference payment adoption 86% 96% 35% Consumers prefer shopping Consumers use cash as a Consumers prefer from local stores with no primary mode of payment borrowing from local money usage of e-commerce with UPI picking pace lenders, while 53% prefer borrowing from banks Offline Spending Entertainment banking behavior 99% 40% 55% Consumers prefer offline Consumers view Consumers’ spending has Non-smartphone user banking, with internet entertainment as increased in the last 12 preferences & traits banking gaining traction a discretionary expenditure months for all categories | 30 Trends Spends For non-smartphone users, food & grocery along with education saw highest increase in overall monthly spends Food & Education Housing Finance Transportation Apparel & grocery (Rent) clothing Average monthly spend of non- ~4.5K ~2.5K ~2K ~1.5K ~1.5K ~1K smartphone users (INR) 1% 4% 3% 2% 21% 18% 30% % peoples’ 26% 45% 42% money spent changed in last 12 months 81% 78% 70% 72% 54% 52% Increased Remained the same Decreased I am a bachelor and I live on rent in Mumbai with a monthly salary of I am a house help by occupation living in Delhi. I don’t have a Rs 35,000. My major expense is rent and grocery as I end up paying smartphone, but I own a normal mobile which I use for calls. I earn a rent of Rs 15,000 and Rs 7,000 on food and grocery. Besides this, I also salary of 15,000 from which I pay a rent of Rs 7,000 and the rest is have a major spend on cabs and autos. spent on household expenses. | 31 Trends Gaming Spends E-commerce Fintech Entertainment Healthcare Entertainment & FinTech are driving growth among digital consumers in India; Gaming & entertainment are also gaining traction Gaming FinTech E-commerce 60% 91% 85% Online gamers comprise of FinTech platform users use Consumers are aware of women, with puzzle games payment applications for being the women their day-to-day dominated genre transactions Healthcare Entertainment FinTech expected to 86% 50% dominate India’s digital Entertainment consumers online use Online consumers use health tech consumer economy video-based content platforms platforms for doctor consultation such as YouTube, MX player in metro cities | 32 Trends Gaming E-commerce Fintech Entertainment Healthcare Online & professional gaming is on the rise in India with increasing number of active female gamers While gaming is on the rise in India, consumers still do not view it as a necessary expense and prefer free-to-use features Gamers • Spend on gaming has increased for younger 100% age groups (less than 30 years) Online gamers “In-app purchases in • Increase in online gamers with increase in income* online games were made 64% • ~60% females play online but not professionally, while by 110M people in India” ~35% females do not prefer to play online Streamers “ Tier 2 & 3 cities • High streaming & spends on gaming apps in Tier 1 & comprised 40-60% of 16% gaming population in beyond India” • Gamers between the age of 26-40 years stream games the most Professional gamers 7% • ~25% males who prefer online gaming apps prefer to play professionally and in competitions | 33 Trends Gaming E-commerce Fintech Entertainment Healthcare Action gaming is the most enjoyed genre, especially in smaller Indian cities; Puzzle, online sports, & fantasy sports are mostly played in Metro cities City-wise % usage of gaming platforms Key findings N= 60 36 57 • Number of paying gamers in Action India will grow at a CAGR of 46% 47% 43% 25% between 2022-2027 • The share of games downloaded by Indians in FY22 Puzzle went up to 17% of global downloads 32% 27% 20% • Action gaming is surging in India due to games like Battleground Royale Online sports becoming mainstream post-pandemic, especially in 27% 24% smaller towns/cities 19% • Fantasy sports are more prevalent in Metro cities due to Fantasy more significant disposable income & awareness among 27% 24% 18% consumers • Online sports are mostly played in Metro & Tier 1 cities Metro Tier 1 Rest of India | 34 Trends Gaming E-commerce Fintech Entertainment Healthcare Consumers prefer buying apparel & groceries more via online channels; Discounts & offers are the primary reasons for using online channels Primary reasons to purchase online Online / offline preference of customers Clothing & 65% 35% fashion Groceries & 55% 45% food items Discount Easy return & More Beauty & & offers exchange options 49% 51% personal care Electronics & 30% 70% 53% 36% 34% appliances Health & 20% 80% wellness* Home & 11% 89% furniture Convenience Economic I prefer to buy 80% apparel, beauty and personal care products online. This is pricing because online platforms offer the best price, high trust factor, quick return and refund, and good variety. 27% 25% Yes No | 35 Trends Gaming E-commerce Fintech Entertainment Healthcare Payments are driving FinTech adoption in India; Good security features & user-friendly UI are the reasons for increased usage Top reasons for selecting a FinTech platform FinTech platforms used by users (%) 91% 27% 15% 2% Payment Investment Insurance Crypto trading Security Easy user Offers, discounts 5.2k features interface & cashbacks Payment apps 0.9k Stock trading 53% 50% 48% 0.9k Mutual funds Average monthly spends 0.8k on FinTech Insurance platforms Minimal Customer 0.4k documentation support Crypto trading 21% 20% “The digital payment market in India is expected to expand from $3T in 2022 to $10T by 2026 ” | 36 Trends Gaming E-commerce Fintech Entertainment Healthcare Video-based content is the most consumed content, followed by music and OTT content % User consumption of different content platforms Entertainment & media industry in India expected to grow at a CAGR of 8.8% 86% 83% 80% OTT Video-based Music platform content 58% 50% 24% Live Short video Text-based streaming platform content “With 80 million content creators, India's internet economy anticipates influencer marketing expenditures to exceed $3 billion by 2030” | 37 Trends Gaming E-commerce Fintech Entertainment Healthcare City-wise % usage of health platforms 8 in 10 digital consumers prefer to order their N= 60 36 57 medicines through online Online pharmacy 87% pharmacies 78% 60% Doctor consultation 50% 33% 25% Fitness platform Fitness & 20% 25% 28% nutrition platforms thrive In Tier 1 and the rest of India, due to the Diet / Nutrition absence of good quality 18% 23% fitness centers , 26% unlike Metro cities which are equipped with best-in-class fitness centers Metro Tier 1 Rest of India | 38 Chiratae Ventures – ConsumerTech sector portfolio map Pillars of success Digital Public Omnichannel Globalization Product innovation Vertical integration Infrastructure (UPI) ConsumerTech Brands Marketplaces HealthTech FinTech Distribution Gaming EdTech Re-commerce Travel / Mobility Media Others | 39 The team at appreciates your time and support THANK YOU