
Overview
The INR 100 Question
Indians are saving more than ever but the household rupee is quietly being redistributed across the financial system. A look at what the shift in savings behavior means for banks, insurers, NBFCs and the wider BFSI landscape.
The headlines read like a warning: bank CASA under pressure, deposits trailing credit. But the deposit story is really a symptom of something larger and more interesting. Indians have not stopped saving. Net household financial savings actually rose to 7% of gross national disposable income in FY25, up from 5.8% a year earlier. What has changed is where the money goes. The same household rupee is being redistributed across the financial system, and the savings account is simply where that redistribution shows up first. The pattern touches every part of BFSI: banks, insurers, NBFCs and asset managers alike.
Where INR 100 now goes
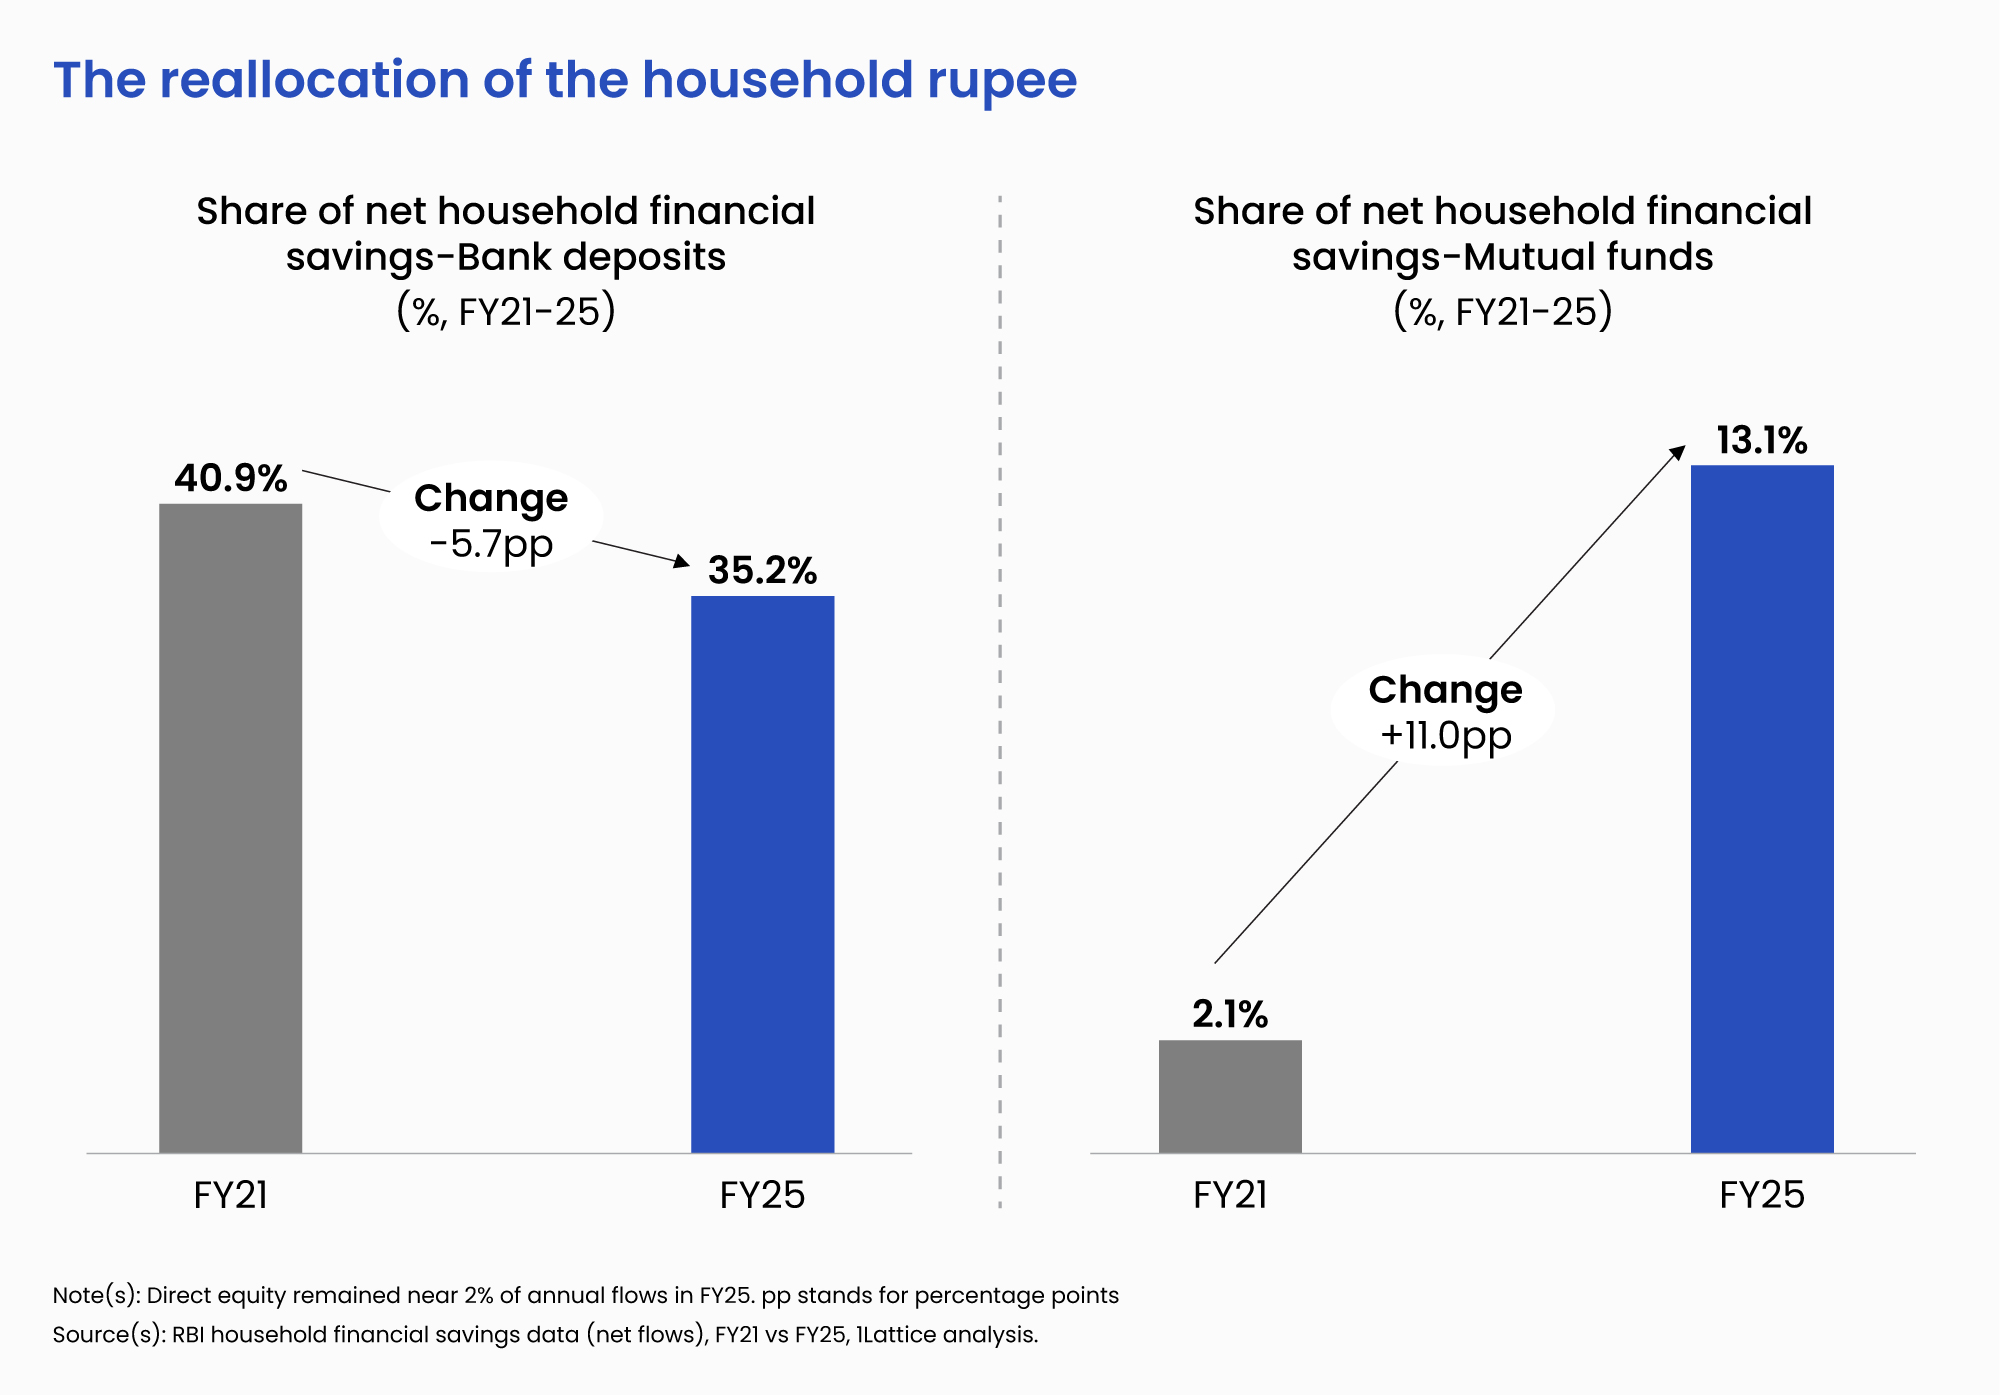
RBI’s household financial-savings data lays it out cleanly. Bank deposits remain the single largest destination for household money, but their share of net financial savings has slipped from 40.9% in FY21 to 35.2% in FY25. Over the same four years, mutual funds’ share climbed from 2.1% to 13.1%, a six-fold rise, driven almost entirely by systematic investment plans. For a broader view of the structural growth of mutual funds in India, explore 1Lattice’s Smart Money Moves: The Mutual Fund Growth Wave in India report. Direct equity, by contrast, is still only about 2% of annual flows: households are taking market exposure, but overwhelmingly through the automated, disciplined route of the SIP.
The momentum is easy to miss quarter to quarter but hard to ignore over time. Monthly SIP contributions have grown from under INR 4K Cr in FY17 to above INR 31K Cr in early 2026, and industry mutual-fund assets now stand at roughly INR 80 L Cr. One figure captures the reallocation: for every INR 100 households placed in bank deposits in FY25, they directed about INR 45 into mutual funds and equities, close to double the INR 21 of a year earlier.
What the shift means for banks, insurers, NBFCs, and asset managers
Because it is the same rupee moving, the shift looks different depending on where in BFSI one sits:
- Banks: The low-cost float is thinning. The share of current and savings balances in total deposits has fallen from around 45% in FY22 to about 38% by late 2025, nudging funding costs up as banks lean on costlier term deposits
- Insurers: Life insurers are competing for the same financialized rupee savings-linked and unit-linked plans now sitting alongside SIPs in the household’s mental ledger. New-business premium reached INR 3.97 L Cr in FY25 (up ~5% year on year), though growth cooled after the revised surrender-value norms, and life-insurance penetration eased to 2.7% of GDP.
- NBFCs and deposit-takers: They contest the same retail wallet, and as bank funding tightens, their own cost of funds is pressured in turn
- Asset managers and wealth platforms: The visible beneficiaries of the reallocation and, increasingly, the reference point households measure every other product against
The common thread: role, not rate
The instinctive response, across products, is to compete on price. Yet the shift is not primarily about rate. What has changed is the role the household assigns to each product. The savings account has moved from a store of value to a transaction rail; a traditional savings policy is now weighed against a market-linked alternative; a fixed deposit is measured against a SIP. Households are not rejecting any single institution so much as spreading the rupee and automating where it lands. For every BFSI player, that turns the contest from price into relevance, whether an institution stays central to the household’s financial life or becomes one node that others route around.
A lens for reading the household
One useful way to make sense of the shift is to look at how differently households behave, rather than treating “savers” as a single group. The same behavioral patterns tend to recur across banking, insurance and lending relationships:
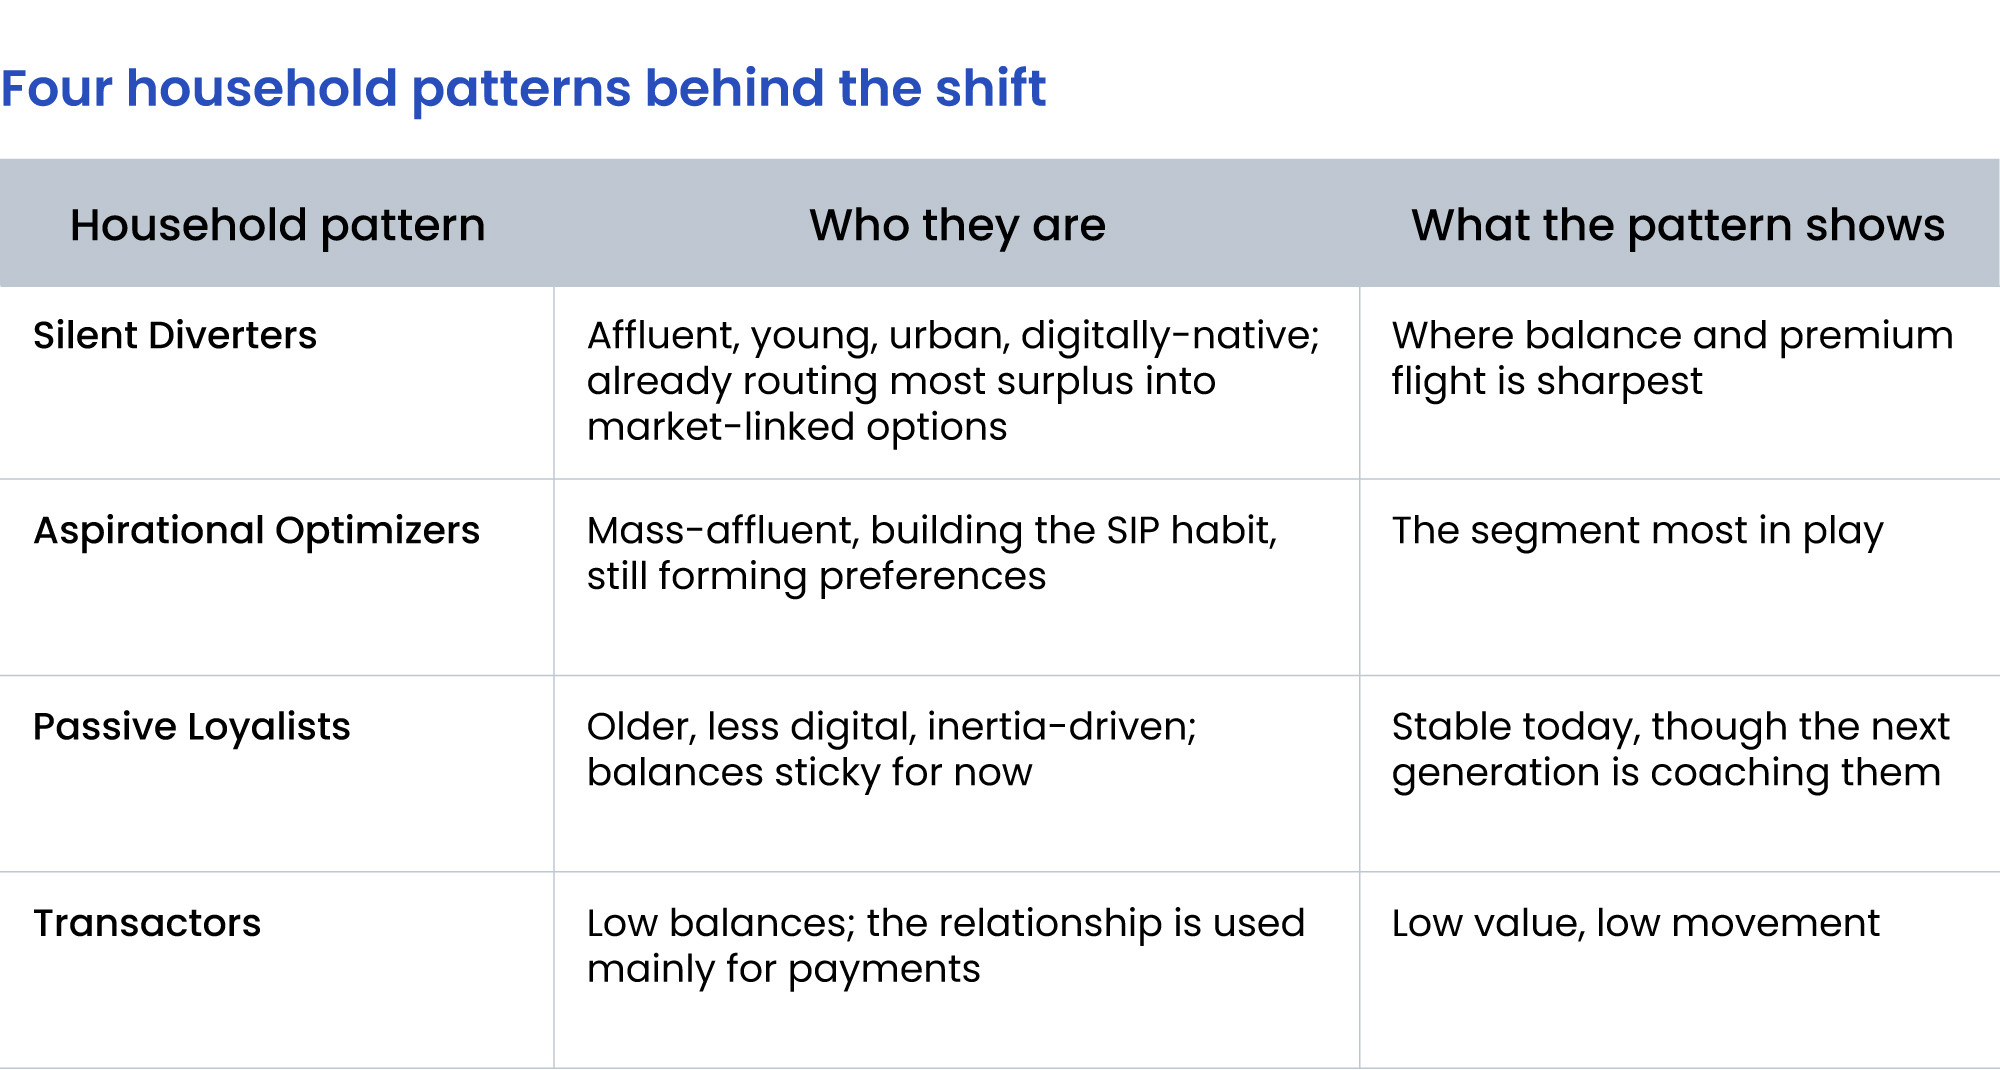
The value of the lens is the reminder that a single message aimed at an “average” customer speaks to none of these groups; the behavior, and what would move it differ by cohort.
The questions the sector is working through
Across BFSI, marketing and insight teams are converging on a similar set of questions: which cohorts are diverting savings, and at what life stage or balance level it begins; what actually triggers the move a life event, a peer, an app nudge, or a threshold being crossed; and whether cross selling a group’s own wealth or investment arm deepens the relationship or gradually points customers elsewhere. These are consumer questions, and internal data seldom answers them on its own. It records what balances did, not why.
How does 1Lattice look at the shift
At 1Lattice, we track this shift through 1Sense, combining primary consumer research across BFSI segmentation and driver studies that separate the cohorts, switching- and trigger-analysis that explains the movement, and brand-and-primacy tracking that shows whether a relationship is deepening or being routed around. The cohort lens above is a framing device; the useful version is built from the field, on a specific customer base.
The bottom line
The financialization of Indian savings is structural and unlikely to reverse. Households increasingly using SIPs today could represent an important future opportunity for deposit and premium franchises. Across BFSI, the advantage is quietly shifting toward institutions that understand, cohort by cohort, why the money moves, and stay relevant to the household’s financial life rather than competing hardest on price.