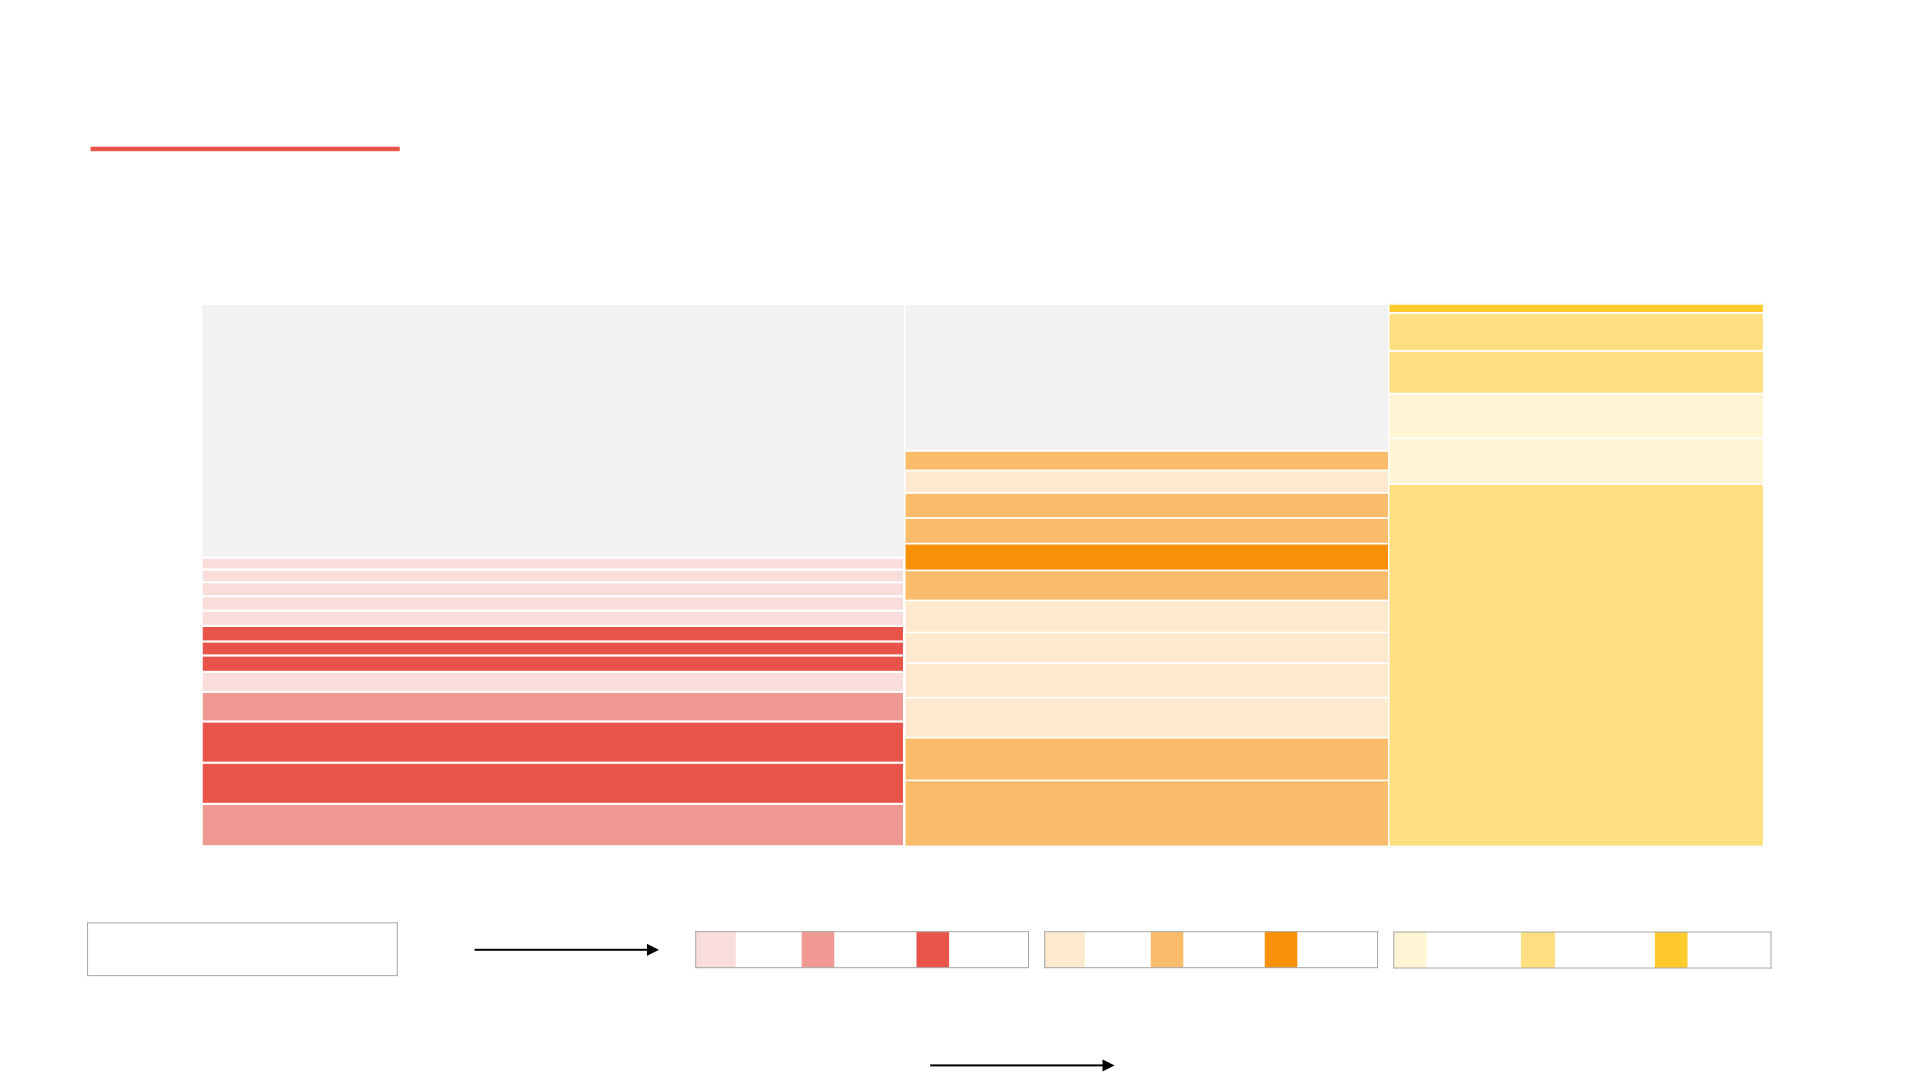
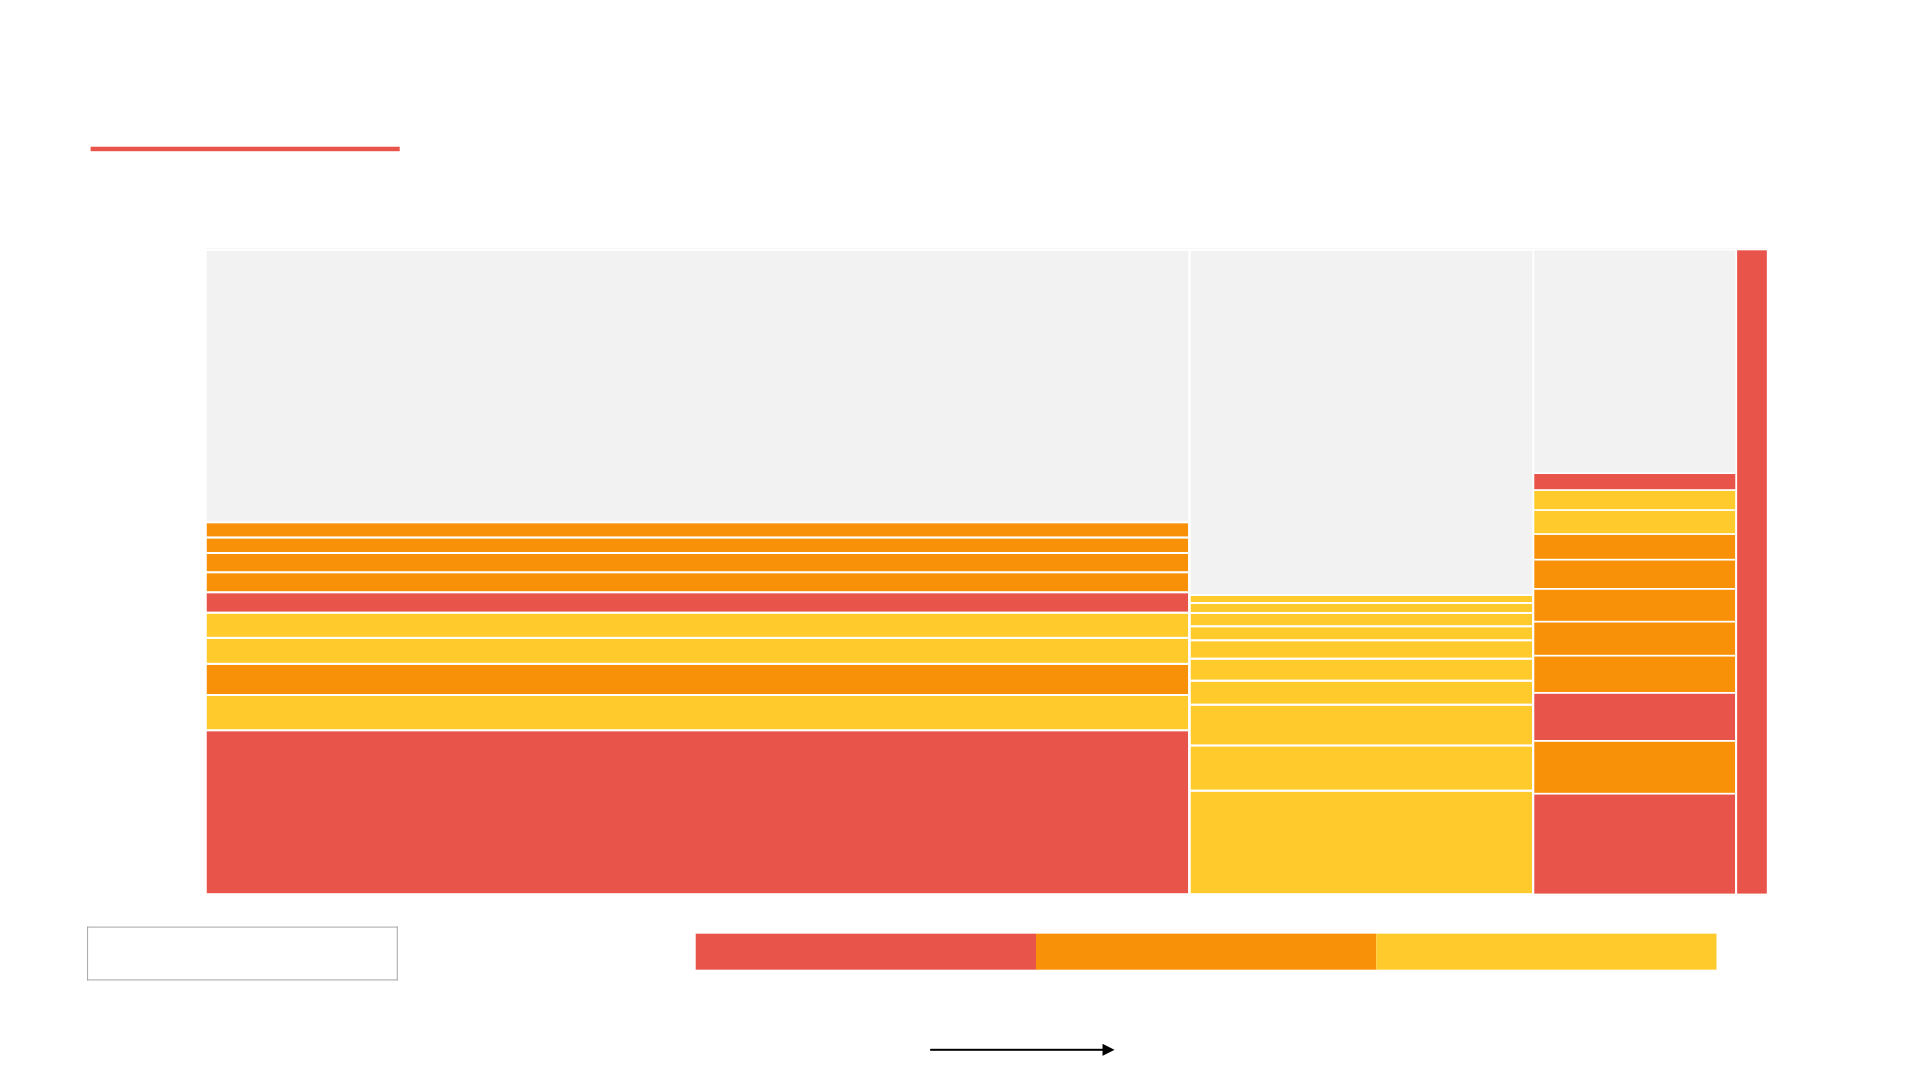
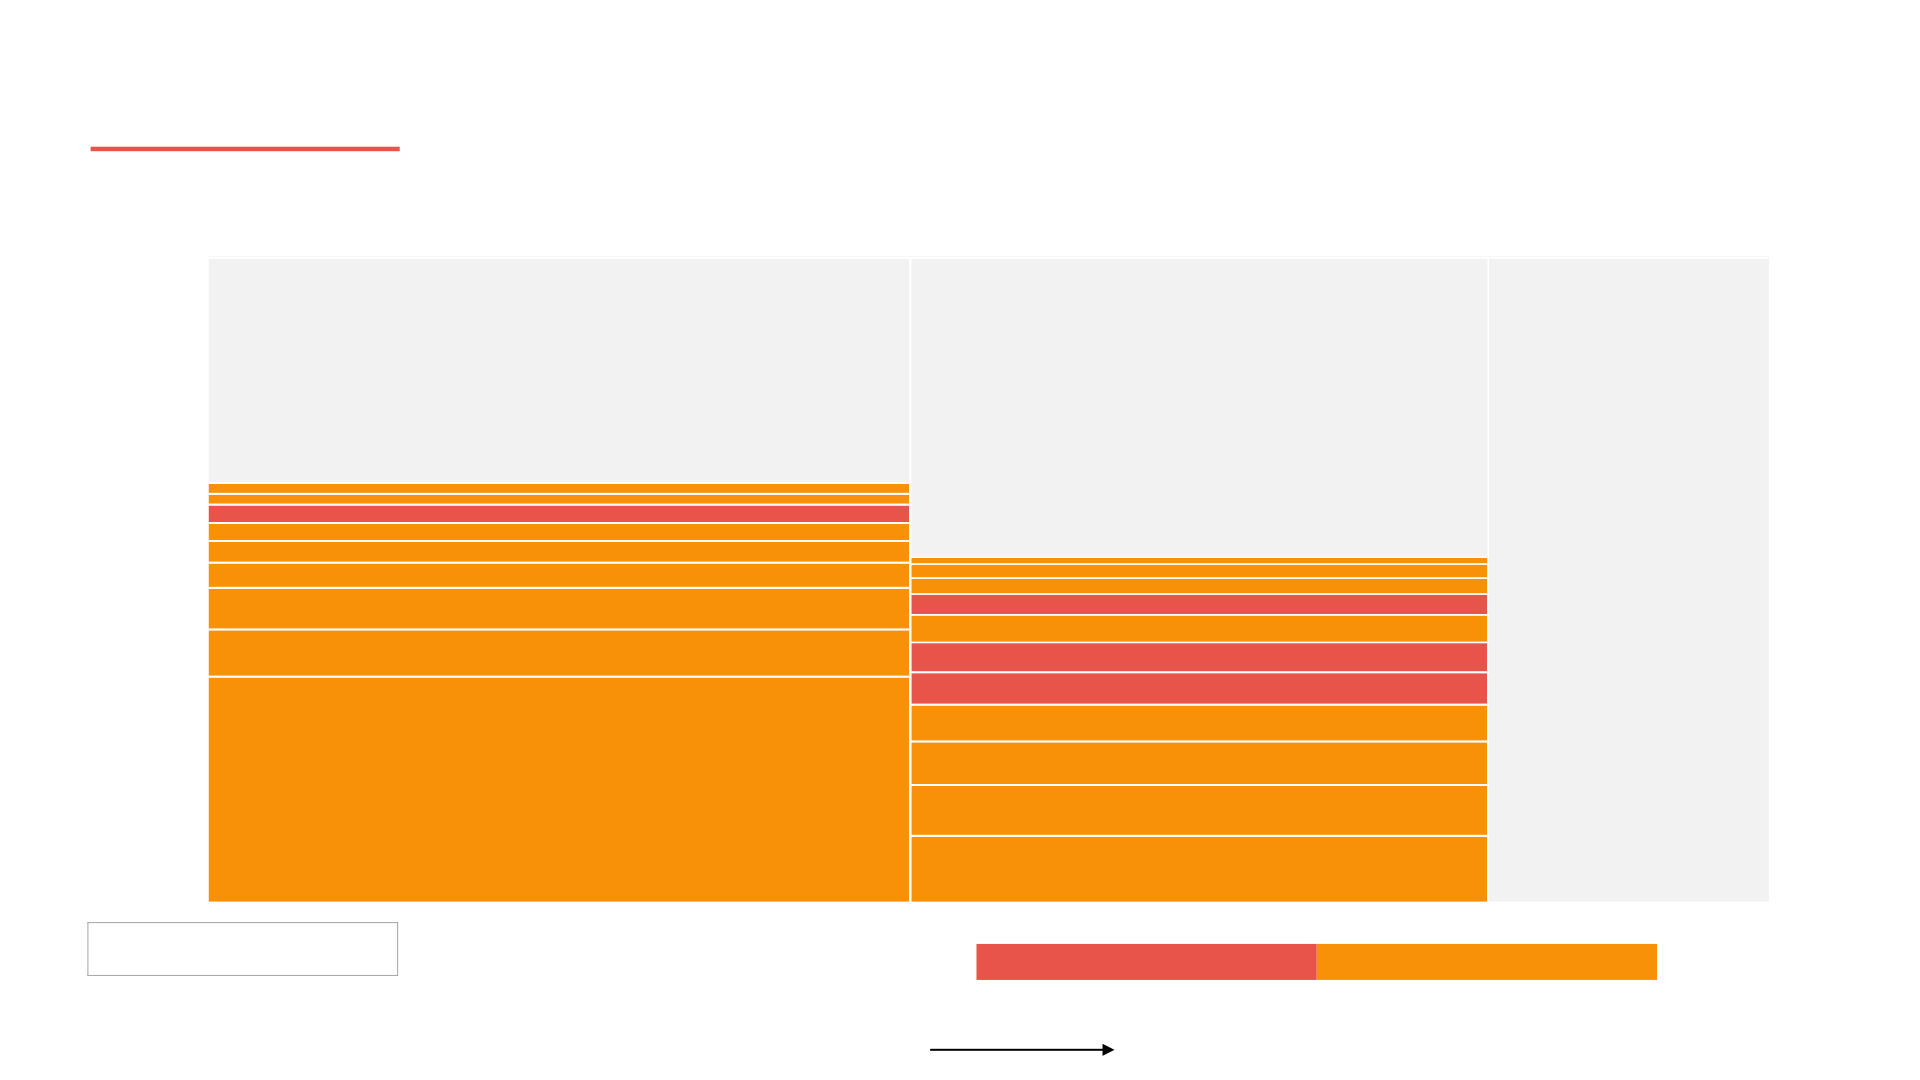
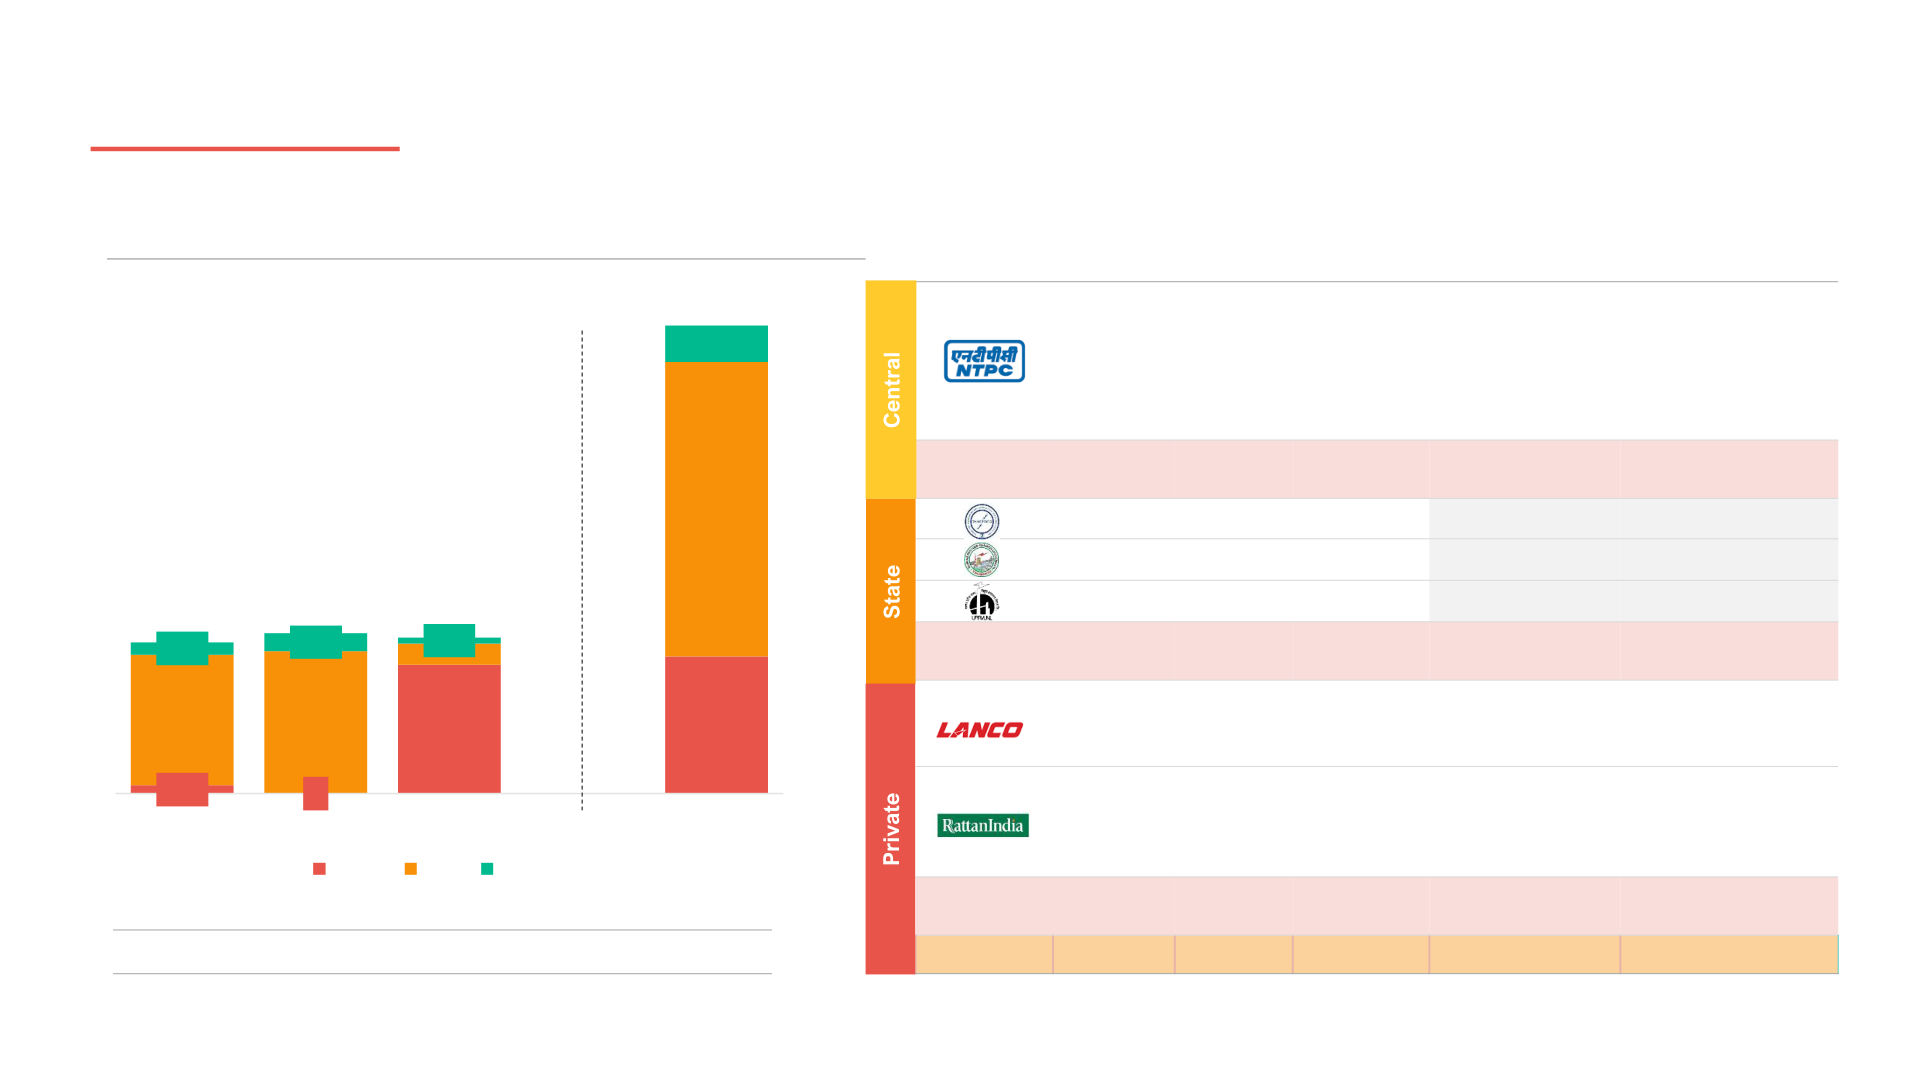
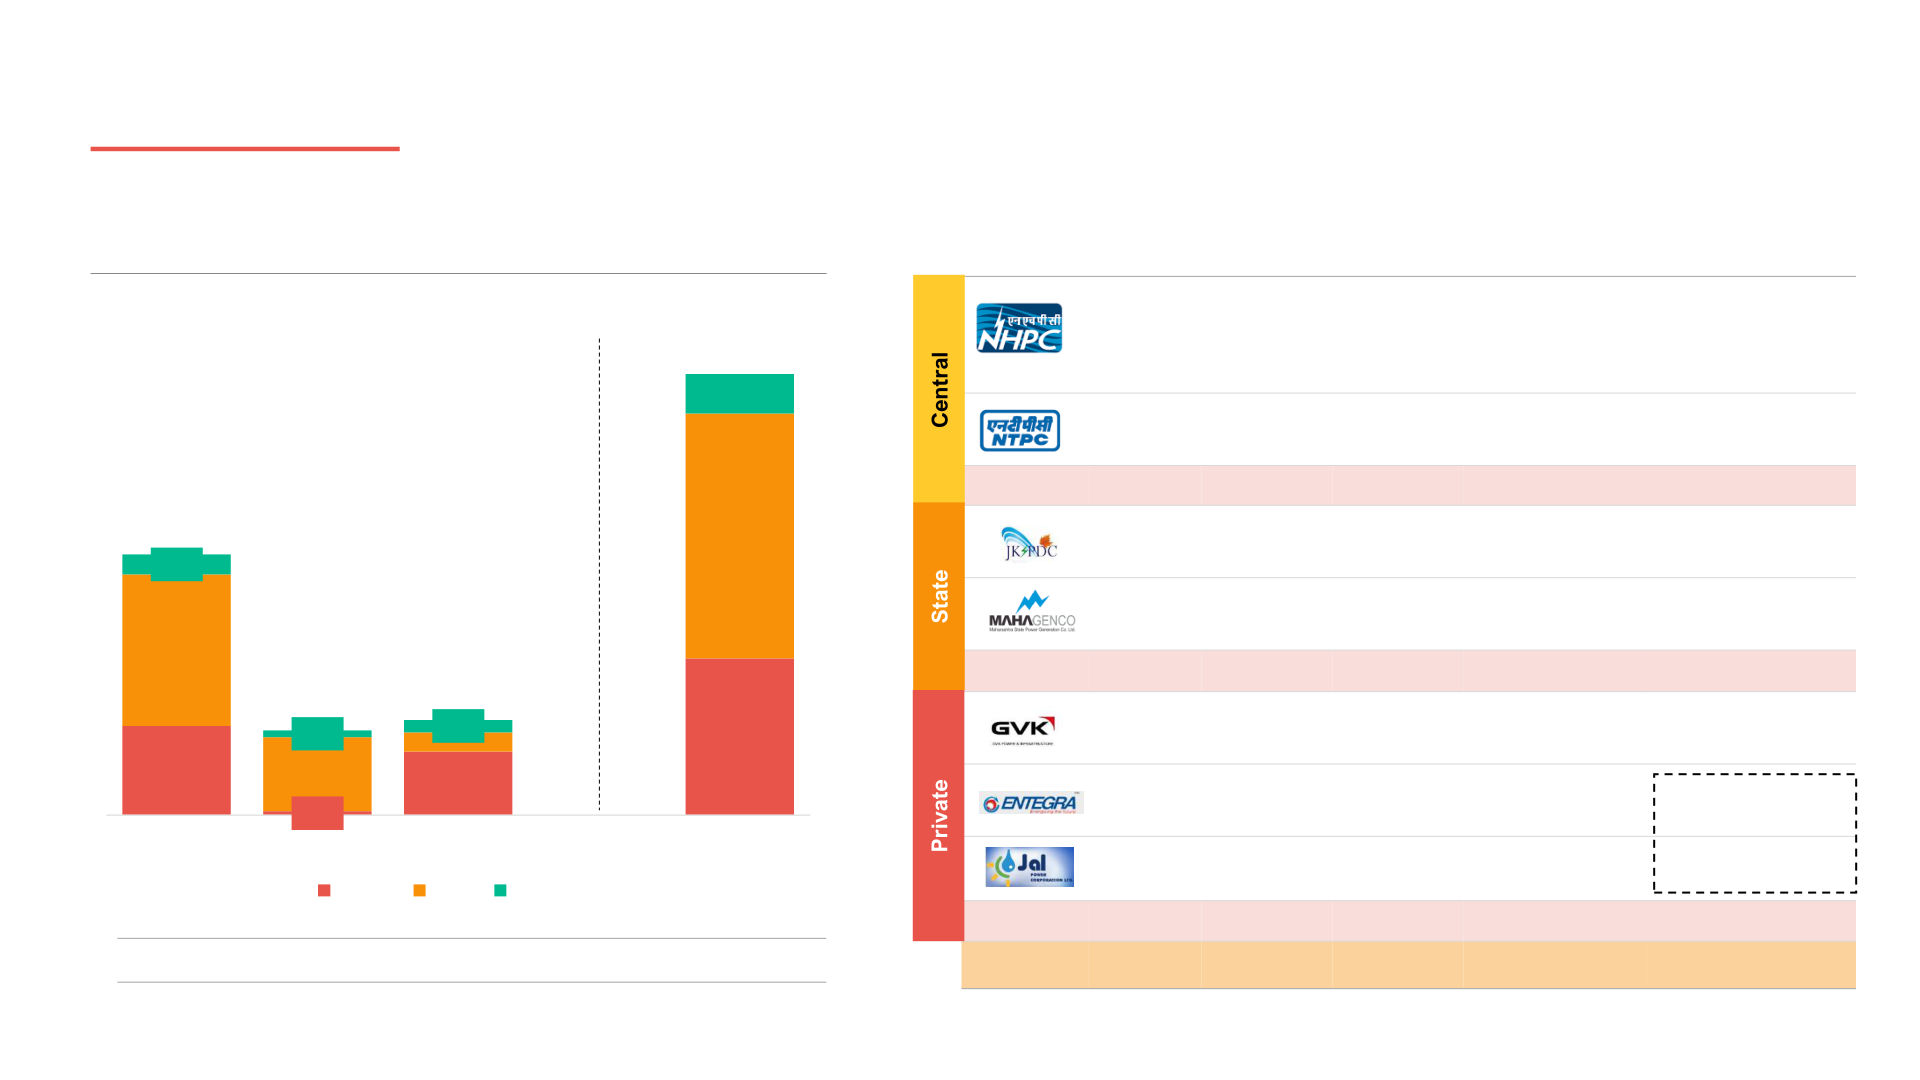
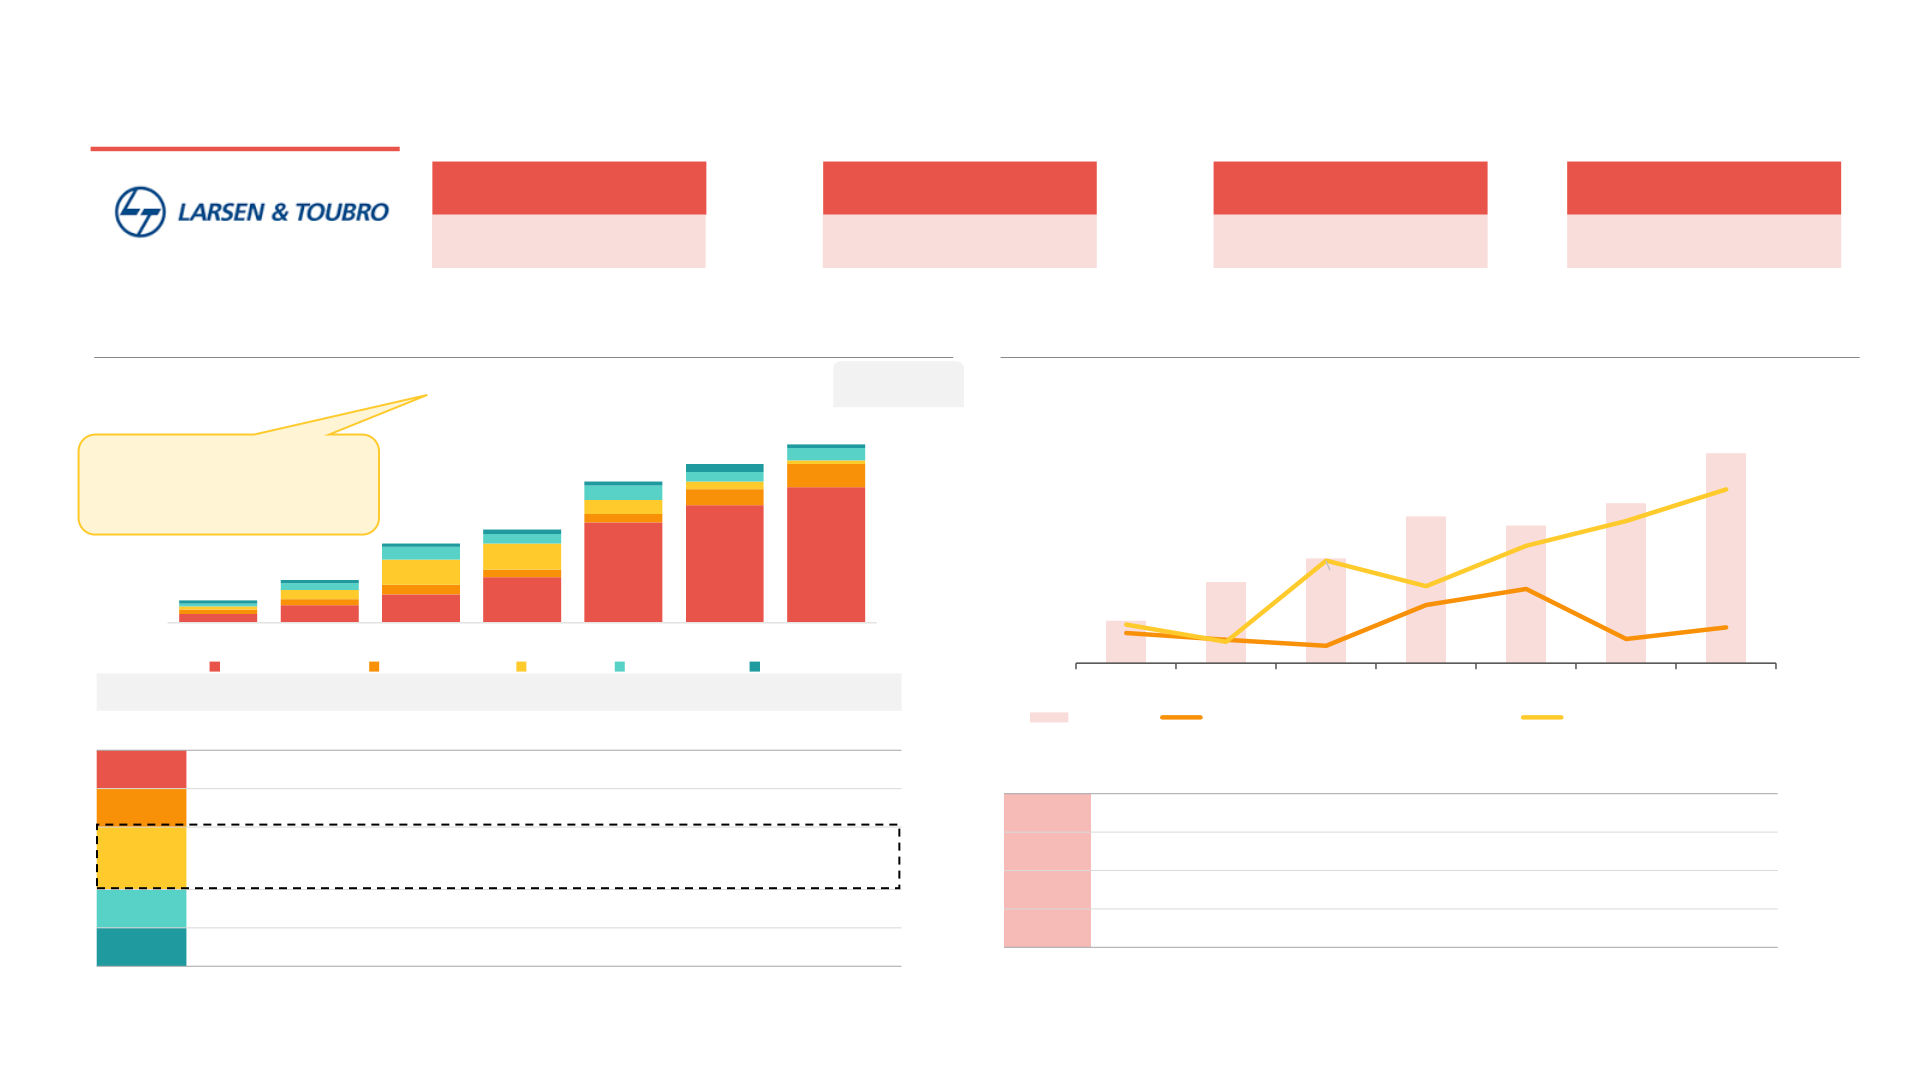
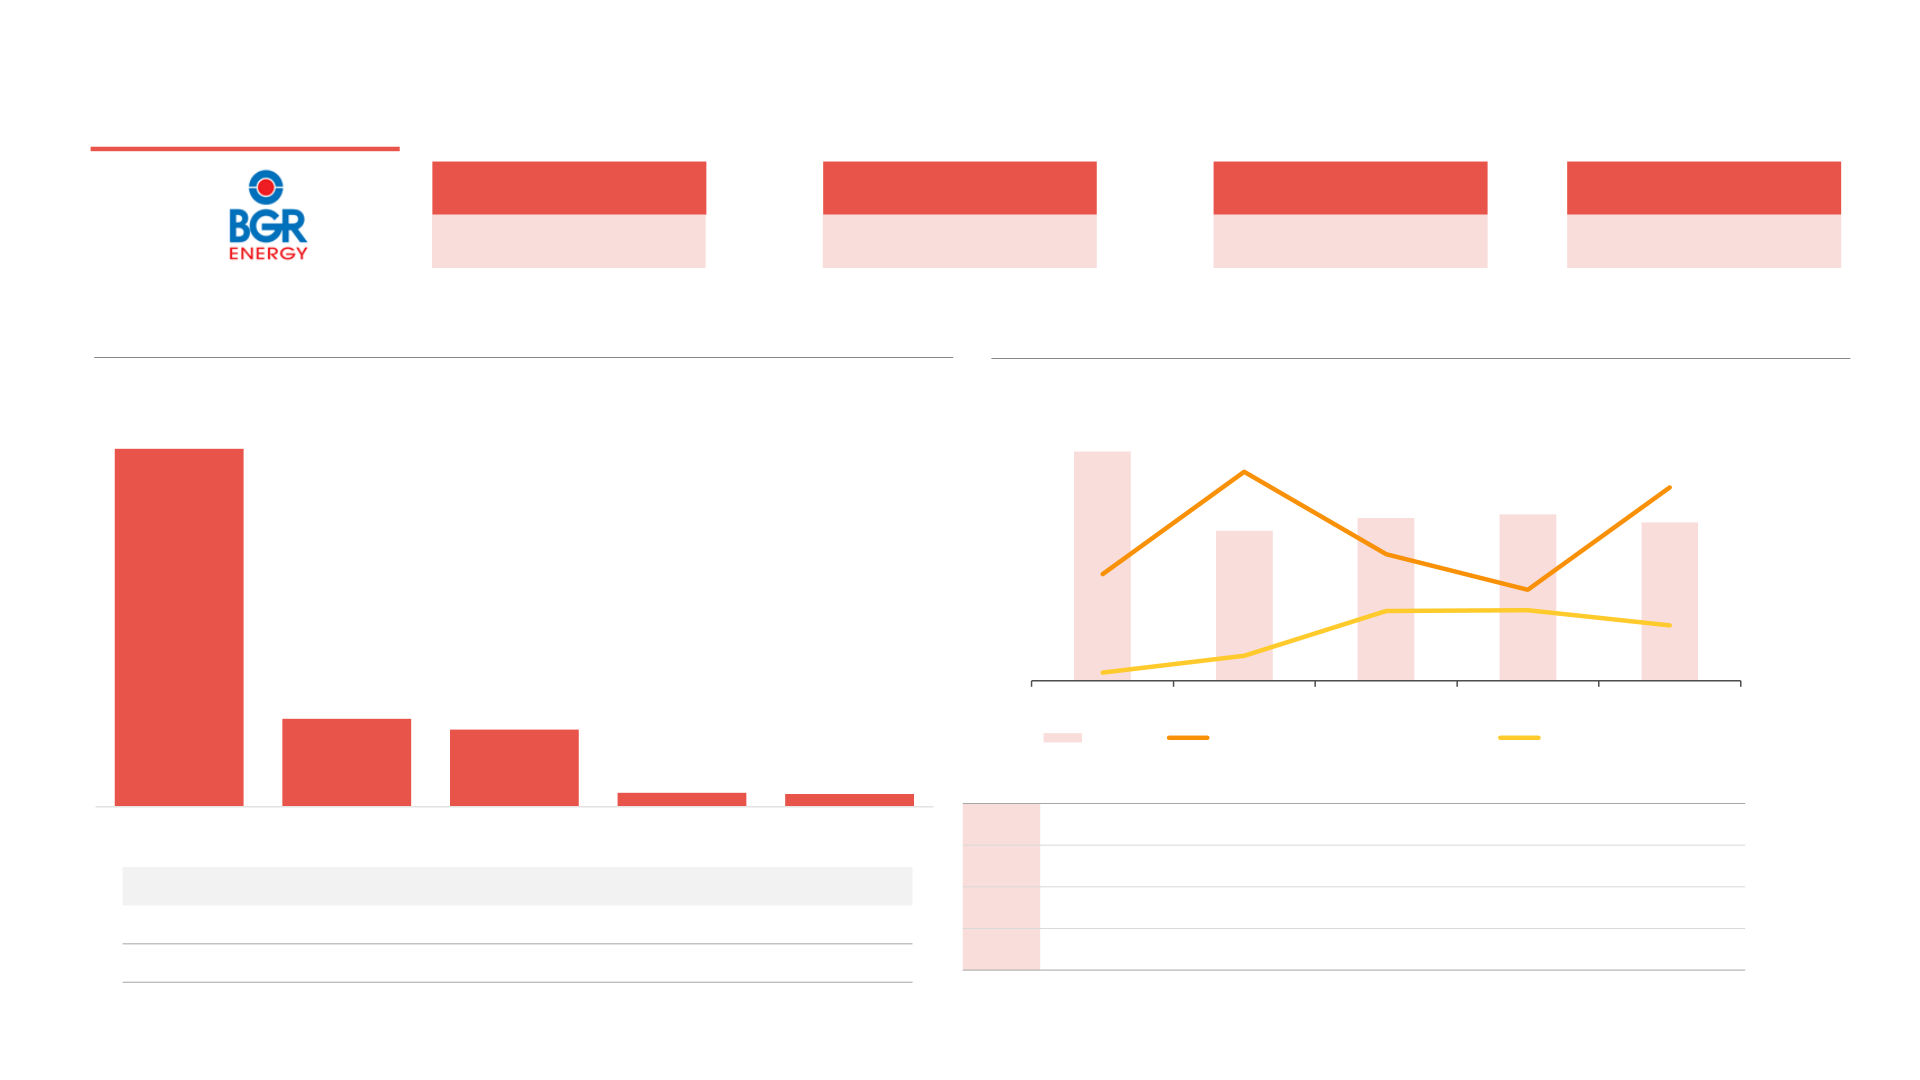
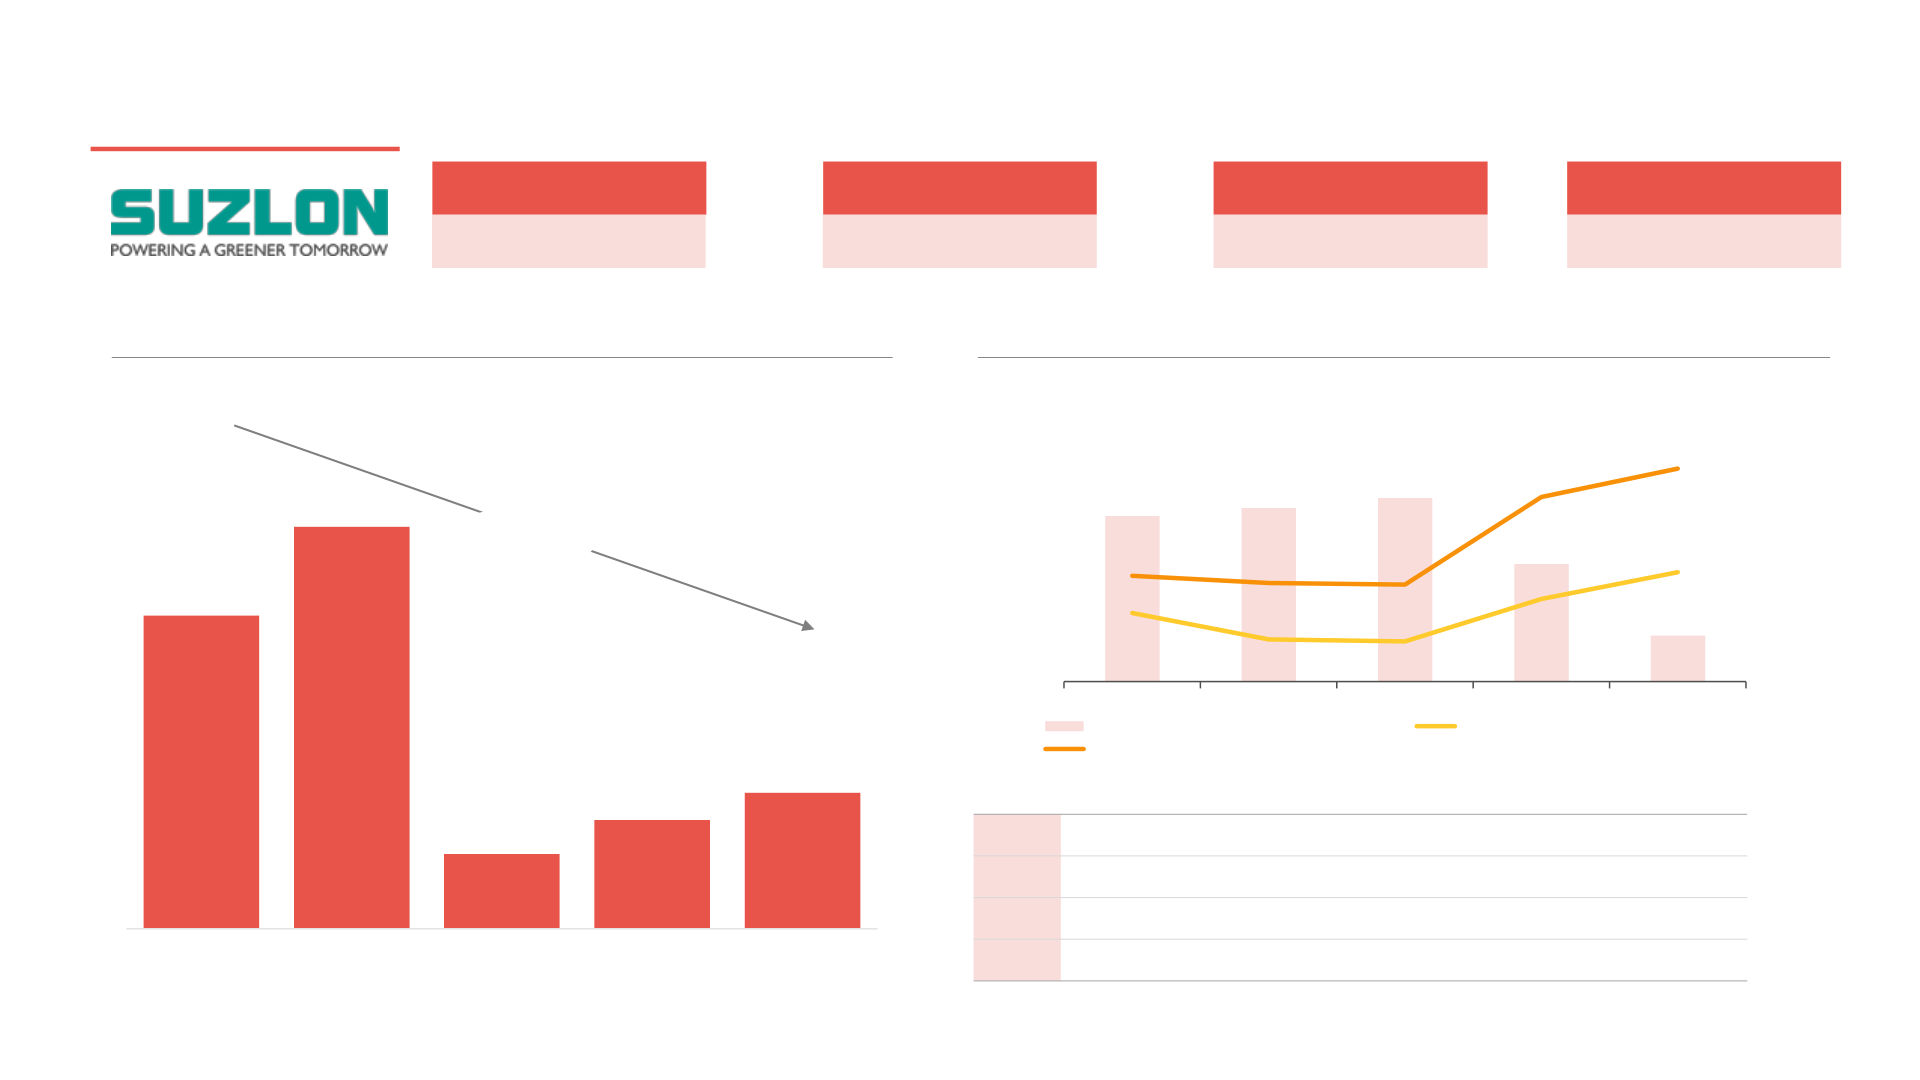
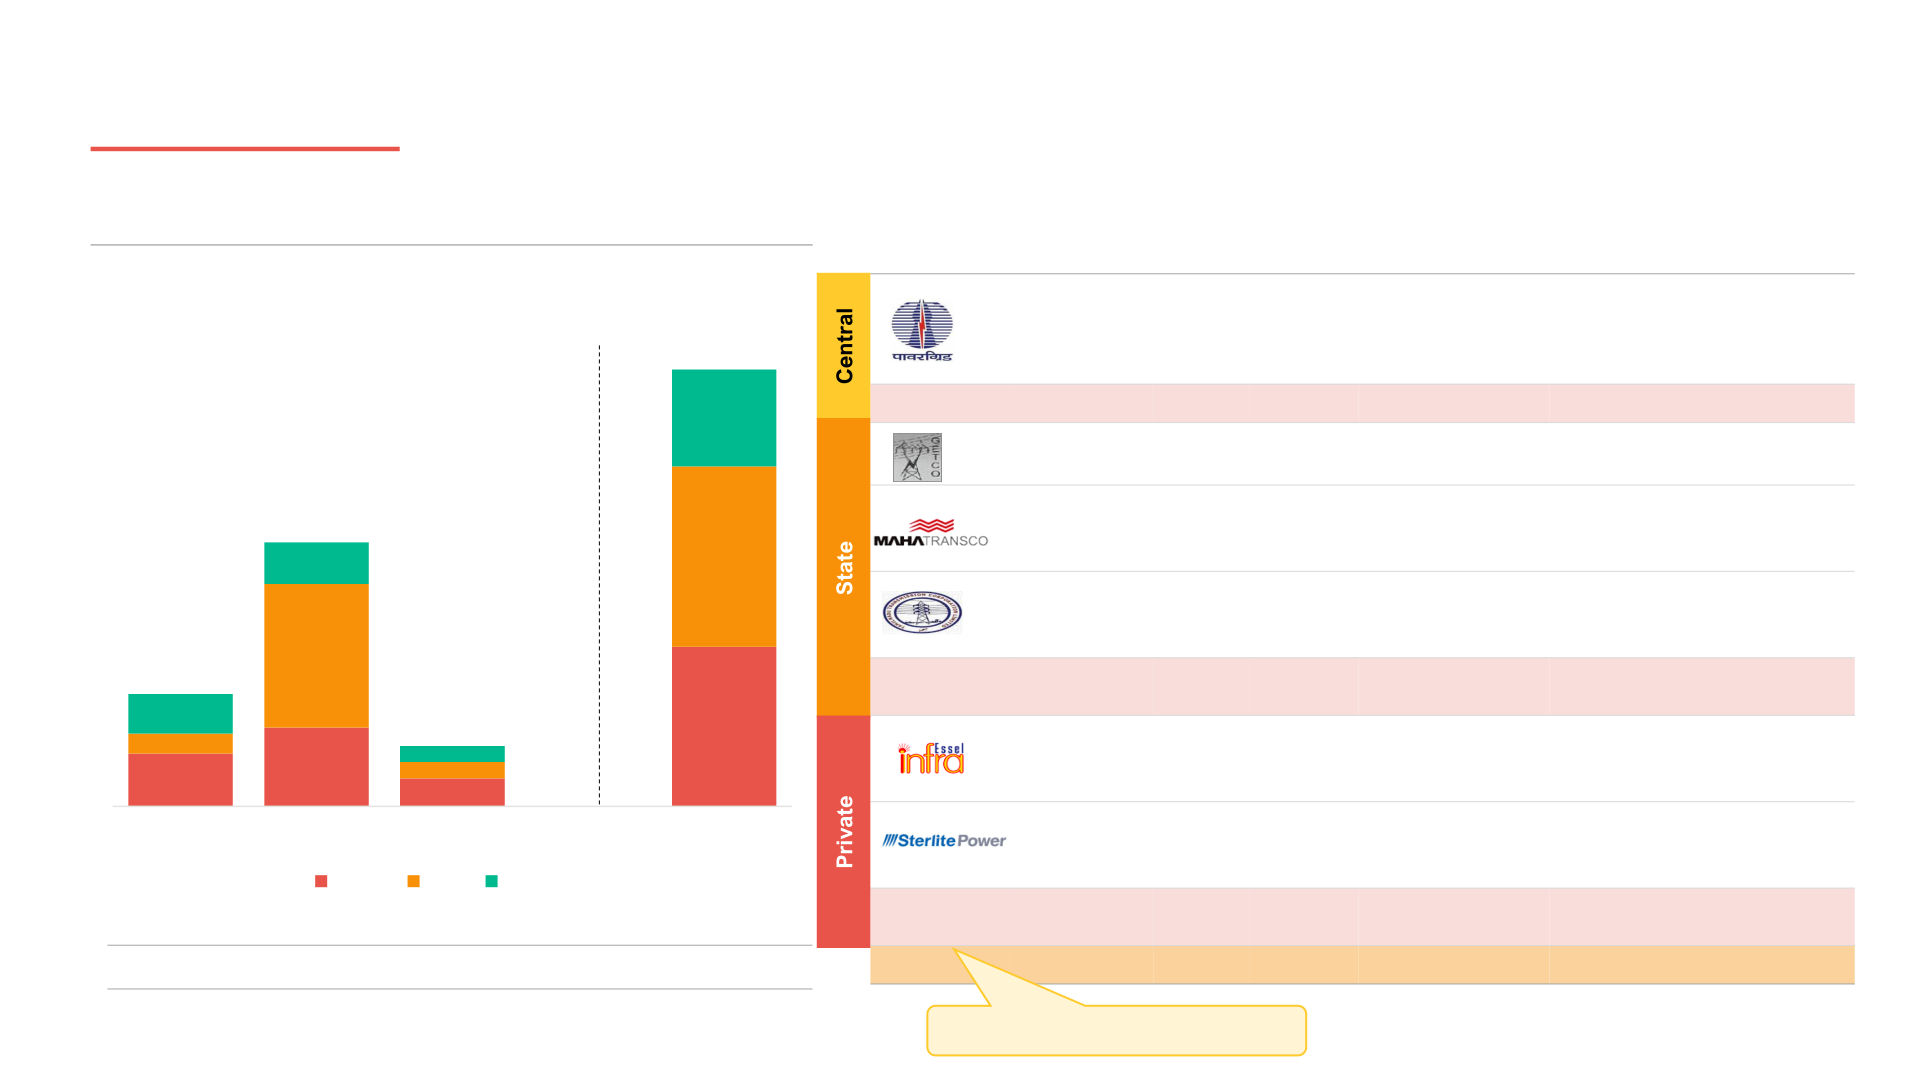
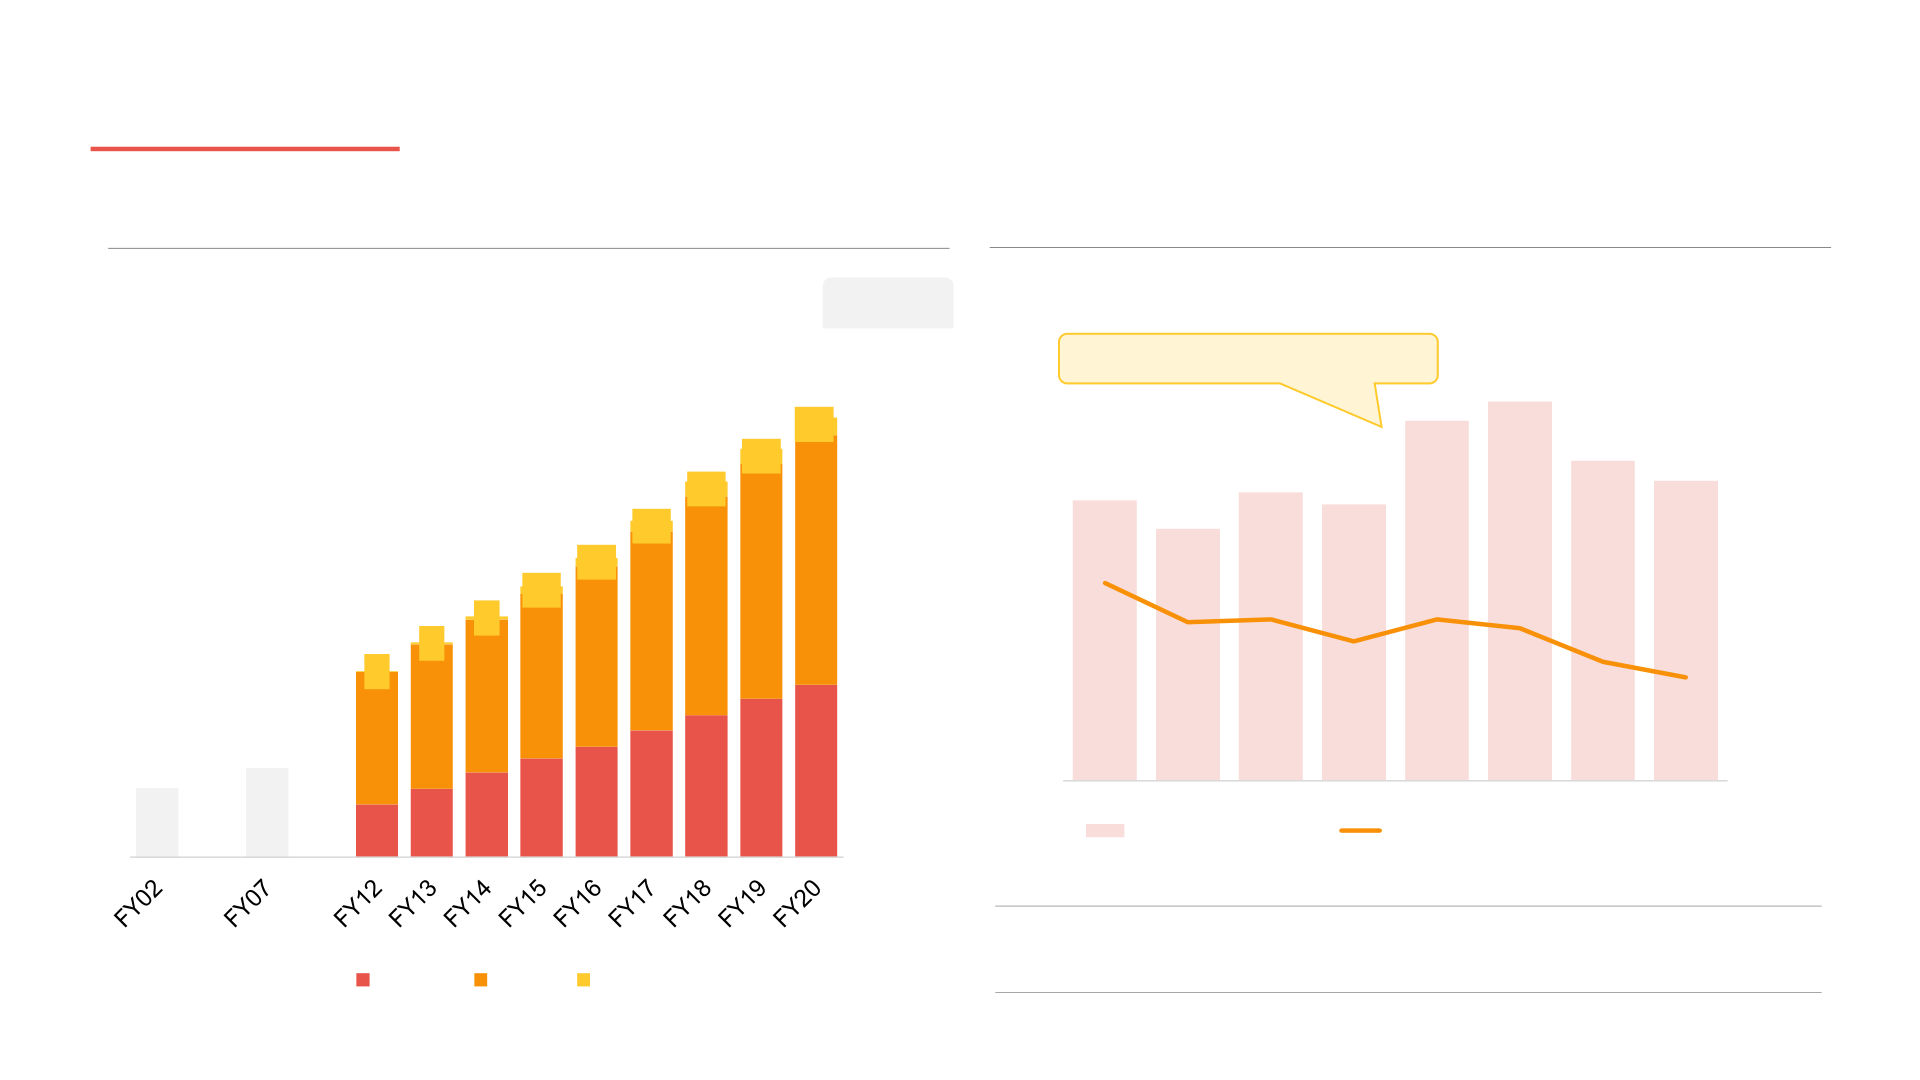
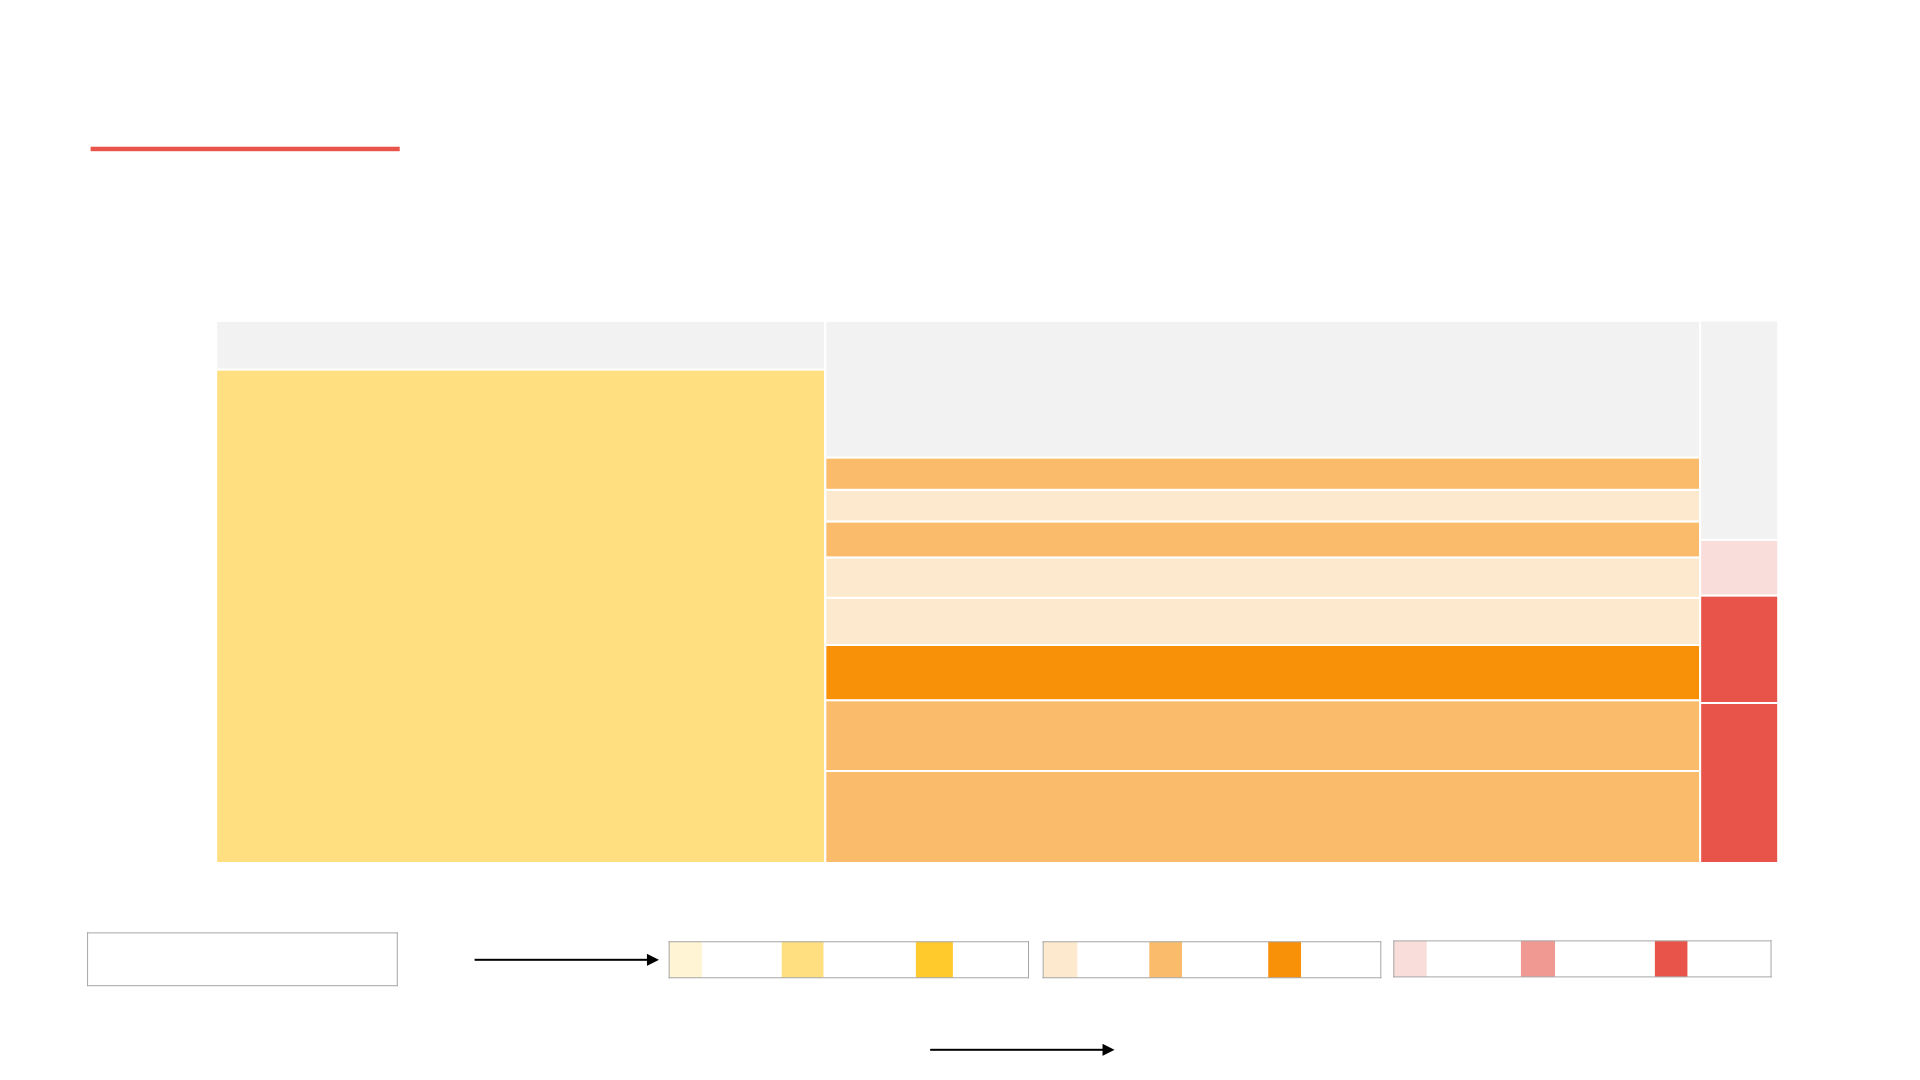
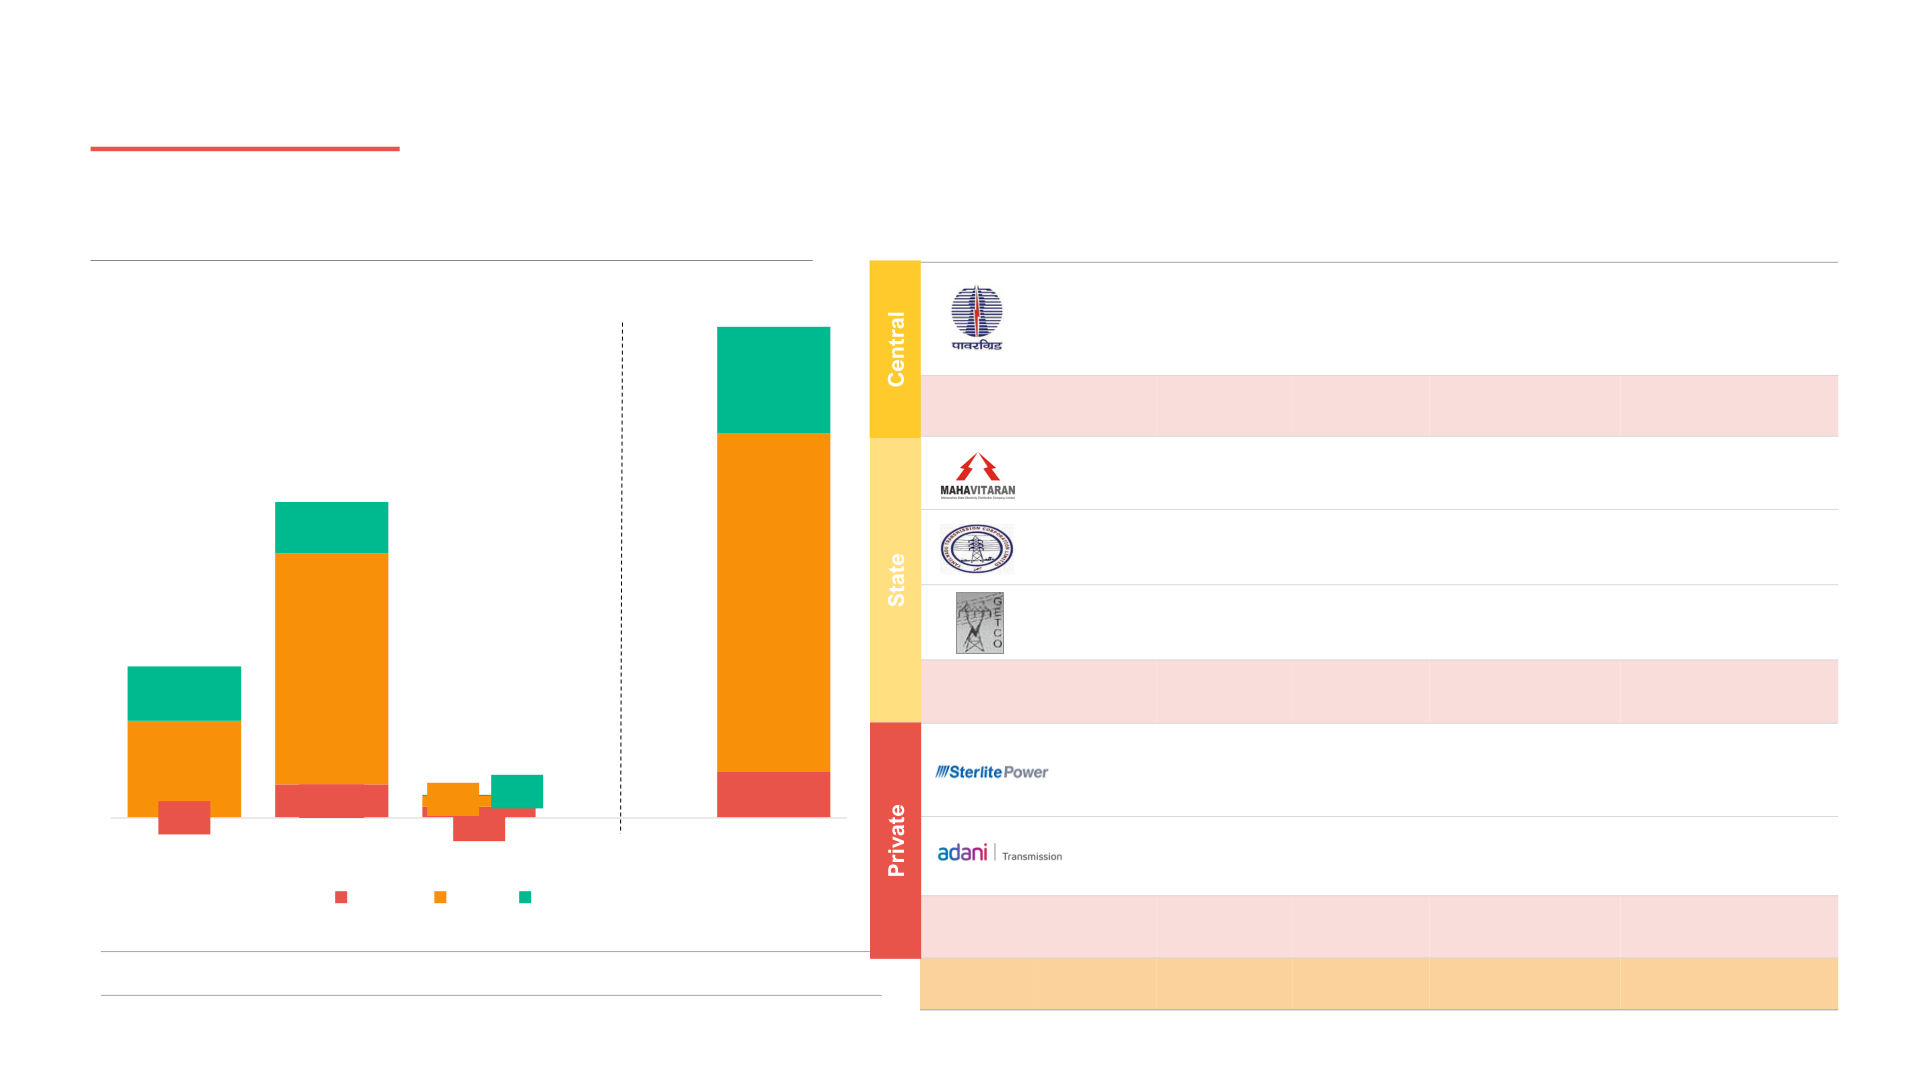
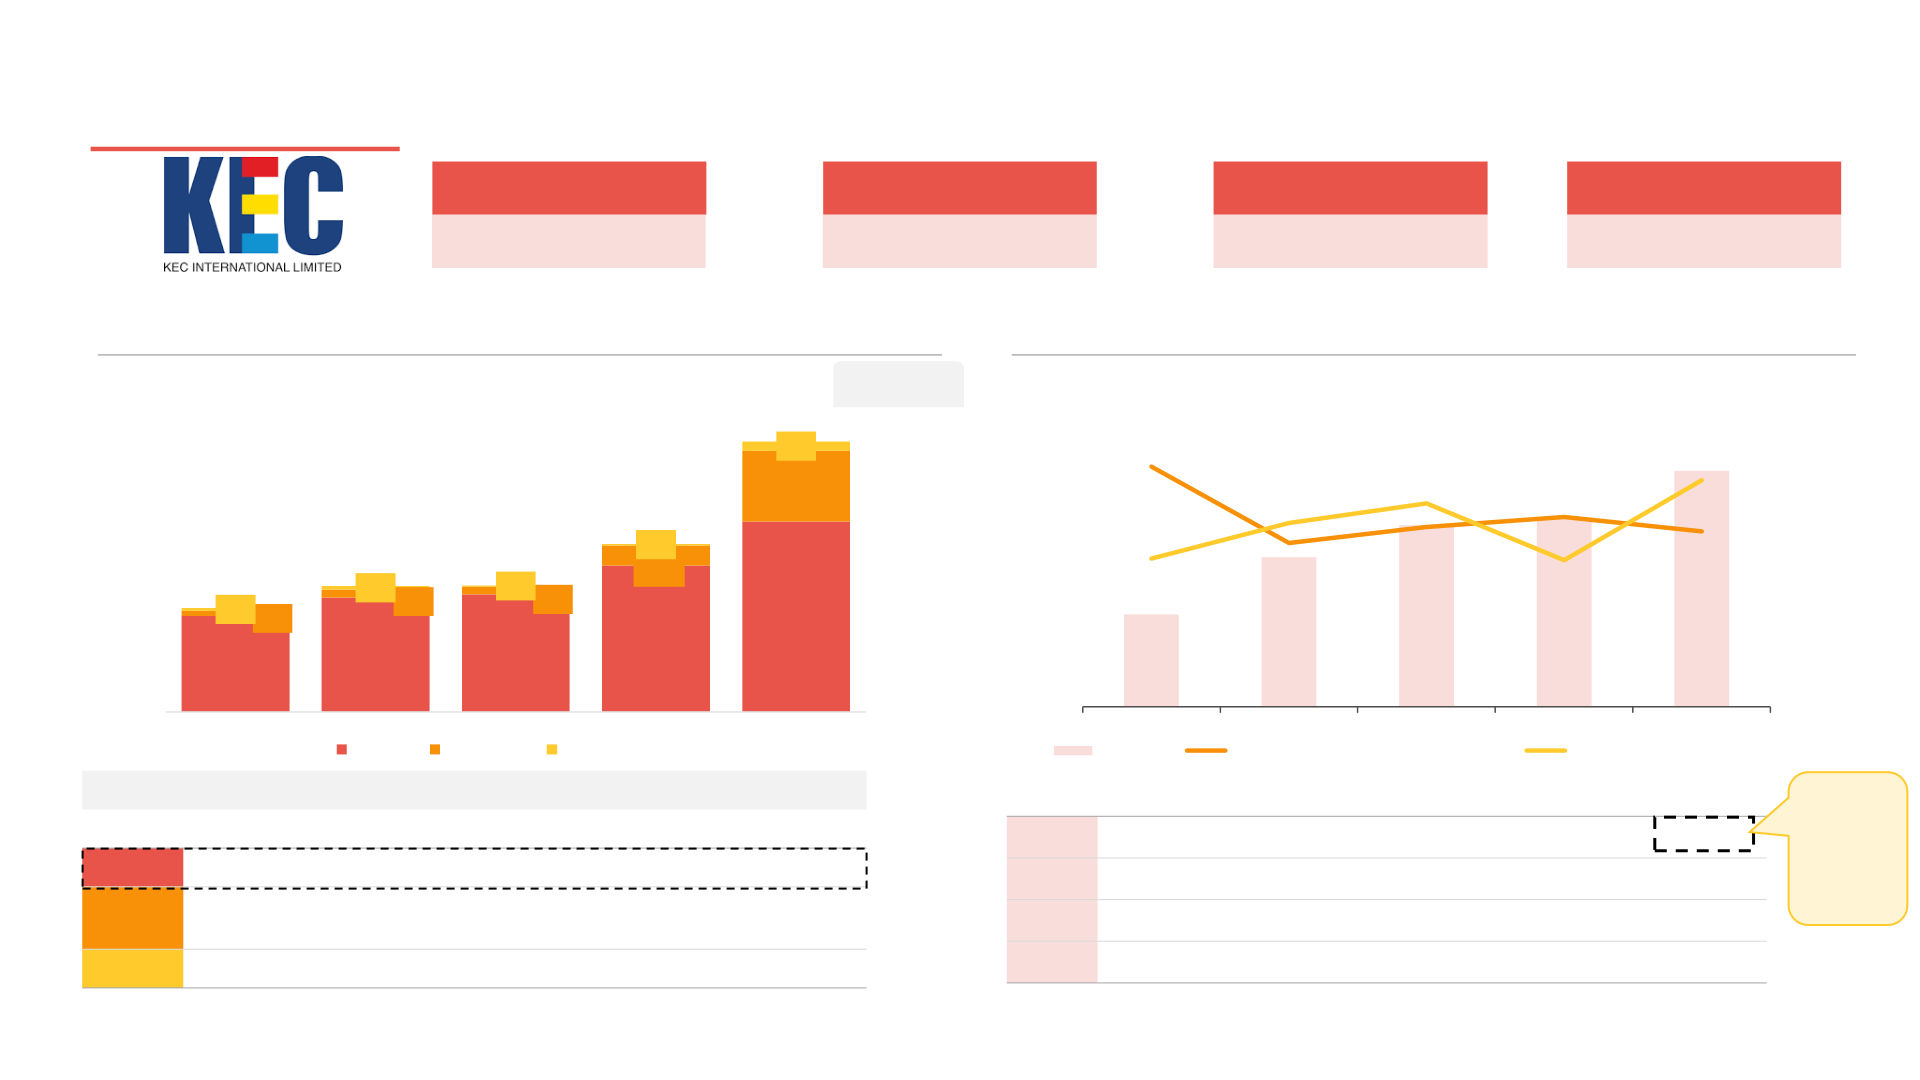
Infrastructure ‘Re - Accelerate’ Series – Power Sector REPORT: How India’s power sector will rebound from COVID - 19 crisis August 2020 Table of contents 1 Executive summary 2 Generation 3 Transmission 3.1 Transmission lines 3.2 Sub - stations 4 Policy recommendations © PGA Labs | 2 Glossary (1/3) Abbreviation Full form Explanation (if required) Money owed by a company to its suppliers. AP Accounts Payable Money owed to a company by its customers AR Accounts Receivable BSPTCL Bihar State Power Transmission Company Ltd. CAGR Compounded Annual Growth Rate Capex Capital Expenditure Money spent by a company to buy, maintain or improve its fixed assets Time taken by a company to convert its investment in inventory into cash flow from sales CCC Cash Conversion Cycle ckm Circuit Kilometers Length of transmission lines laid across a defined track. DIO Days Inventory Outstanding Average number of days a company holds its inventory before selling it DISCOM Distribution Company Companies involved in supplying electricity to customers Average number of days a company takes to pay its suppliers DPO Days Payables Outstanding Average number of days an organization takes to receive payments from its customers DRO Days Receivables Outstanding DVC Damodar Valley Corporation EBITDA Earning Before Interest, Taxes, Depreciation and Amortization ECB External Commercial Borrowing Debt raised by companies from other countries (where interest rates are lower) Firms engaged in construction activities in the infrastructure sector EPC Engineering, Procurement and Construction GDP Gross Domestic Product GETCO Gujarat Energy Transmission Company GSECL Gujarat State Electricity Corporation Limited HPGCL Haryana Power Generation Company Limited © PGA Labs | 3 Glossary (2/3) Abbreviation Full form Explanation (if required) HVPNL Haryana Vidyut Prasaran Nigam Ltd. KPCL Karnataka Power Corporation Limited KPTCL Karnataka Power Transmission Company Ltd. KSEB Kerala State Electricity Board L&T Larsen and Toubro Penalty paid by customers due to delay in payment to suppliers LPS Late Payment Surcharge MAHAGENCO Maharashtra State Power Generation Company MAHATRANSCO Maharashtra Transmission Company MoP Ministry of Power MPPGCL Madhya Pradesh Power Generation Company MPTRANSCO Madhya Pradesh Transmission Company NEEPCO North Eastern Electric Power Corporation NHPC National Hydro Power Corporation NLC Neyveli Lignite Corporation NPA Non - performing assets NPCIL Nuclear Power Corporation of India NTPC National Thermal Power Corporation OPTCL Orissa Power Transmission Company Ltd. PAT Profit After Tax PGCIL Power Grid Corporation of India Ltd. © PGA Labs | 4 Glossary (3/3) Abbreviation Full form Explanation (if required) PLR Prime Lending Rate PSPCL Punjab State Power Corporation Ltd. PPA Power Purchase Agreement RE Renewable Energy RM Raw Material Issues faced by transmission companies in getting the transmission lines laid according to the RoW Right of Way plan due to mid - way obstruction RVPNL Rajasthan Vidyut Prasaran Nigam Ltd. RVUNL Rajasthan Rajya Vidyut Utpadan Nigam TANGEDCO Tamil Nadu Generation and Distribution Company TANTRANSCO Tamil Nadu Transmission Company TSA Transmission Service Agreement TSGENCO Telangana State Generation Company TSTRANSCO Telangana State Transmission Company UPPTCL Uttar Pradesh Power Transmission Company Ltd. UPRVUNL Uttar Pradesh Rajya Vidyut Utpadan Nigam WBPDCL West Bengal Power Development Corporation WBSETCL West Bengal State Electricity Transmission Company Ltd. WC Working Capital Capital requirement of a business to maintain its day - to - day operations © PGA Labs | 5 Foreword The aftereffects of COVID - 19 pandemic will be wide and large. The In the section on ‘EPC company’, we have looked at the trends of pandemic has already affected the economy severely. Although the receivables and payables for EPC companies in the sector, which is recovery is going to be a long - drawn and hard - fought process, reflective of the health of asset owners in those sectors. We have Indian economy is resilient and shall bounce back. examined the impact of COVID - 19 on key parameters like raw material and equipment supply, manpower availability, payment terms and costing, availability of finance, payment terms and This report is intended to provide various industry stakeholders pricing, and consumer demand. We have also analysed the likely including business leaders an overall perspective on the impact of recovery scenario for all stakeholders in the sector. COVID - 19 on the power sector as the economy starts recovering. The situation is evolving rapidly, and some of the expected India has been chasing ambitious power and energy generation and scenarios might have slight variations. This report reflects our transmission targets. While energy companies have been powering perspectives in July 2020. Contact us for latest updates. through the COVID - 19 pandemic somewhat unscathed - the aftereffects will be wide and large. To ensure the country is on track to achieve its targets and reduce coal dependencies, there is a We, at PGA Labs, look forward to continuing the discussion with our need for unlocking operational efficiencies and following through on friends across sectors and exchanging notes as the situation the renewal energy trajectory. evolves. The report deep dives into growth trends in the power sector along with key players in each sub - sector. In the section titled ‘Project _____________________ _____________________ status’, we have assessed how many projects are currently stuck Aryaman Tandon Madhur Singhal vis - à - vis ongoing projects in the power sector. Practice Director, Infrastructure MD, Praxis Global Alliance © PGA Labs | 6 Key highlights Overall Power generation Power transmission • India is chasing ambitious RE targets and • India’s installed capacity has reached ~99% of the • India’s transmission capacity is growing in line enhancing its T&D infrastructure. Increasing required capacity Hence, future growth is going to with generation capacity RE use is decreasing dependence on coal be lower (~7% CAGR till FY27) and largely in RE, – Improving inter - state transmission capacity and connecting upcoming RE plants to grid are – Contribution of thermal sector to reduce to which will reach at least 110 - 120 GW by FY22 key growth drivers ~50% by FY22 and ~43% by FY27 – Opportunity to export more power to neighboring countries • Private sector is a recent entrant in the sector and • Power sector has higher public sector caters to <8% of the transmission network. presence; Private sector dominates renewable • New private investment in generation sector is – Private firms primarily cater to intra - state energy sector expected to be largely in renewable sector transmission network • Owing to past bad experiences, long term • Existing private players in thermal power firms • Public sector firms will not face issues in raising PPAs in thermal is unlikely to pick - up in future. find it difficult to raise money from financial money as they borrow from Power Finance Renewables sector is likely to continue with institutions due to their current financial health Corporation. Private firms in the sector are in long term PPAs relatively better financial health, and will be able • WC requirement for EPC firms has increased to borrow from financial institutions • EPC companies serving transmission sector from 2.5 to 4.5 months over FY11 - 19, with DRO are better - placed due to lower delays in increasing from 7 to 11 months – Increase in interest cost can affect project • Stable payment timelines for EPC from asset payments from asset owners profitability, and long - term attractiveness of the owners due to predictable revenue flow leading to sector for EPC firms higher resilience • COVID - 19 will impact the construction activity – Better project profitability leading to higher in short - to - medium term, resulting in project • Power demand is expected to recover to pre - attractiveness for EPC players delays and increased project cost. Payment COVID levels within 6 months. However, firms will delays by DISCOMs are also expected face high ARs due to payment delays • Asset owners might face high receivables dues to – New construction projects to face near - to - stress in DISCOMs; poor DISCOM health might medium term budgetary constraints drive privatization Source(s): PGA Labs analysis © PGA Labs | 7 Power Power sector primarily consists of 3 segments – Generation, transmission and distribution Power Generation Transmission Distribution Power generation refers to Power transmission refers to Power distribution refers to production of electricity using coal / transportation of electricity from providing electricity to the final gas / diesel (thermal), water (hydro) generation points to DISCOM’s point of consumption. and renewable (sun, wind, etc.) substations. DISCOMs supply electricity at commercial rates Passes through Electricity Passes through distribution sub - transported through substations between stations for voltage transmission lines transmission lines reduction Commercial customer Power generation Power transmission grid Transmission Distribution stations substations substations DISCOMs supply Domestic customer Transmission electricity at domestic rates : Source(s): PGA Labs analysis © PGA Labs | 8 Addressed in this report Power - Generation Power generation comprises thermal, hydro, renewable and nuclear energy; Thermal energy’s contribution to installed capacity in India mirrors global value Generation Renewable Thermal Hydro Nuclear Solar Coal - based Wind Gas - based Others Diesel - based % contribution to Thermal Hydro Nuclear Renewable installed capacity India 63% 13% 2% 22% Global* 63% 17% 5% 15% Note(s): *Global installed capacity figures are for 2017 Source(s): Central Electricity Authority, Secondary research, PGA Labs analysis © PGA Labs | 9 Power - Generation Sector overview: The installed generation capacity has increased at 8.6% CAGR over the period FY12 – FY19; renewable energy is growing at the fastest pace Growth accelerated in the period FY09 – FY12 as compared to FY06 – % capacity expansion has consistently declined post FY09; thermal power accounts for 63% capacity FY16 along with net yearly capacity increase CAGR CAGR Installed capacity addition Installed capacity in India (GW) FY06 - 12 FY12 - 19 Increase in installed capacity Capacity addition as % of (GW) installed capacity 35 40% 356 8.3% 8.6% 30 344 6.8 327 5.9% 5.1% 0 30 6.8 26 26 305 6.8 7 25.7% 17.9% 30% 77.6 1 23 0 5.8 69.0 25 275 22 57.2 0 4 2 45.9 249 3 5.8 7 1 1 1 20 17 39.0 45.4 2.2% 223 3.2% 4.8 45.3 44.5 42.8 20% 1 0 35.0 200 4.8 41.3 15 11 4.8 27.5 12 40.5 24.5 0 12 148 39.5 22 21 10 20 4.1 39.0 10% 124 2 17 9 13.2 3.4 11% 10% 10% 10% 7% 6.2 5 1 36.9 226.3 222.9 8.1% 8.1% 218.3 5% 210.7 8 0 32.3 3% 188.9 5 168.3 3 151.5 0 0% 131.6 93.7 82.4 FY13 FY14 FY15 FY16 FY17 FY18 FY19 Thermal Hydro Renewable FY06 FY09 FY12 FY13 FY14 FY15 FY16 FY17 FY18 FY19 Nuclear % capacity addition Thermal Hydro Renewable Nuclear Key reasons for declining % capacity addition Estimated required generation capacity (GW) • Stagnancy in thermal capacity expansion post FY16 due to stress in private power production companies. 136 166 218 244 260 285 311 330 346 358 • Delay in commissioning of hydro power projects due to agitation by environmental activists. Source(s): Central Electricity Authority, PGA Labs analysis © PGA Labs | 10 Power - Generation Competitor landscape: NTPC is the largest power producer in India; private sector comprises ~45% of the installed capacity Total ~356 GW Overview by installed capacity % (FY19) 163 GW 108 GW 86 GW 100% NEEPCO, 2% NLC India, 7% 90% NPCIL, 8% Others, 27% 80% NHPC, 8% Others, 45% HPGCL, 4% DVC, 8% 70% PSPCL, 4% APGENCO, 5% 60% TSGENCO, 5% GSECL, 5% Torrent Power, 2% 50% Essar Power, 2% UPRVUNL, 6% Jaypee Power Ventures, 3% GMR Energy, 3% JSW Energy, 3% WBPDCL, 6% 40% Greenko , 3% Sembcorp, 3% MPPGCL, 6% RenNew Power, 3% NTPC**, 67% Reliance Power, 4% TANGEDCO, 6% 30% Vedanta, 6% RVUNL, 7% 20% Adani Power, 8% KPCL, 8% Suzlon Energy*, 8% 10% MAHAGENCO, 12% Tata Power, 8% 0% Private State Central CAGR over last 5 years Central Government companies State Government companies Private companies (FY14 – 19) <5% 5 - 10% >10% <5% 5 - 10% >10% Confidence level ◑ ◑ <5% 5 - 10% >10% Note(s): *Suzlon Energy manages wind energy assets through its O&M arm and does not own them; **NTPC’s installed capacity is inc lusive of the installed capacity of its JVs / subsidiaries © PGA Labs | 11 Source(s): Central Electricity Authority, Company websites, PGA Labs analysis Low High ○◔◑◕● ○◔◑◕● Power - Generation Competitor landscape: Thermal energy comprises 64% of the installed capacity; renewable energy sector is dominated by private companies Total ~356 GW Overview by installed capacity % (FY19) 226 GW 78 GW 45 GW 7 GW 100% 90% Others, 35% 80% Others, 42% Others, 54% 70% NEEPCO, 3% JSW Energy, 3% 60% Jaypee Energy, 4% MPPGCL, 2% UPRVUNL, 2% APGENCO, 4% NPCIL, WPDCL, 3% 50% KSEB, 5% RVUNL, 3% 100% CLP India, 1% DVC, 3% Hero Future Energies, 2% TANGEDCO, 5% Azure Power, 2% Vedanta, 4% Sembcorp, 2% 40% TSGENCO, 5% Tata Power, 4% Adani Green, 3% Tata Power, 4% MAHAGENCO, 6% MAHAGENCO, 5% Acme Solar, 4% 30% Adani Power, 5% NTPC, 7% Greenco , 6% KPCL, 7% 20% ReNew Power, 7% NTPC, 25% 10% Suzlon Energy*, 16% NHPC, 16% 0% Nuclear Thermal Renewables Hydro Central Government companies State Government companies Private companies Confidence level ◕ ◕ Note(s): *Suzlon Energy manages wind energy assets through its O&M arm and does not own them Source(s): Central Electricity Authority, Company websites, PGA Labs analysis © PGA Labs | 12 Low High ○◔◑◕● ○◔◑◕● Power - Generation Competitor landscape: Wind energy accounts for ~45% of RE capacity; Suzlon is the largest RE asset manager while ReNew and Greenko are the largest RE IPPs Total ~78 GW Overview by installed capacity % (FY19) 35.6 GW 28.1 GW 13.9 GW 100% 90% Other, 35% 80% Other, 46% 70% Continuum Wind Energy, 2% Hero Future Energies, 2% CLP India, 3% 60% Mytrah Energy, 3% Mahindra Susten , 1% Tata Power, 3% Hero Future Energies, 2% Sembcorp, 4% 50% Avaada Power, 2% Greenko , 6% NTPC, 3% Other, 100% ReNew Power, 4% 40% ReNew Power, 7% NLC, 5% Tata Power, 5% 30% Azure Power, 6% Greenko , 7% 20% Suzlon Energy*, 35% Adani Green Energy, 8% 10% Acme Solar, 10% 0% Wind Solar Others Confidence level ◕ ◕ Primarily thermal power companies RE - focused companies Note(s): *Suzlon Energy manages wind energy assets through its O&M arm and does not own them Source(s): Central Electricity Authority, Company websites, PGA Labs analysis © PGA Labs | 13 Low High ○◔◑◕● ○◔◑◕● Power - Generation Thermal power project status: Private sector has witnessed the highest stuck project capacity in thermal power generation sector Equal distribution of projects among different sectors Key stuck Complete WIP Broad reasons for in FY19; state sector has negligible stuck capacity Company Stuck (GW) projects d (GW) (GW) project delays (capacity in GW) Thermal power capacity FY19 (GW) 74 • Delay in land • Nabi Nagar acquisition due 5.8 Thermal to protest by 2 19.1 1.3 Power Plant villagers (1.3) • Cash slow issues with contractor Others (1) - 1.6 - 46.6 - 5.7 - - 5.1 - - 4.0 - 25 25 24 1.0 2.8 2.0 Others (7) 2.8 7.8 - 3.3 • Lanco • Financial 20.7 22.6 - - 4.0 Vidarbh (1.3) problems faced 21.8 20.4 by the company • Nasik 1.3 0 • Financial Thermal Centre State Private Total - - 2.7 problems faced Power Plant by the company (0.84) Stuck WIP Complete Stuck projects as a % of total projects Others (20) 1.0 3.3 13.7 6% 0% 83% 29% Total 5.8 46.6 21.8 Source(s): Central Electricity Authority, PGA Labs analysis © PGA Labs | 14 Power - Generation Hydro power project status: Central and private sectors have higher stuck project capacity; cash flow issues primary concern for private projects Central government primarily owns hydro power Key stuck Complete Broad reasons for Company WIP (GW) Stuck (GW) projects (capacity projects; state sector has lowest stuck capacity d (GW) project delays in GW) • Agitation by Hydro power capacity FY19 (GW) • Subansiri Lower activists due to fear - 1.8 2.5 (2) of dam safety and 13 downstream impact 1.2 • Construction • Lata Tapovan - 0.6 0.2 stopped due to (0.17) High Court order Others 0.6 2.1 - • Payment dispute 8 • Lower Kalnai 7.3 - 0.03 0.04 with sub - (0.04) contractors 0.6 • Additional budget • Koyna Left Bank - - 0.08 yet to be PSS sanctioned 4.5 Others 0.2 2.2 - 3 3 • Ratle Hydro • Law and order - - 0.85 Electric Power issues and Indus 0.4 0.2 4.7 (0.85) Water Treaty 0.6 2.7 2.2 • Maheshwara 1.9 • Cash flow issues - - 0.4 Hydel Power with the company 0.1 (0.4) Central State Private Total • Rangit IV (0.12) • Cash flow issues - - 0.12 with the company Stuck WIP Complete Stuck projects as a % of total projects Others 0.4 0.6 1.4 34% 5% 67% 36% Total 1.2 7.3 4.7 © PGA Labs | 15 Source(s): Central Electricity Authority, PGA Labs analysis Power - Generation EPC company: L&T has reduced its dependence on power generation projects post FY14; trade payables have increased whereas receivables are consistent Revenue* EBITDA* PAT* Order book size* INR 896.6B INR 114.5B INR 66.8B INR 2,934.2B Contribution of power generation projects to L&T’s order WC requirement has considerably declined primarily due to book has considerably declined post peak in FY13 increase in trade payables Trade receivables as % of revenue CAGR Revenue (INR B) Order book composition of L&T (INR B) FY07 - 19 (Trade payables as % of cost 2,934 18.9% 1000 75% 870 2,613 1.1% 59 Power segment in L&T’s order 205 59 13.6% 2,326 61% 131 800 65% book refers to power plant 157 381 0% 70 131 663 233 construction as it includes T&D in 261 15.2% 609 1,536 233 570 54% Infrastructure 140 600 55% 1,302 49% 77 154 435 52 208 2,230 703 430 25.7% 41% 1,934 337 40% 400 45% 417 123 1,652 369 49 113 46% 156 155 37% 753 52 98 176 44 32% 59 469 30% 70 288 200 30% 35% 144 33% 29% 31% FY07 FY09 FY11 FY13 FY15 FY17 FY19 29% 0 25% Infrastructure Oil and Gas Power Processes Others FY07 FY09 FY11 FY13 FY15 FY17 FY19 % share in order book Revenue Trade receivables as % of revenue Trade payables as % of cost FY07 FY09 FY11 FY13 FY15 FY17 FY19 Infra. 39% 41% 36% 49% 71% 74% 76% FY07 FY09 FY11 FY13 FY15 FY17 FY19 1 Oil 19% 14% 12% 8% 6% 10% 13% DPO 106 97 144 144 168 191 207 Power 2 DRO 107 94 99 124 143 107 107 16% 22% 32% 28% 10% 5% 2% gen. 3 DIO 79 80 19 17 20 15 18 Proc. 12% 16% 16% 10% 10% 6% 7% 4 CCC 80 77 - 26 - 3 - 5 - 69 - 82 Other 14% 7% 4% 5% 3% 5% 2% Note: * represents values for FY19; Revenue refers to operating revenue; Sub - contracting expenses have been considered as a part of COGS for calculating DPO, DIO and CCC 1 2 3 4 DPO is no. of days taken to pay off the suppliers; DRO is number of days taken to receive payment from customers; DIO is no. of days taken to liquidate inventory; CCC is no. of days taken to convert its investment in inventory into cash flow from sales © PGA Labs | 16 Source: Company website, Annual reports, PGA Lab Analysis Power - Generation EPC company: Power EPC firms face high payment delays from asset owners due to underlying stress in private sector firms; average CCC of 3 - 5 months Revenue* EBITDA* PAT* Order book size* INR 32.8B INR 3.3B INR 0.15B INR 51.3B Power projects contribute to 65% of the order book of BGR High WC requirement for BGR Energy as DRO is consistently Energy higher than DPO; revenue stagnant post FY11 Trade receivables as % of revenue (%) Revenue (INR B) Order book for BGR Energy (INR B) Trade payables as % of cost (%) 33.3 47.5 50 100% 92% 88% 40 34.5 33.7 32.8 31.1 80% 72% 30 67% 63% 20 60% 10 46% 58% 57% 42% 54% 0 40% 8.2 7.2 FY11 FY13 FY15 FY17 FY19 Revenue Trade receivables as % of revenue Trade payables as % of cost 1.3 1.2 FY11 FY13 FY15 FY17 FY19 DPO 129 190 202 210 197 Power Environment Electrical Oil and gas equipment Air fin cooler DRO 197 321 280 253 328 % share in order book DIO 3 6 7 6 6 Power Environment Electrical Oil and gas Air fin cooler CCC 72 137 85 49 136 65% 16% 14% 3% 2% Note(s): * represents values for FY19; Revenue refers to operating revenue Source(s): Company website, Annual report, PGA Labs analysis © PGA Labs | 17 Power - Generation RE company: Suzlon Energy has witnessed higher working capital requirement due to higher inventory levels; average DRO is 120 - 180 days Revenue* EBITDA* PAT* Order book size* INR 49.8B INR 0.43B (INR 15.4B) INR 76B WC requirement considerably higher in FY19 due to higher DIO; Order book volume has declined considerably post FY13; company back in slow recovery post FY15 average CCC is ~100 days Trade receivables as % of revenue (%) Revenue (INR B) Order book volume for Suzlon Energy (GW) Trade payables as % of cost (%) 74% 250.0 80% 198.4 64% 187.4 178.8 200.0 5.9 60% CAGR 150.0 127.0 37% 38% - 9.9% 34% 40% 33% 100.0 4.6 49.8 20% 29% 50.0 24% 15% 14% 0.0 0% FY11 FY13 FY15 FY17 FY19 Revenue Trade receivables as % of revenue Trade payables as % of cost 2.0 1.6 FY11 FY13 FY15 FY17 FY19 1.1 DPO 125 140 132 188 290 DRO 76 78 50 88 178 DIO 167 145 99 145 366 FY11 FY13 FY15 FY17 FY19 CCC 118 83 17 45 254 Source(s): Company website, Annual report, PGA Labs analysis © PGA Labs | 18 Power - Generation COVID impact: COVID is expected to impact RM, labor and capex availability for construction in the short - term Supply side factors Demand side factors Payment terms and Payment terms and RM and equipment Labor Availability of finance Electricity demand costing pricing • No restriction on • No restriction of • No major impact as • ECBs reduced due to • No major impact as • Demand availability of raw availability of labor there was limited exchange rate electricity increased in long - materials and for construction impact on fluctuations. consumption did not term as power Overall ● ● ● ● ● ● equipment construction activity • Benchmark PLR decline consumption and electricity increased from started increasing consumption 13.25% to 14% • EPC company: • EPC company: • EPC company: Delay • EPC company – WC • EPC company: • Decline in Limited Labor starts vendor payments. loans for ongoing Terms fixed in the demand due to availability of joining back in Cost (RM etc.) might projects not to be contract , but AR closure of Short - RMs due to month 2 and 3. decrease due to affected. might increase industrial and term disruption; Contract labor reduced demand. • Asset owners: Short - • Asset owners: commercial ● ● ● ● ● ● imports from may not be • Asset owners: term increase in PLR. Moratorium on establishments (1 to 3 China to be hit available Increase in AP due to Government projects payment will • Resultant decline months) • Asset owners: • Asset owners: delay in DISCOM (PFC - funded) to be increase AR. PPA in capacity RM (coal etc.) to Labor available payments. No impact less affected prices to be utilization Covered in essential remain available on project cost unaffected commodities • EPC company: • EPC company : • EPC company: AP • Asset owners: Power • EPC company: AR • Demand starts Resumption of More than 80% reduces as customer sector lending might to start declining as increasing as RM supply. laborers join payments resume. resume with payments resume offices and Medium - Imported back. Contract Cost remains government push in • Asset owners: AR industries start term (4 equipment labor starts reduced as demand the form of reduced start reducing as opening slowly. ● ● ● ● ● ● supply to remain returning. remains subdued lending rates . RE DISCOM payments • Capacity to 8 disrupted • Asset owners: • Asset owners: AP projects to resume but resume, and non - utilization still months) • Asset owners: Labor available starts reducing as high NPA stress in PPA prices to start below peak levels. Normal supply DISCOM payments private thermal projects increasing resume to continue • EPC company: • EPC company: • EPC company: • Asset owners: Power • EPC company: AR • Demand back to Long - Full - scale Full labor joins Supplier payments sector lending to normalize pre - COVID levels term (9 resumption of back normalize thermal projects • Asset owners: AR ● ● ● ● ● ● construction • Asset owners: • Asset owners: AP remains affected, but and pricing to 12 • Asset owners: Labor available normalizes normalizes for others normalize months) Normal supply Source(s): PGA Labs analysis © PGA Labs | 19 Increasing negative Increasing positive impact impact ● ● ● ● ● Power - Transmission Power transmission consists of 2 key components – Transmission lines and sub - stations Transmission Transmission lines* Sub - stations* • Transmission lines transfer electricity • Sub - stations transfer electricity from the point of generation to the between transmission lines. distribution electrical sub - stations • They are typically used to increase or decrease the voltage of the current. Private Central State Note(s): * Transmission lines and sub - stations referred in the report are those equal to or above 220 kV Source(s): PGA Labs analysis © PGA Labs | 20 Power – Transmission – Transmission lines Sector overview: 92% of transmission lines are owned by government companies; moderate CAGR of 6.5% in line with GDP growth of India Private companies have observed faster growth that Capacity addition as a % of net capacity has consistently government companies during FY12 - 20 declined post FY16 Capacity added as % of net Capacity added (K ckm ) Installed transmission lines in India CAGR installed capacity (K ckm ) FY12 - 20 30.0 20.0% 28.1 Comparative decline in CAGR to 6.5% 425 26.3 9% over FY17 – FY20 413 18.0% 391 18% 32 25.0 23.1 31 22.4 16.0% 368 22.1 27 342 14.0% 25 20.0 313 20 17.1 16.7 12.0% 291 18 275 13 257 230 4.9% 15.0 10.0% 224 11 214 11.7 8 7.1% 202 8.0% 6.2% 5.7% 192 5.9% 196 10.0 5.4% 181 7.1% 6.0% 8.2% 172 164 152 157 2.7% 4.0% 5.0 2.0% 7.4% 0.0 0.0% 163 159 150 141 129 115 FY13 FY14 FY15 FY16 FY17 FY18 FY19 FY20 106 99 92 Capacity added % addition w.r.t. installed capacity Key reasons for declining % capacity addition • Projects getting stuck due to delays in government approvals and land acquisition - related protests • Less focus on technology and innovation during execution leading to delays Central State Private • Delay in completion of power generation projects Source(s): Central Electricity Authority, PGA Labs analysis © PGA Labs | 21 Power – Transmission – Transmission lines Competitor landscape: PGCIL has the highest transmission line network in India; state government owned companies own 54% of the transmission line network Total ~ 425K cKm Capacity overview by transmission line length (FY20) 163K cKm 230K cKm 32K cKm 100% Others 5% Others 12% 90% KSEB 2% HVPNL 2% Others WBSETCL 3% OPTCL 3% 33% 80% BSPTCL 3% PSTCL 4% 70% TSTRANSCO 5% TANTRANSCO 5% Essel Infra 60% 10% KPTCL 6% APTRANSCO 6% 50% Sterlite MPTRANSCO 8% Power PGCIL 95% 25% 40% UPPTCL 8% 30% RVPNL 8% Adani 20% MAHATRANSCO 11% Transmission 32% 10% GETCO 14% 0% Central State Private State government companies Central government companies Private companies CAGR over last 5 years (FY15 – 20) Confidence level <5% 5 - 8% >8% <4% 4 - 6% >6% <15% 15 - 20% >20% ◑ ◑ Source(s): Central Electricity Authority, Company websites, PGA Labs analysis © PGA Labs | 22 Low High ○◔◑◕● ○◔◑◕● Power – Transmission – Transmission lines Project status: State government owned companies have the highest number of WIP projects; RoW and contractor performance key issues impacting growth Stuck projects accounted for 37% of total projects Key stuck Completed WIP (K Stuck Broad reasons for project completed or under construction in India Company projects (length (K ckm ) ckm ) (K ckm ) delays in K ckm ) • RoW issues due to fields • Raigarh – Transmission line length (K ckm) and buildings 9.2 3.3 11.7 Pugular Link • Delay in approvals – Forest 104.1 (~3.5) and Finance dept. Others (2) 0.2 1.5 0.9 23.1 • Mundra Zerda • Delay in tender processing 0.8 7.3 5.0 line (~0.6) • RoW – fields • Babhaleshwar 62.9 • RoW issues – fields 0.4 1.6 2.2 – Kudus line • Farmer protests (~0.4) 42.9 9.9 • Rasipalayam - • RoW issues 0.5 3.8 1.6 Dharmapuri • Delay in approvals line (~0.4) 34.2 26.8 Others (27) 8.2 21.5 10.0 9.4 14.4 38.1 • Warora – • RoW issues – fields and 4.8 3.8 - - 2.4 Warangal buildings 18.8 3.9 12.6 (~0.7) • Delay in approvals 6.7 • Khandwa Pool • Delay in approval – Power Centre State Private Total 1.2 0.9 0.7 – Dhule line dept. (~0.4) Stuck WIP Complete Others (34) 2.6 3.0 3.6 Stuck projects as a % of total projects Total 23 43 38 47% 30% 46% 37% Private power producers build transmission Source(s): Central Electricity Authority, PGA Labs analysis © PGA Labs | 23 lines till the nearest grid Power – Transmission – Sub - stations Sector overview: Substation capacity has increased at 11% CAGR over FY12 – FY20, which is slower than growth during FY07 – FY12 Substation capacity addition as % of installed capacity has Private players’ participation has grown faster than declined post FY17 government firms in the substation operations Substation capacity in India Capacity added (K MVA) Capacity added as % of net CAGR (K MVA) installed capacity FY12 - 20 100 30.0% Decline post FY17 is consistent with decline in transmission line addition 86.2 90 11% 968 81.8 25.0% 900 43% 39 80 72.7 827 34 68.2 65.6 70 63.7 62.8 20.0% 33 741 57.3 60 24 659 13.5% 596 50 15.0% 550 8% 18 10.8% 518 531 17 10.4% 40 482 473 8 438 8.1% 10.0% 410 5 11.0% 30 7.0% 397 11.0% 9.5% 2 362 20 336 5.0% 318 10 291 196 152 379 16% 348 0 0.0% 312 279 243 217 FY13 FY14 FY15 FY16 FY17 FY18 FY19 FY20 187 150 Capacity added % addition w.r.t. installed capacity 116 Key reasons for declining % capacity addition • Projects getting stuck due to delays in government approvals • Delays in corresponding transmission line projects • Delay in completion of power generation projects Central State Private Source(s): Central Electricity Authority, PGA Labs analysis © PGA Labs | 24 Power – Transmission – Sub - stations Competitor landscape: PGCIL has the highest installed sub - station capacity in India; State government owned companies own 57% of sub - station network Total ~ 968K MVA Capacity overview % by sub - station capacity (FY20) 379K MVA 550K MVA 39K MVA 100% Others 9% 90% Others 25% 80% Others 40% RVPNL 6% 70% MPTRANSCO 6% 60% KPTCL 7% Essel Infra TSTRANSCO 9% 10% 50% TANTRANSCO 9% Sterlite PGCIL 91% 40% Power 20% GETCO 10% 30% UPPTCL 13% Adani 20% Trans mission 10% MAHATRANSCO 17% 29% 0% Central State Private Central government companies State government companies CAGR over last 5 years Private companies (FY15 – 20) <10% 10 - 20% >20% <30% 30 - 50% >50% Confidence level ◑ ◑ <5% 5 - 10% >10% Source(s): Central Electricity Authority, Company websites, PGA Labs analysis © PGA Labs | 25 Low High ○◔◑◕● ○◔◑◕● Power – Transmission – Sub - stations Project status: State government owned companies have the highest number of WIP projects; delay in tendering and local agitation key issues impacting growth Stuck projects accounted for 9% of total projects Complete Stuck (K Key stuck projects Broad reasons for Company WIP (K MVA) completed or under construction in India d (K MVA) MVA) (length in K ckm ) project delays Transmission line length (K ckm) • Chandigarh UT 369.4 • Work yet to be 40.9 66.2 0.3 (GIS) s/s taken up (320 MVA) 80.1 Others (2) - 6.6 0.2 • Tembhurni ICT 5.4 6.0 7.0 • Not in STU Plan 237.7 (1169 MVA) 38.3 • Kadapperim • Work yet to be 2.9 26.4 5.7 (780 MVA) taken up 254.7 • Pipavav S/S 6.4 23.8 5.6 • Yet to do NIT (1000 MVA) 114.3 173.9 Others 23.6 117.7 7.1 40.9 (31) • Khandwa PS • Agitation from (KTL - TBCB) 17.5 72.8 0.6 4.3 4.0 farmers for land (3000 MVA) acquisition 0.8 34.6 8.0 25.5 0.6 8.6 • Dhanbad s/s • Waiting for NoC Centre State Private Total 0.2 - 1.0 (NKTL - TBCB) permissions (1000 MVA) Stuck WIP Complete Others (6) - 3.7 3.6 Stuck projects as a % of total projects 0.5% 11% 49% 9.4% Total 80 254 34 Source(s): Central Electricity Authority, PGA Labs analysis © PGA Labs | 26 Power – Transmission EPC company: KEC International has grown across sectors with Railways growing the fastest; trade receivables and payables in the range of 40 - 45% Revenue* EBITDA* PAT* Order book size* INR 110B INR 28.9B INR 4.9B INR 203.1B Order book size of KEC International has grown at 12.7% CCC has decreased from FY11 leading to decrease in WC CAGR over FY11 - 19; power accounts for 70% of order book requirement; DRO is consistent but DPO has increased CAGR Revenue (INR B) Order book composition for KEC International Trade receivables as % of revenue (%) FY11 - 19 Trade payables as % of cost (%) 203.1 12.7% (INR B) 61% 7.1 17.9% 120 110 60% 48% 57% 45% 53.0 38.6% 100 51% 46% 87.5 44% 50% 126.3 84.7 41% 80 69.8 1.3 40% 94.7 95.1 37% 15.2 37% 60 78.0 1.0 30% 2.8 43.2 5.7 5.9 1.9 143.0 3.9 8.9% 40 20% 109.9 88.4 86.0 20 72.2 10% 0 0% FY11 FY13 FY15 FY17 FY19 FY11 FY13 FY15 FY17 FY19 Power Railways Others Revenue Trade receivables as % of revenue Trade payables as % of cost % share in order book High DPO FY11 FY13 FY15 FY17 FY19 indicates FY11 FY13 FY15 FY17 FY19 DPO substantial 122 160 184 130 214 delay in Power 93% 91% 93% 87% 70% DRO 193 141 165 185 164 vendor payments Railwa 5% 6% 6% 12% 26% DIO 33 28 27 23 29 y CCC 105 10 8 78 - 21 Others 2% 3% 1% 1% 4% Note(s): * represents values for FY19; Revenue refers to operating revenue Source(s): Annual reports, PGA Labs analysis © PGA Labs | 27 Power – Transmission COVID impact: COVID - 19 is expected to impact the RM and labor supply in short - term, along with a medium to long term impact on cash flow for capex Supply side factors Demand side factors Payment terms and Payment terms and Transmission line RM and equipment Labor Availability of finance costing pricing capacity • No restriction on • No restriction of • No major impact as • ECBs reduced due to • No major impact as • Demand availability of raw availability of labor there was limited exchange rate electricity increased in long - materials and for construction impact on fluctuations. consumption did not term as power Overall ● ● ● ● ● ● equipment construction activity • Benchmark PLR decline consumption Transmission companies sign long - and electricity increased from started increasing term TSA with DISCOMs which consumption 13.25% to 14% specifies tariffs as per line availability • EPC company: • EPC company: • EPC company: AP to • EPC company – WC • EPC company: AR • No short - term Limited Labor starts increase as vendor loans for ongoing to increase. Price transmission line availability of RM joining back in payments delayed. projects to be not impacted capacity increase Short - due to disruption month 2 and 3. RM and equipment unaffected • Asset owners: due to overall term E quipment Contract labor costs to decline due • Asset owners: Short - Moratorium on decline in ● ● ● ● ● ● imports from might not be to demand reduction. term increase in PLR. payment for electricity (1 to 3 China to be hit. available. • Asset owners: AP to Govt. projects (PFC - DISCOMs will consumption months) • Asset owners: • Asset owners: increase as AR funded) to be less increase AR. No impact on Labor remains increases. Cost to affected. Pricing will remain maintenance available remain unimpacted unchanged • EPC company: • EPC company: • EPC company: AP to • EPC company – No • EPC company: AR • No major Resumption of More than 80% start declining but impact on WC loans for declines as transmission line RM supply laborers join payments to remain ongoing projects payments resume capacity increase Medium - • Equipment import back. Contract delayed. Cost of RM / • Asset owners: • Asset owners: AR as new power term (4 to remain labor starts equipment remain Cautious funding by reduces as projects still stuck ● ● ● ● ● ● to 8 disrupted. returning to low as suppliers banks to private sector. DISCOMs resume due to capex • Asset owners: Asset owners: liquidate inventory PLR might decline if payments. No effect availability issues. months) No impact on Labor remains • Asset owners: AP to govt. injects liquidity. on pricing. maintenance available start declining • EPC company: • EPC company: • EPC company: AP • EPC company – No • EPC company: AR • Demand to Construction Full labor joins and cost back to pre - impact on WC loans for return to pre - COVID increase in long - Long - activity back to back COVID levels ongoing projects level. term as new RE term (9 pre - COVID level • Asset owners: • Asset owners: AP to • Asset owners: • Asset owners: AR projects ● ● ● ● ● ● to 12 • Asset owners: Labor remains return to pre - COVID Cautious funding by return to pre - COVID operationalize and RM / equipment available level banks. PLR back to pre - levels. require power months) available COVID level evacuation. Source(s): PGA Labs analysis © PGA Labs | 28 Increasing negative impact Increasing positive impact ● ● ● ● ● Power Future outlook: Power sector is expected to face delays in high - ticket projects; RE and transmission sector to lead sector recovery Expected investment Expected annual growth Capacity (FY19) Expected industry recovery pattern source: Public sector Rate (FY19 - 24) 8 - 10% 356 GW, 425 ckm Highly positive Generation Transmission EPC Positive Market Pre - COVID Oligopoly Oligopoly Oligopoly structure levels Time period Players Negative Highly negative AMJ 20 JAS 20 OND 20 JFM 21 • Decline in • Obligations • Regulatory shift M andating electricity by DISCOMs increased procurement of RE COVID19 ◕ ◕ ◑ ◑ ◕ ◕ consumption DISCOMs power for DISCOMs to impact impact Halt on refraining power demand for thermal industrial and from buying plants • Higher government • Higher government • Delay in high - ticket Industry commercial complete intervention short - term intervention short - term projects Pushback in outlook activities elec. quota fiscal measures fiscal measures timelines of high - ticket resulting in projects • Revenue security • Re - look at capex plans legal issues Increased focus on long - Fresh assessment of big - • Increase in RE projects • Project • Disruption in • Government projects lead term PPAs ticket projects due to Increased commissioning of finance coal supply sectoral recovery expected delays in power RE projects • Re - look at capex plans Increased to private plant commissioning Fresh assessment of • Transmission projects scrutiny for producers if upcoming projects Evacuation of power from private they default new RE plants to grid • Acceleration in RE growth projects on payments Slowdown in thermal • Equipment sector to provide boost supply Source(s): PGA Labs analysis © PGA Labs | 29 Low High ○◔◑◕● ○◔◑◕●