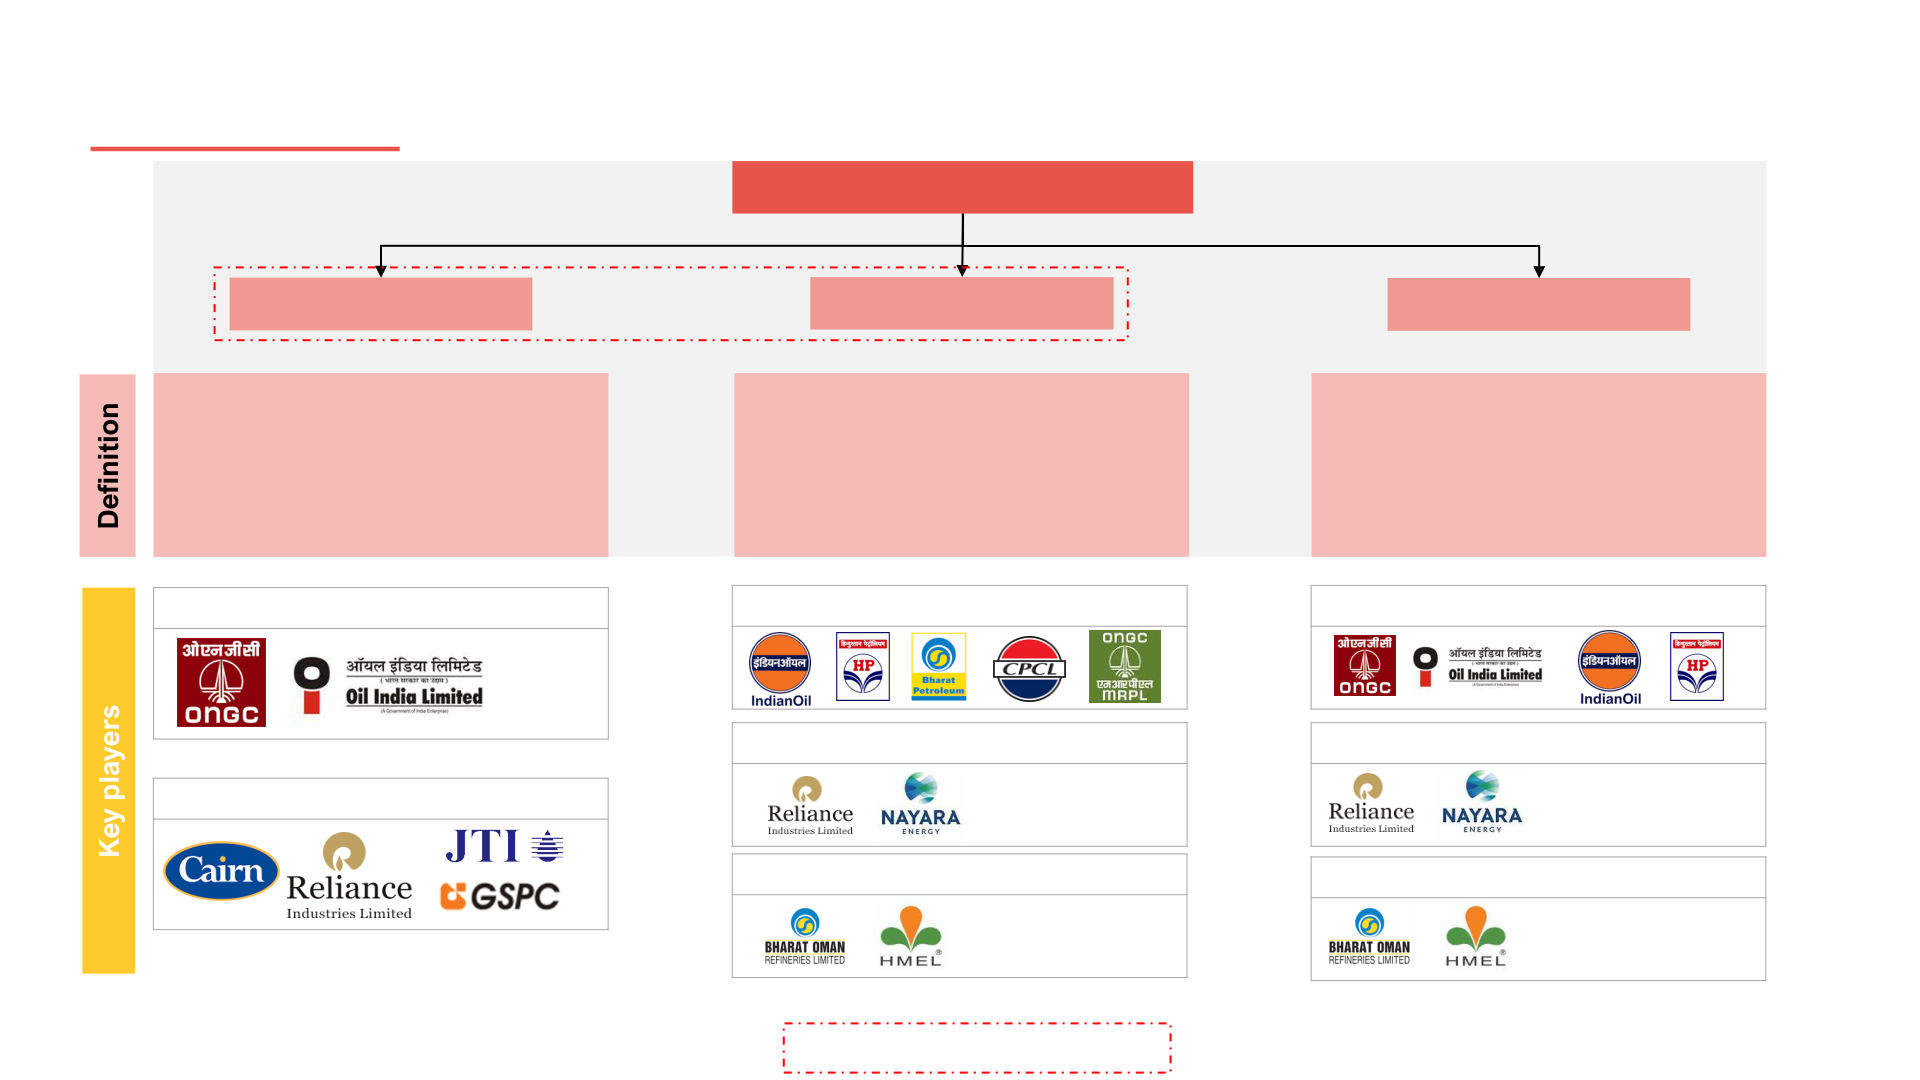
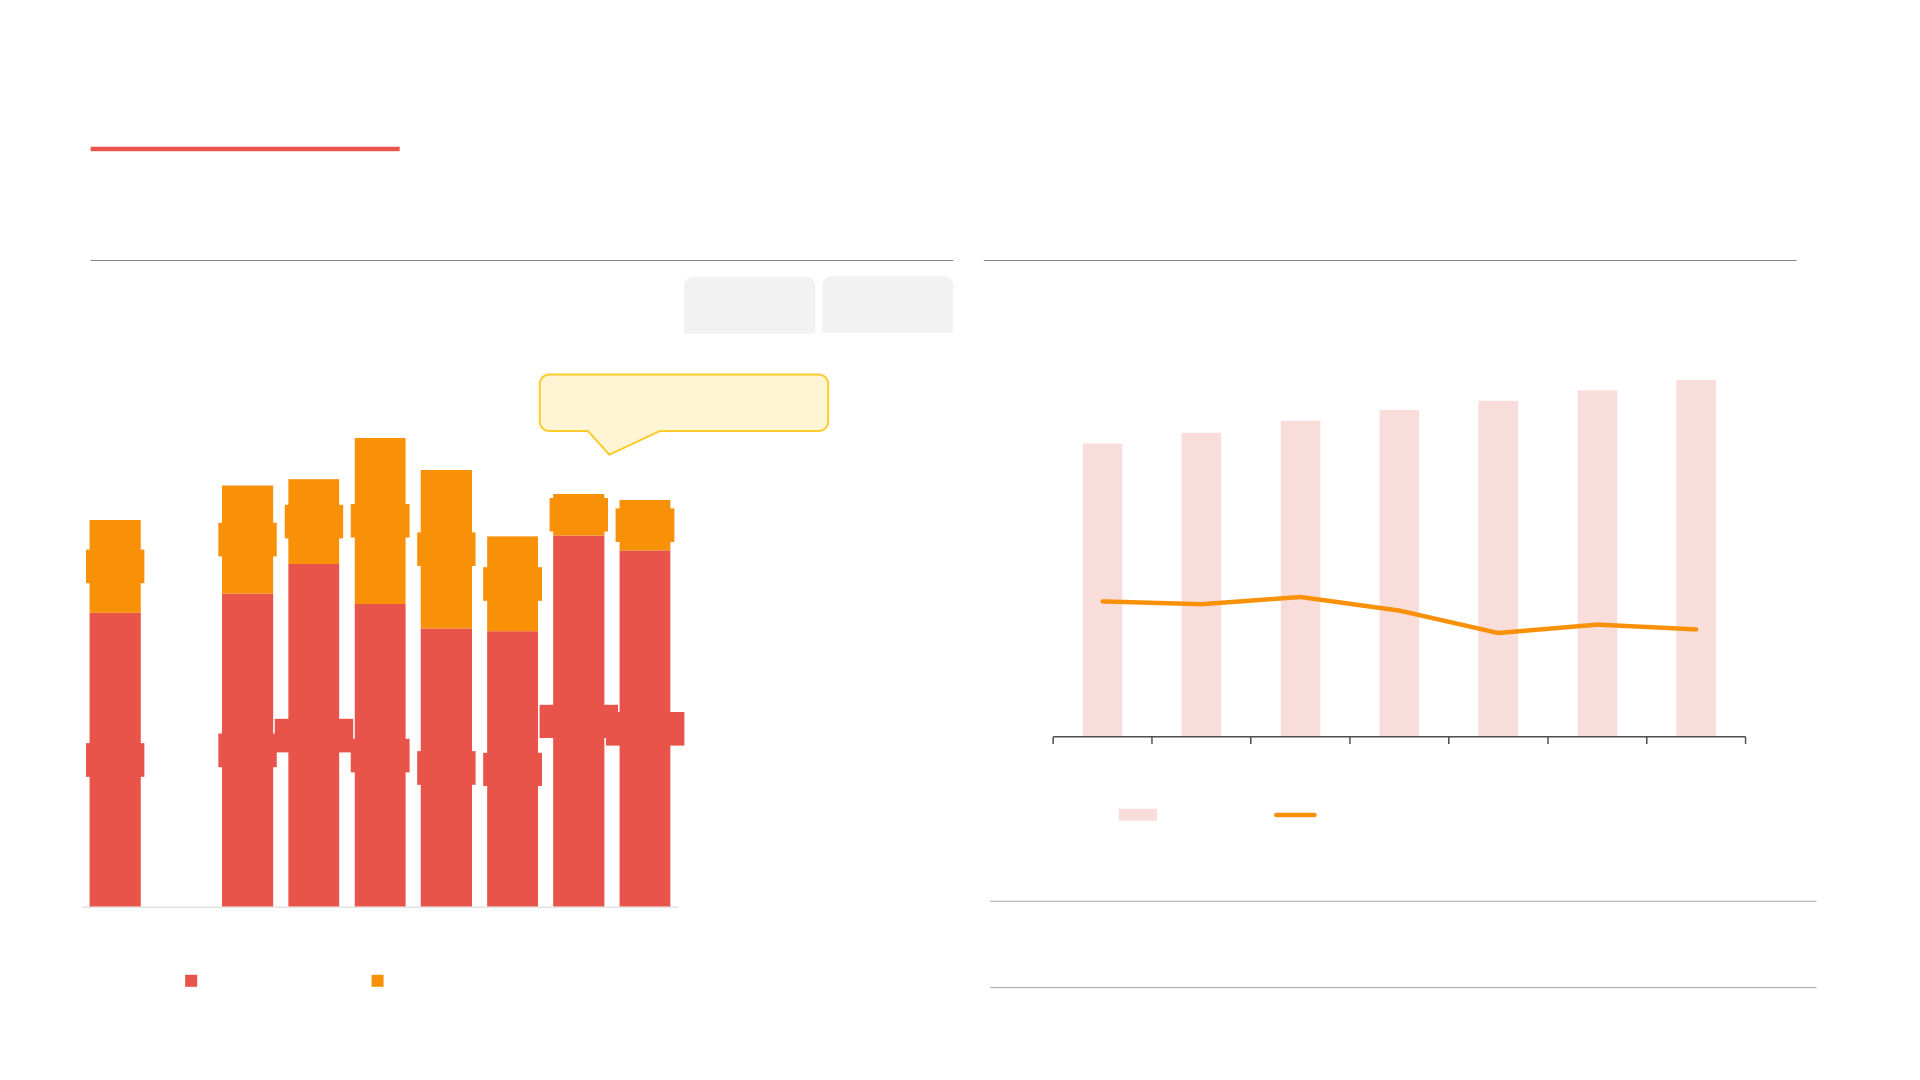
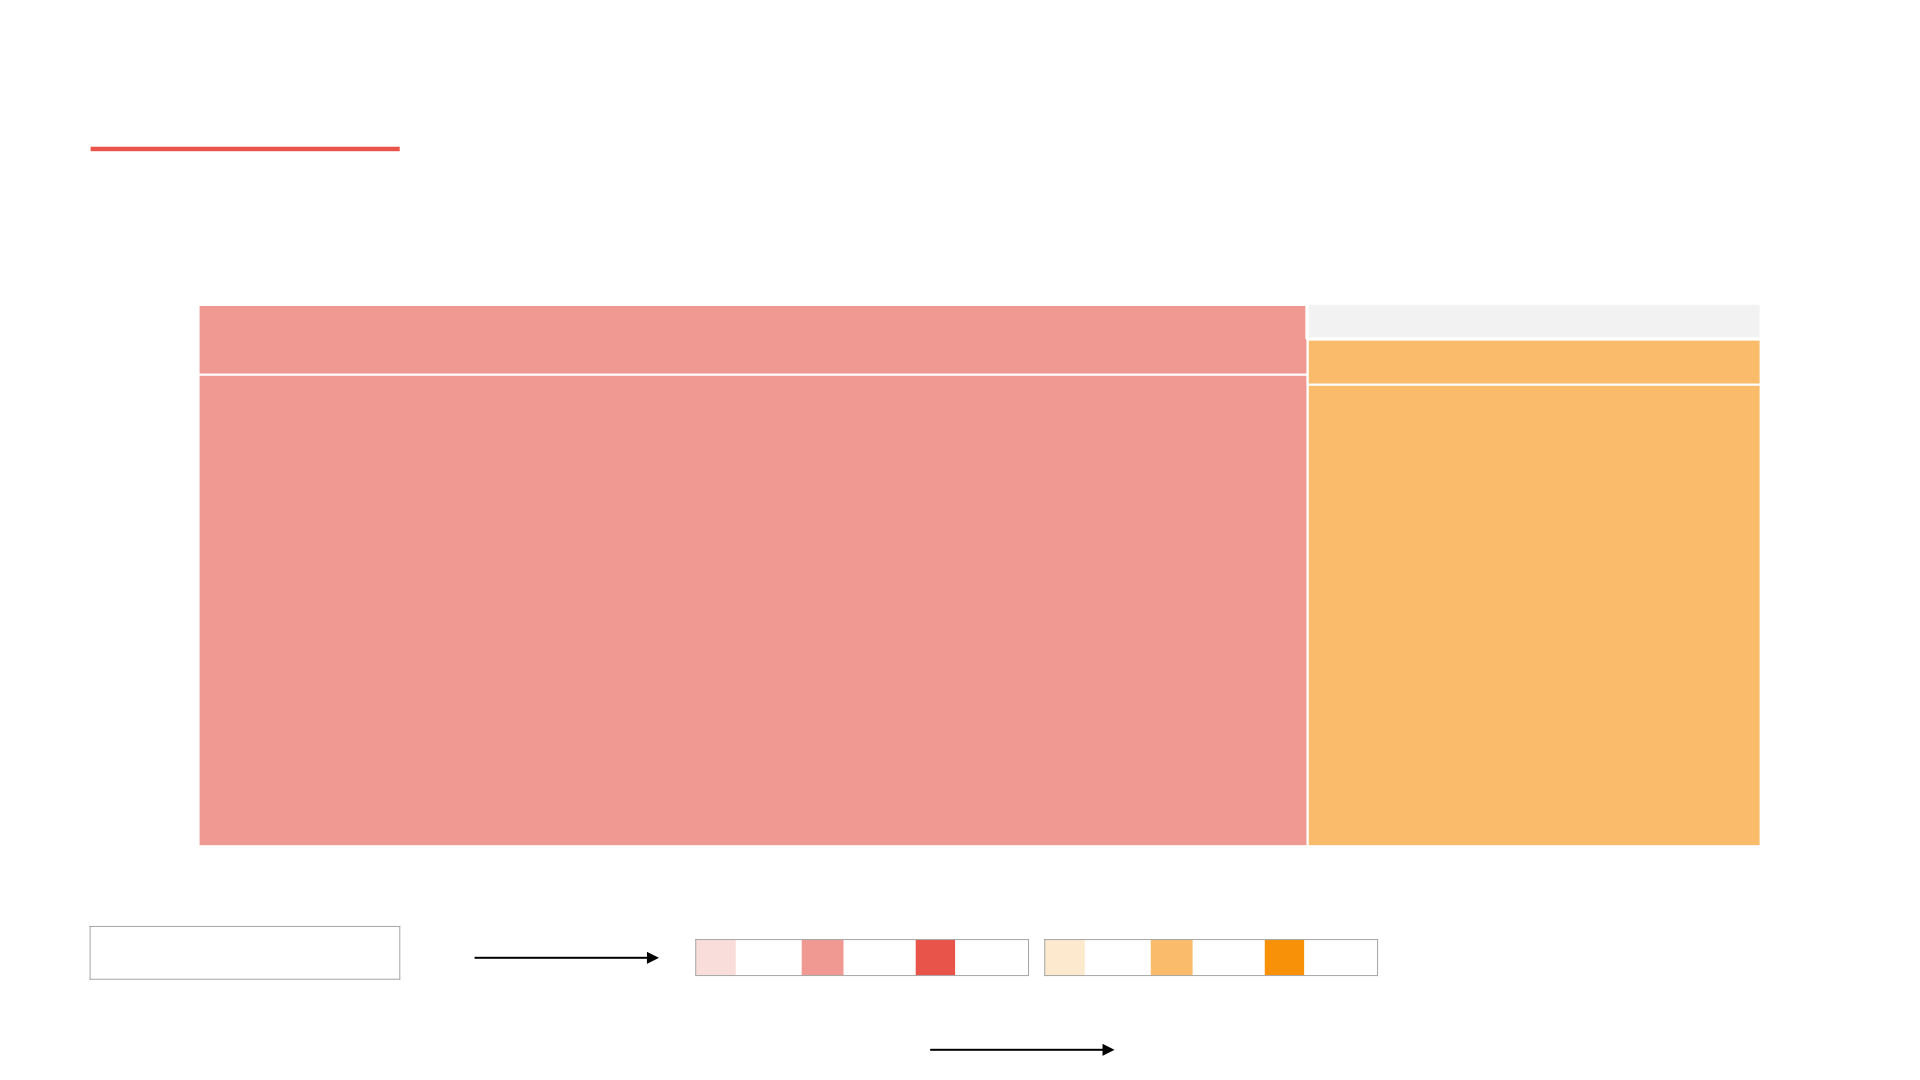
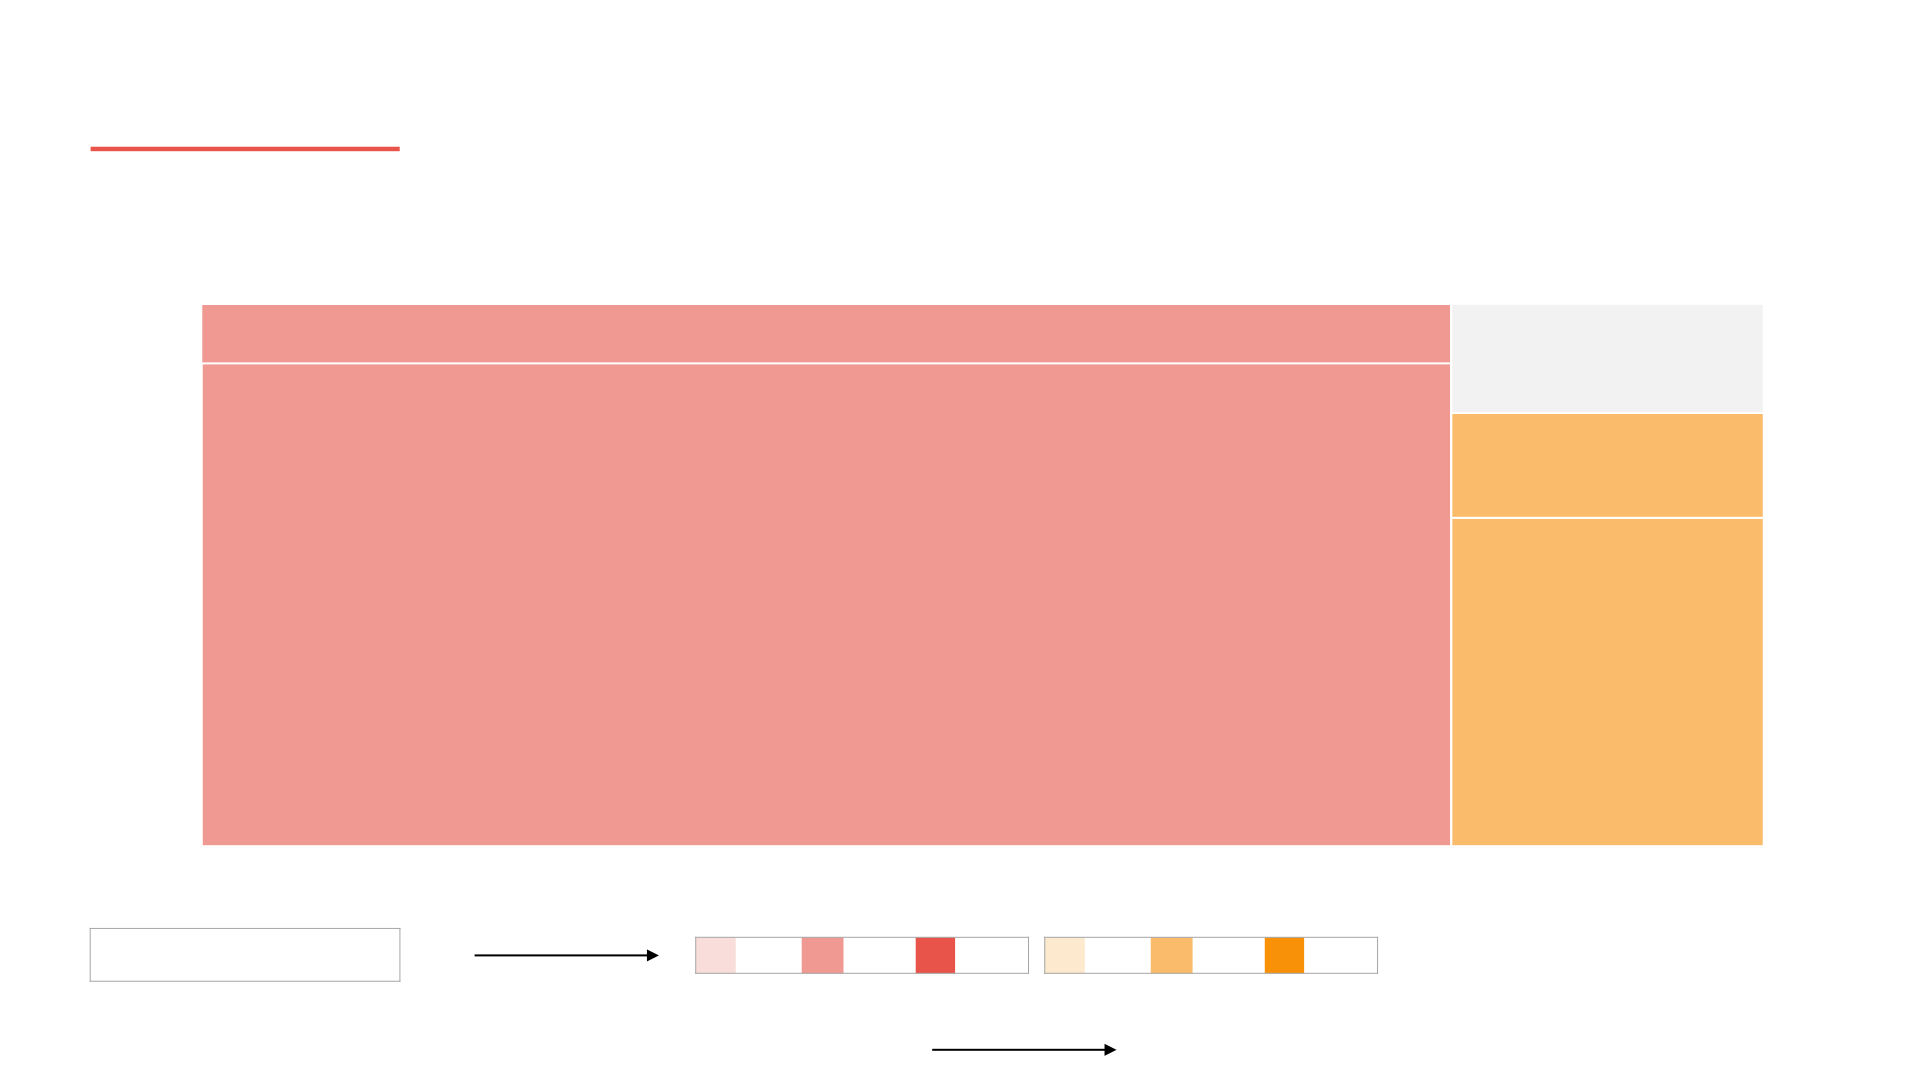
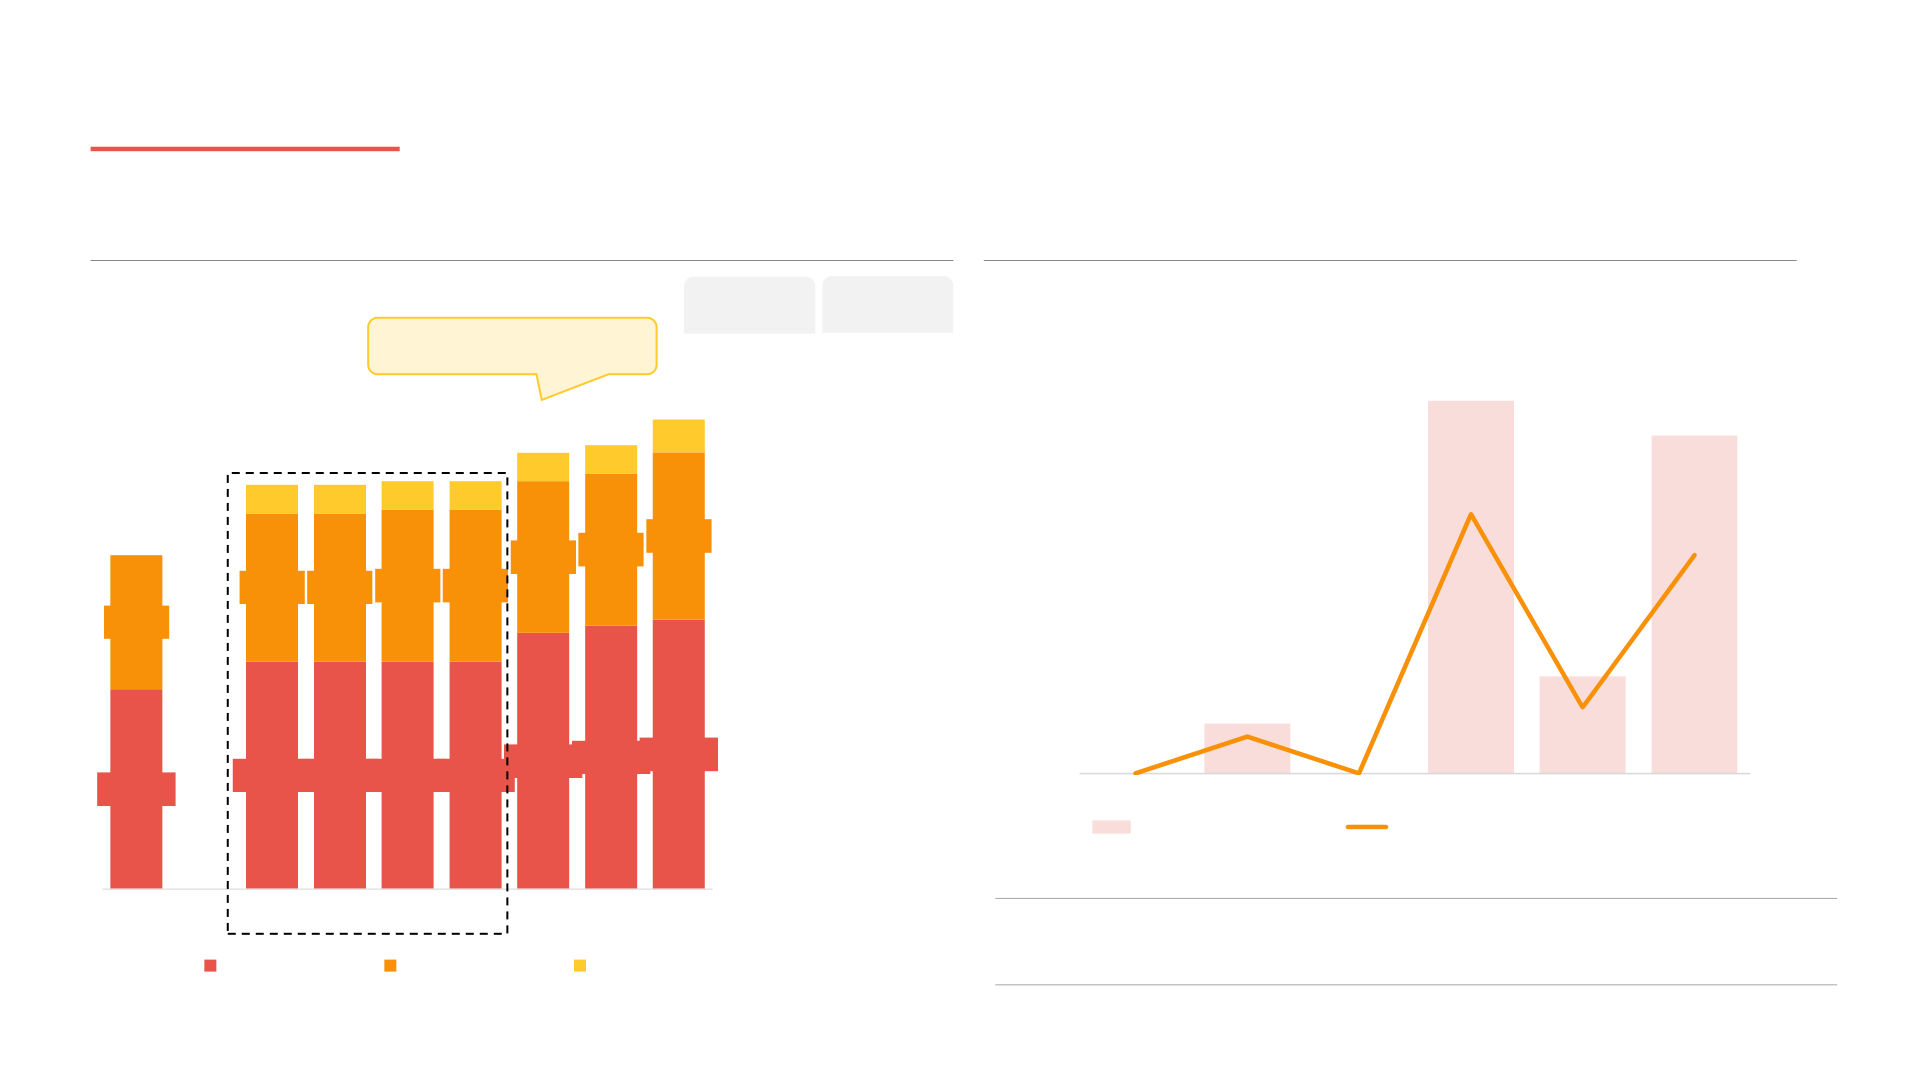
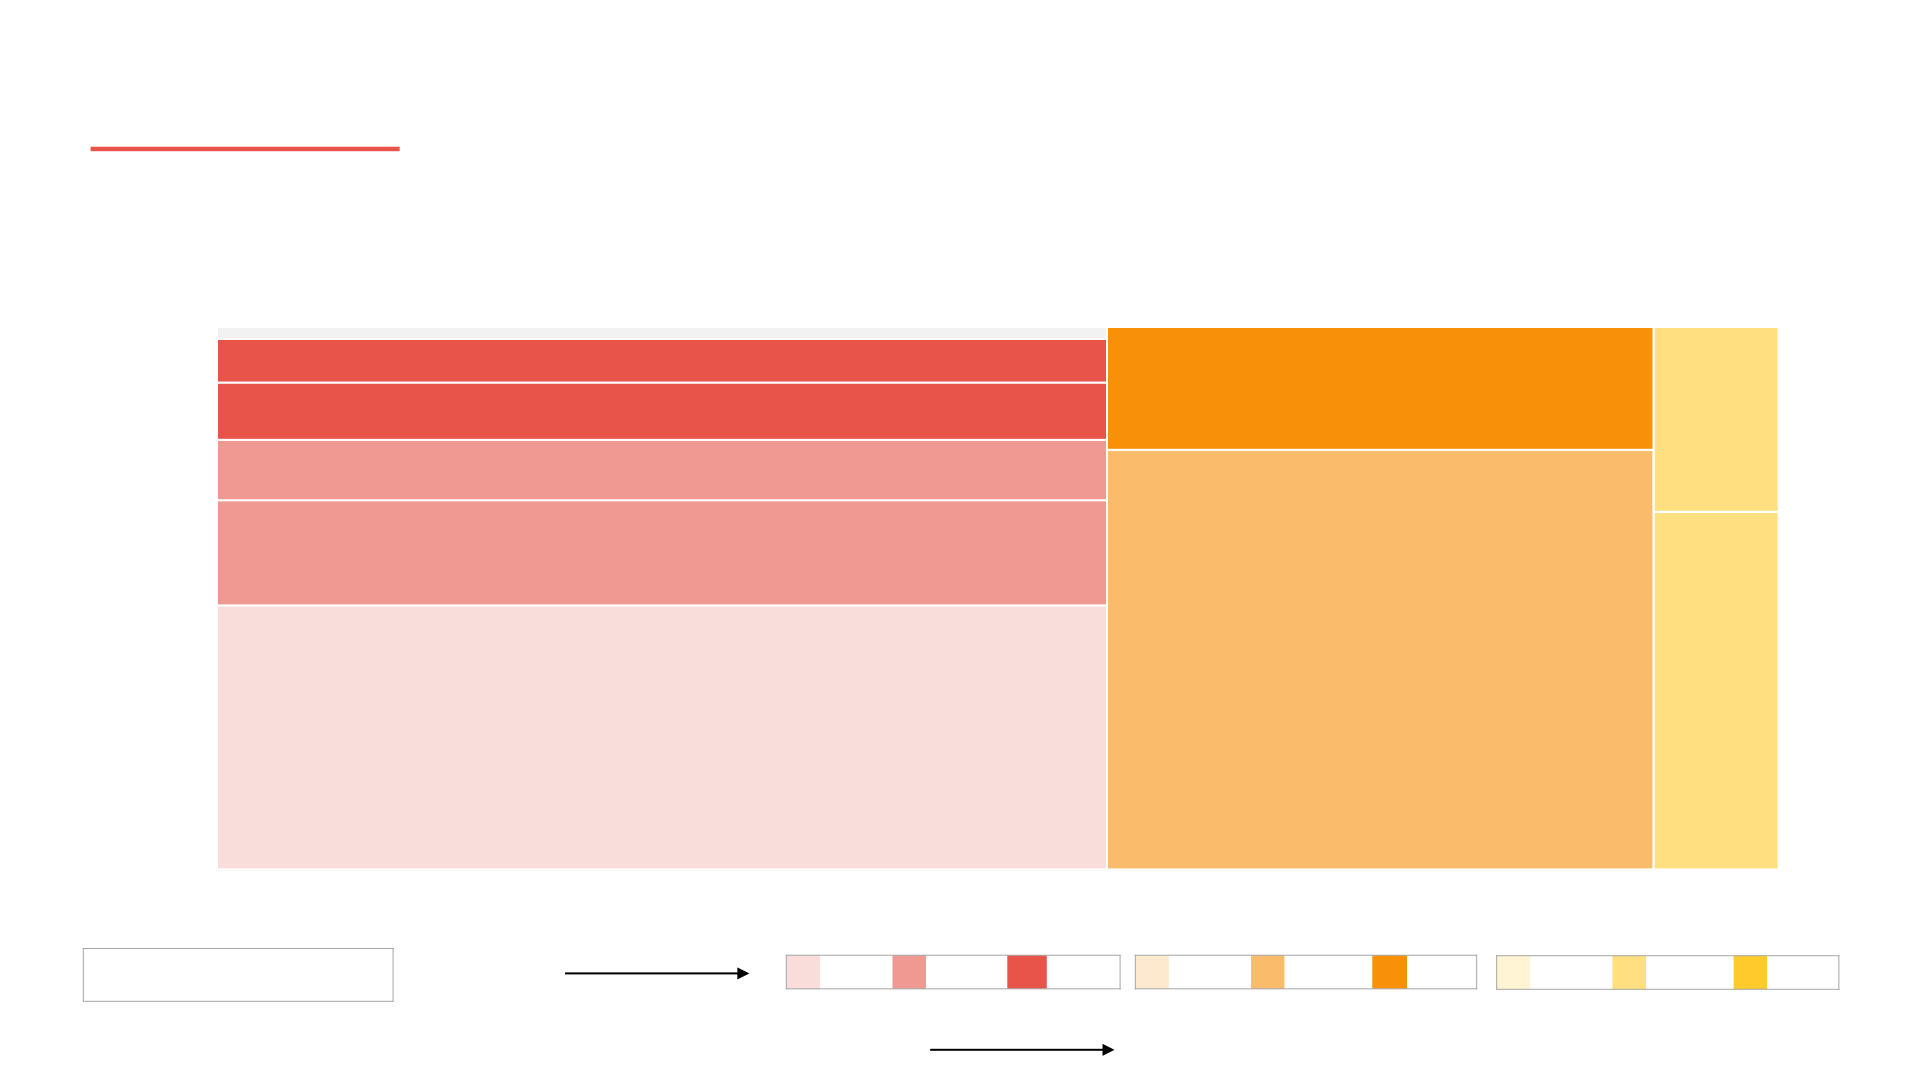
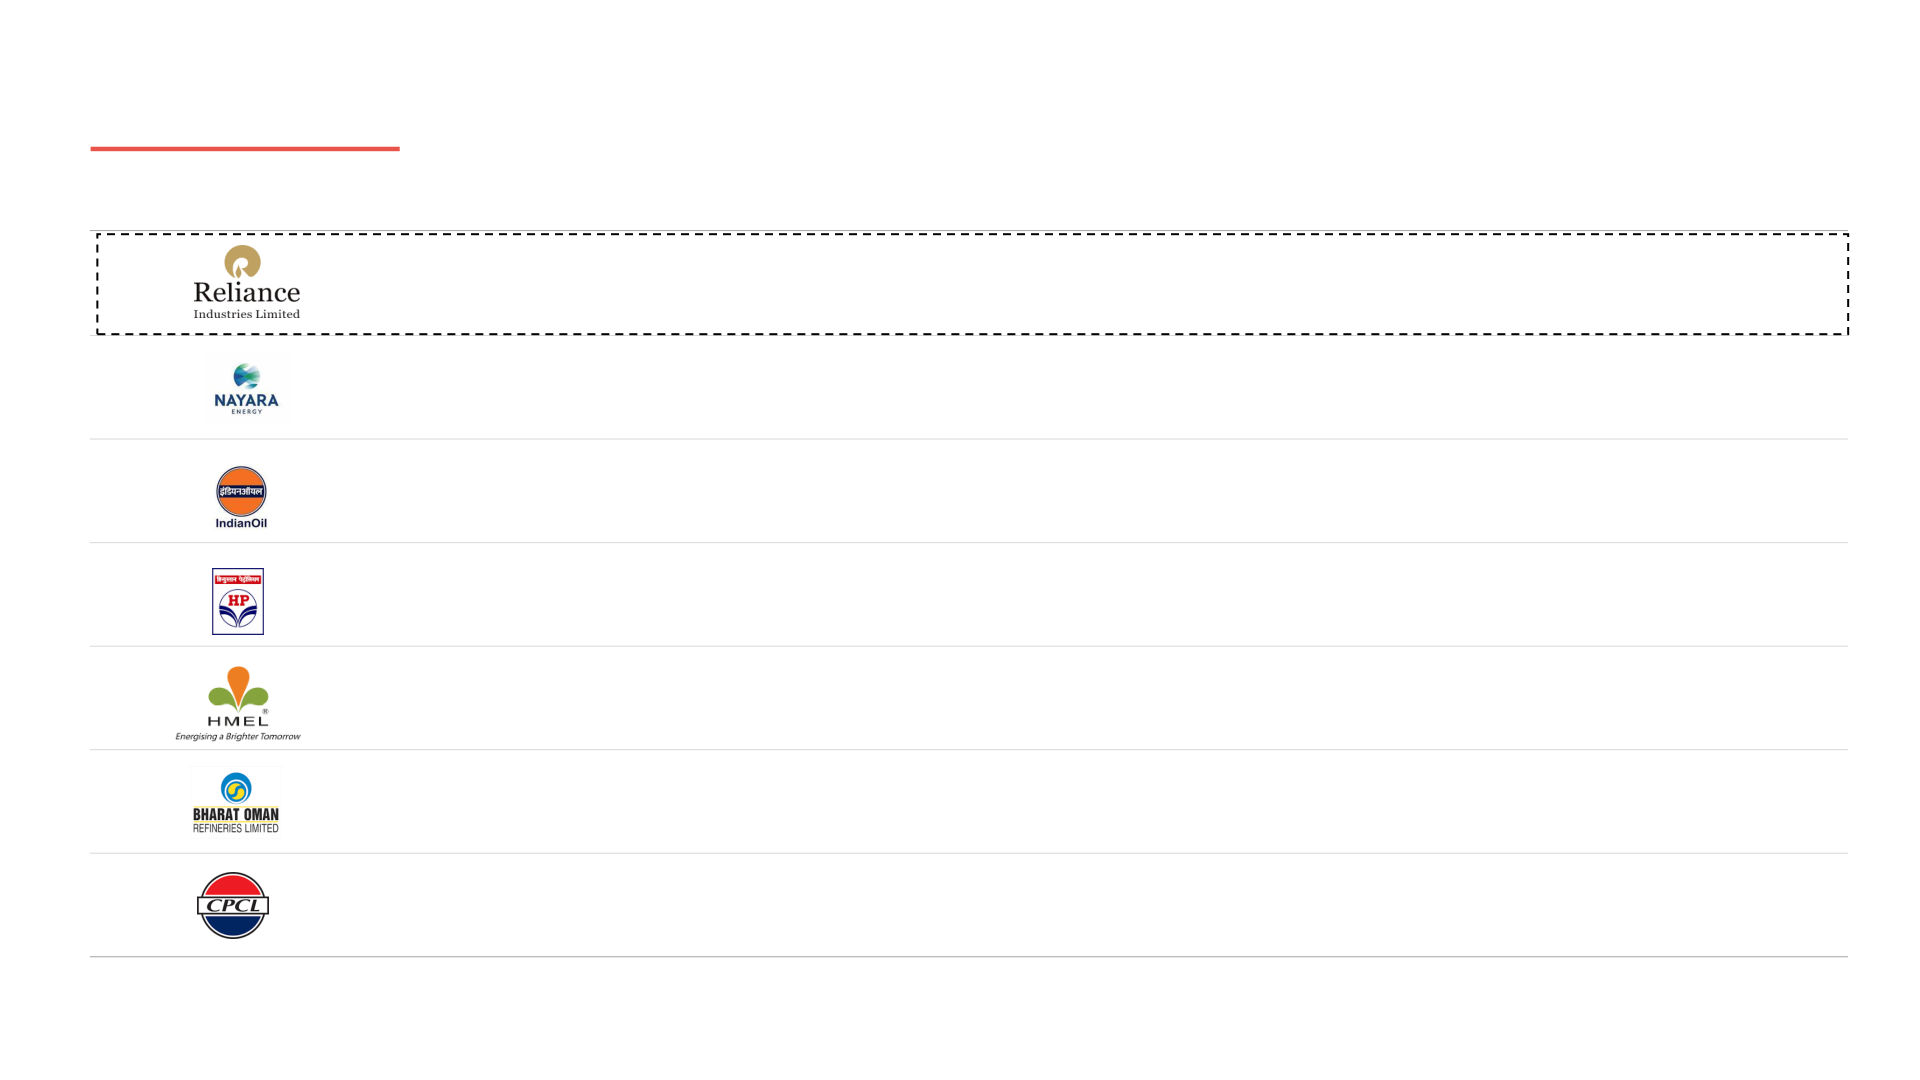
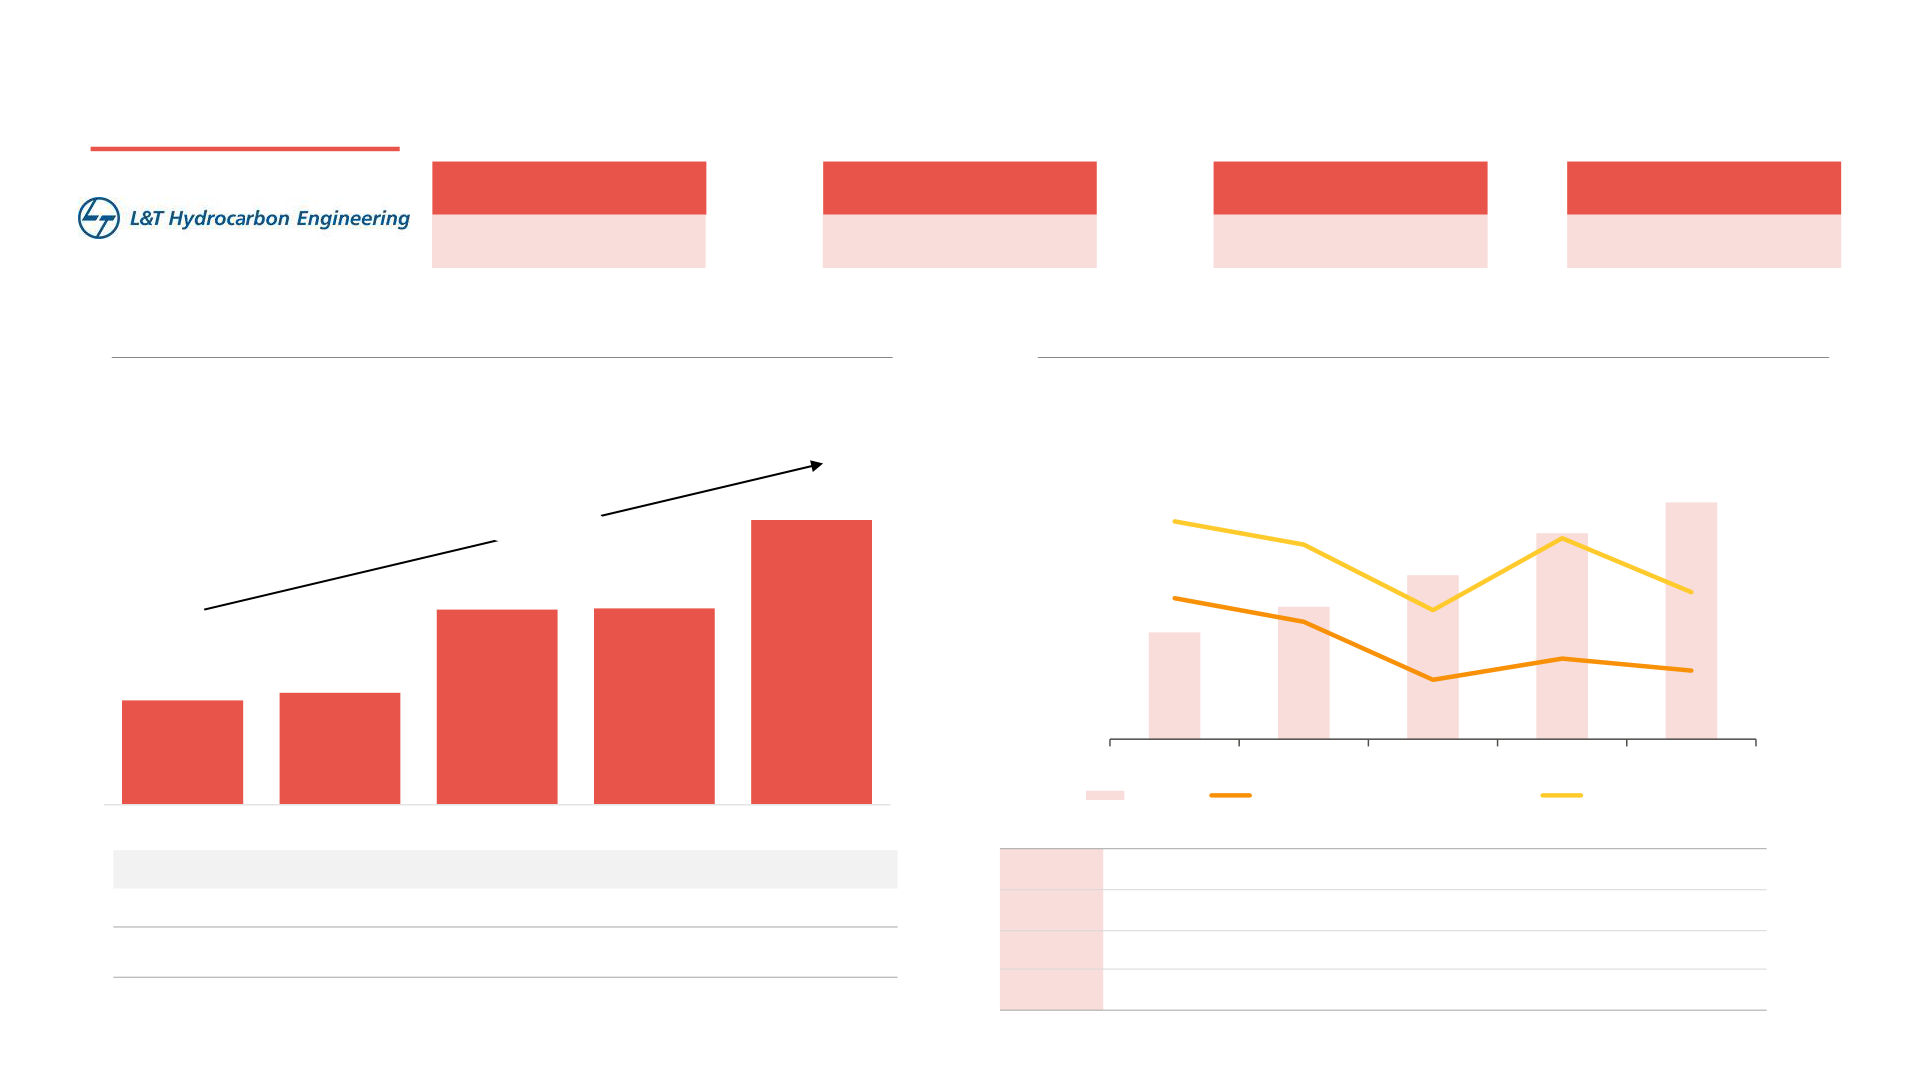
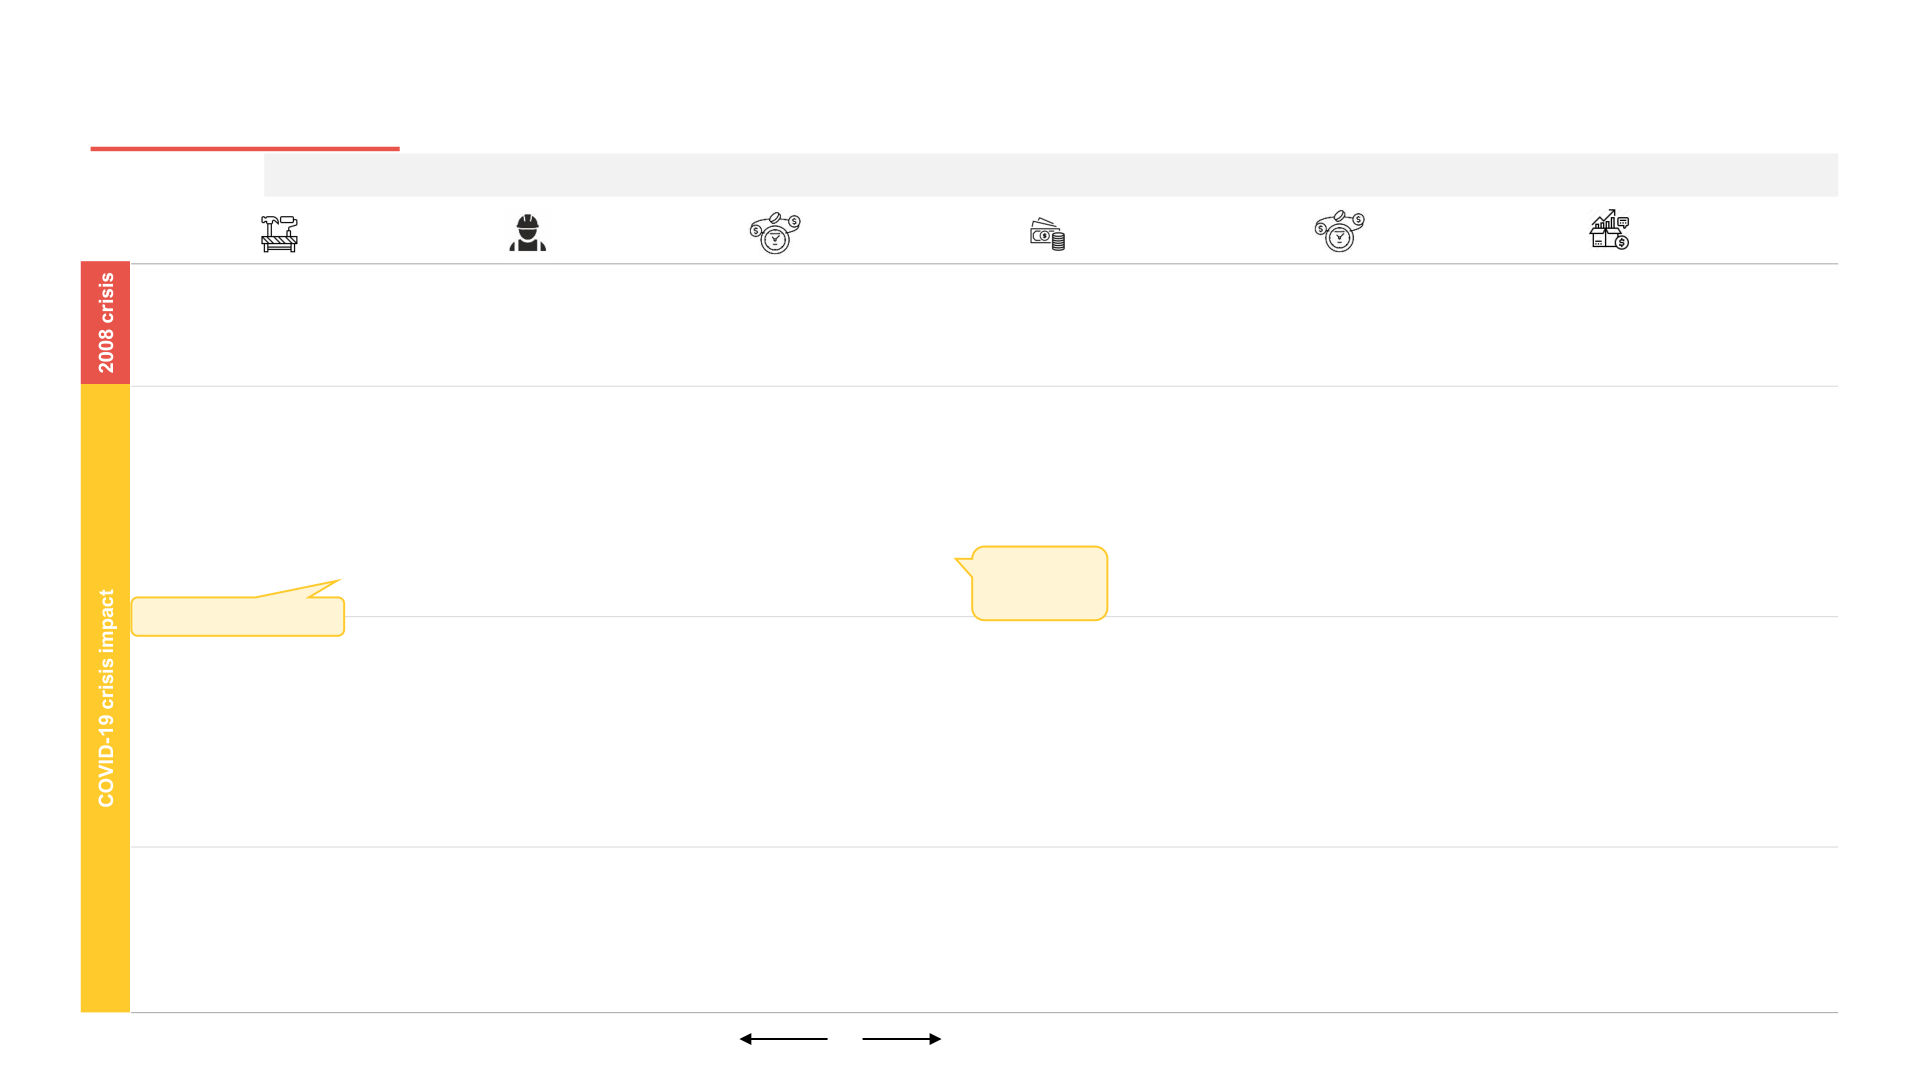
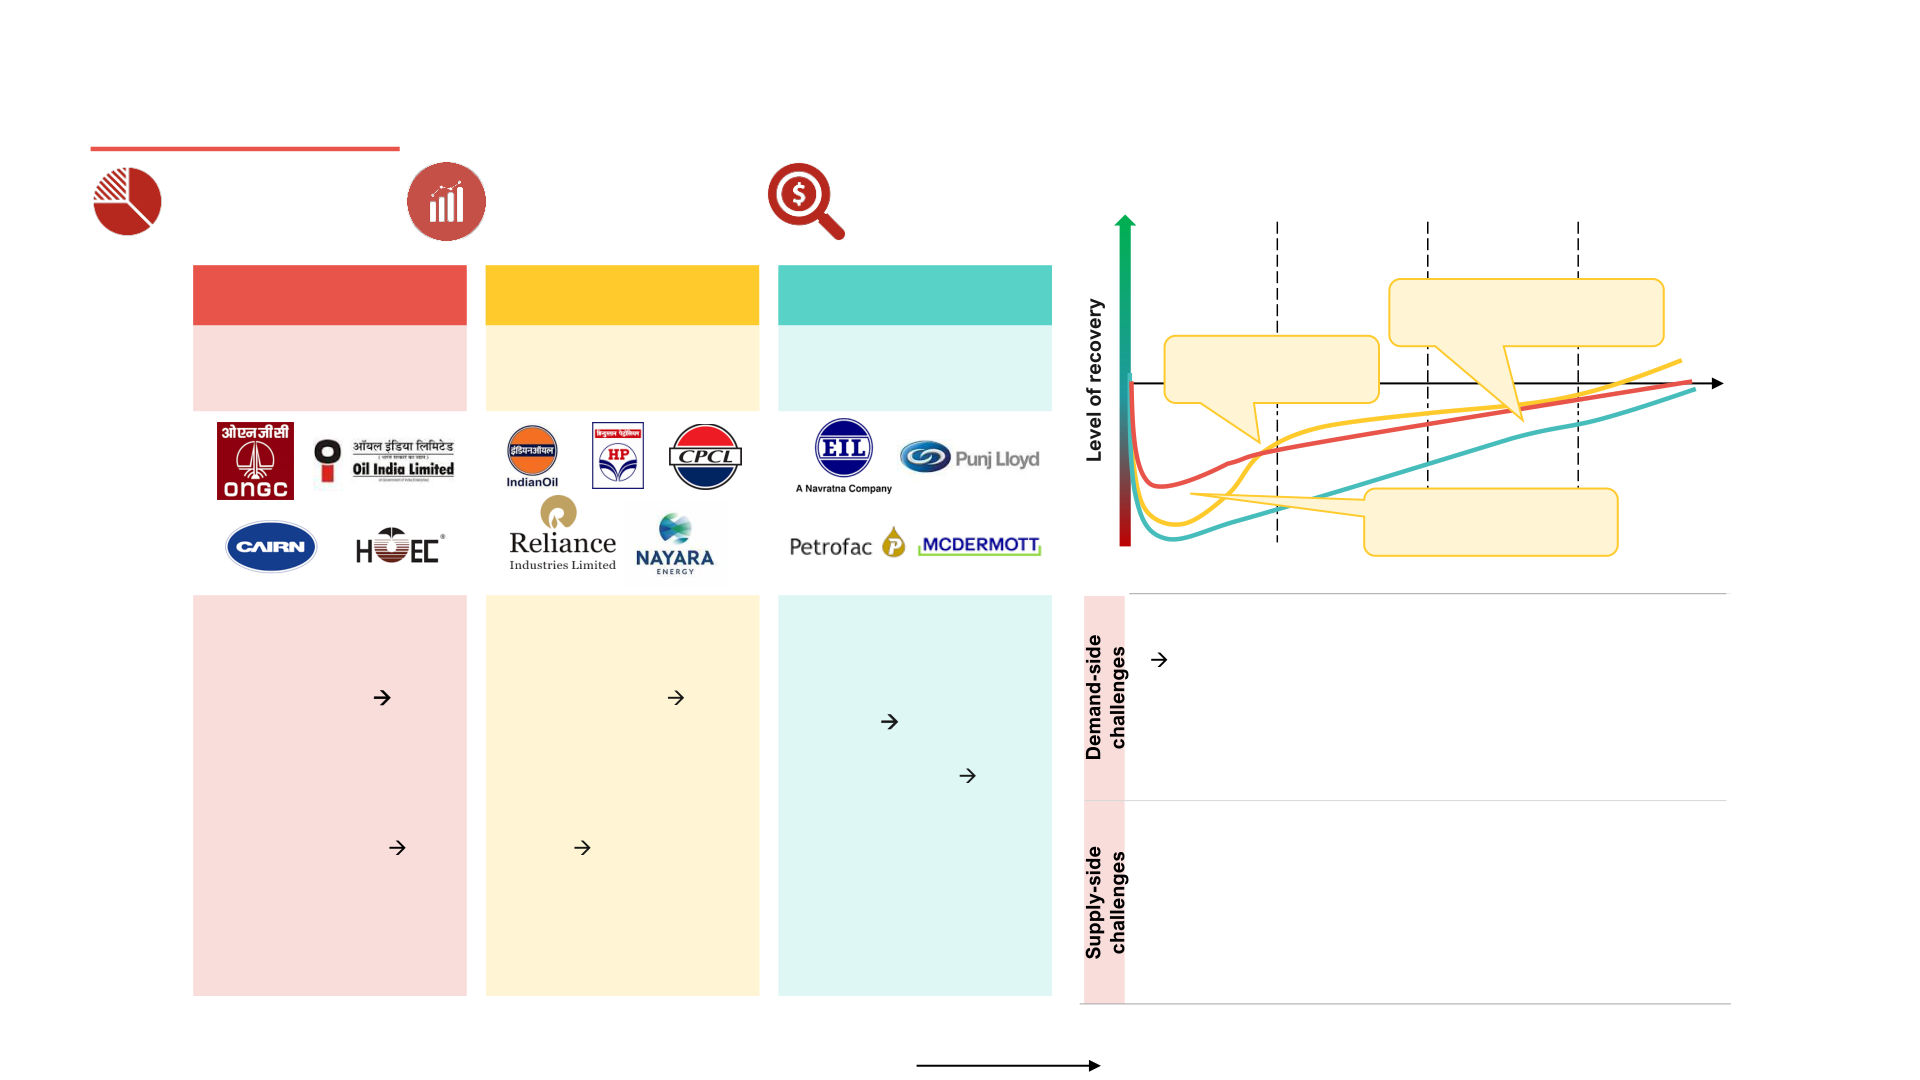
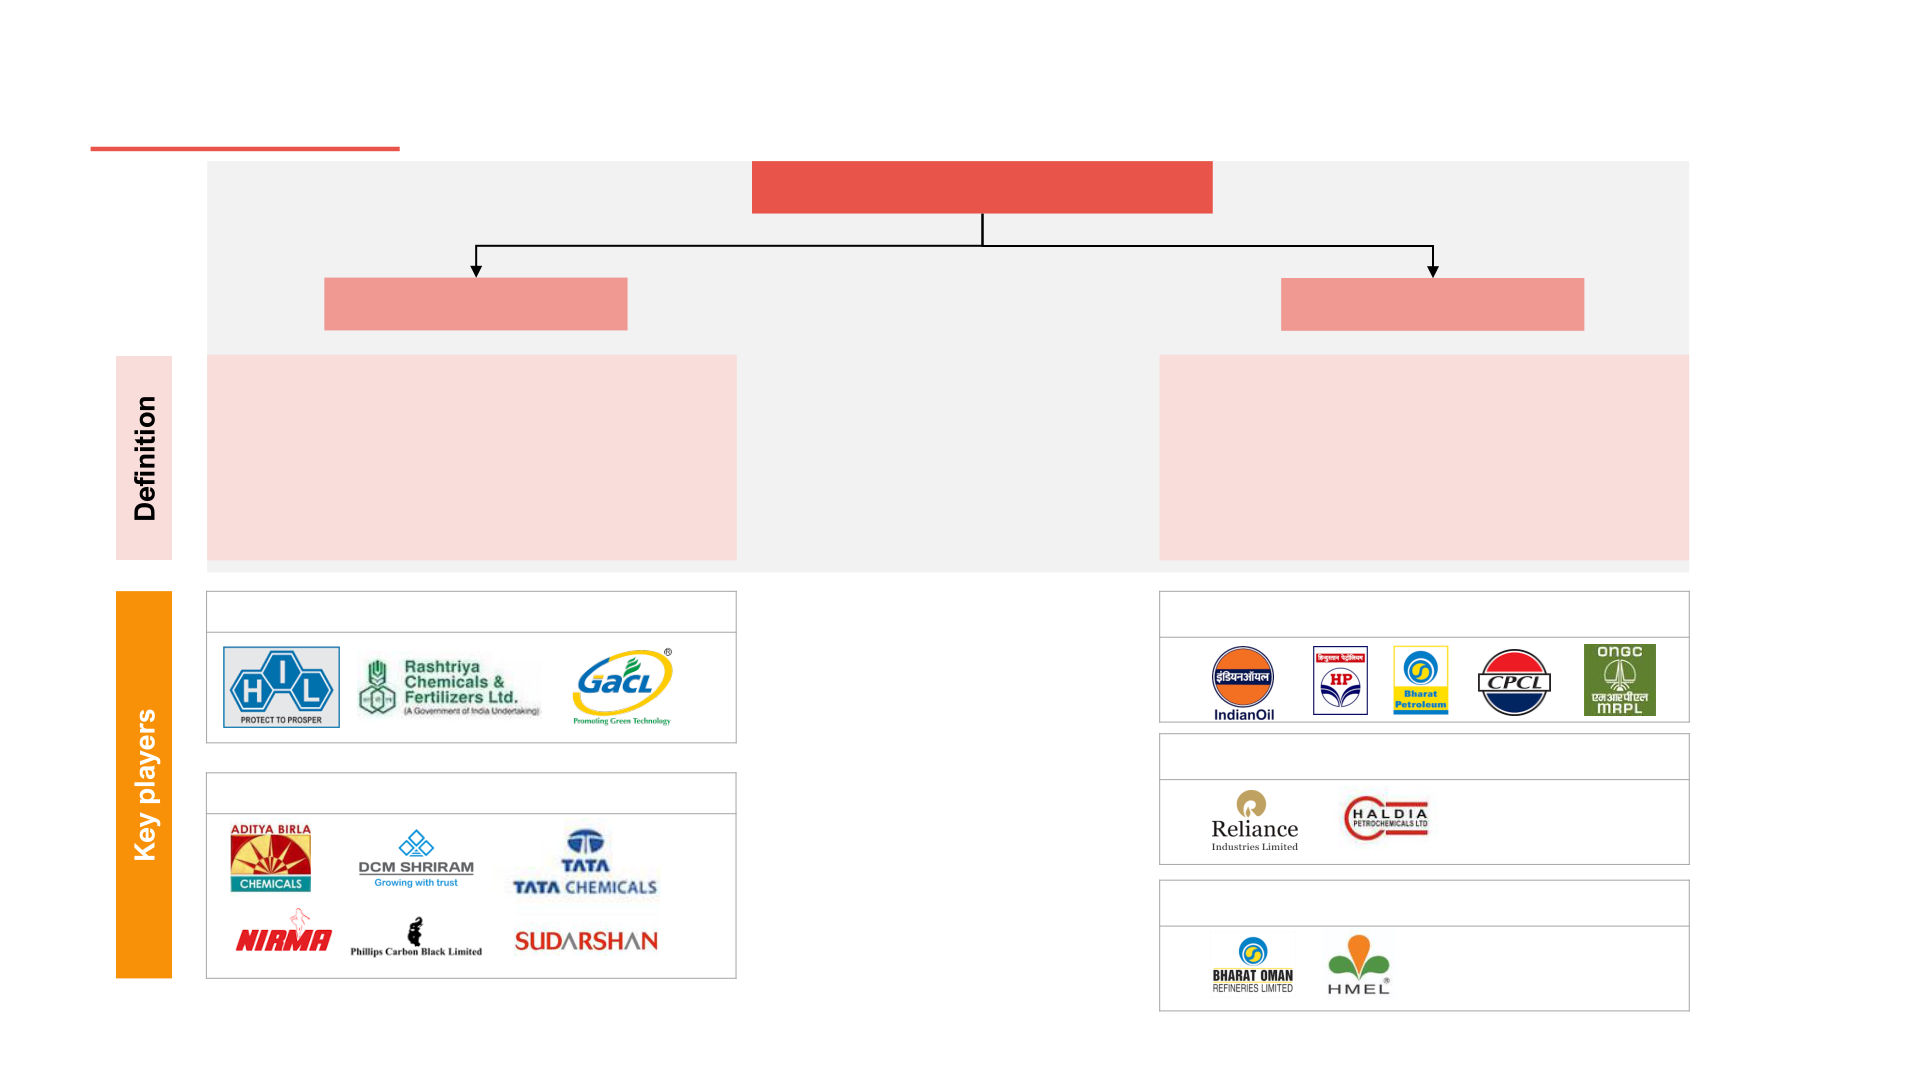
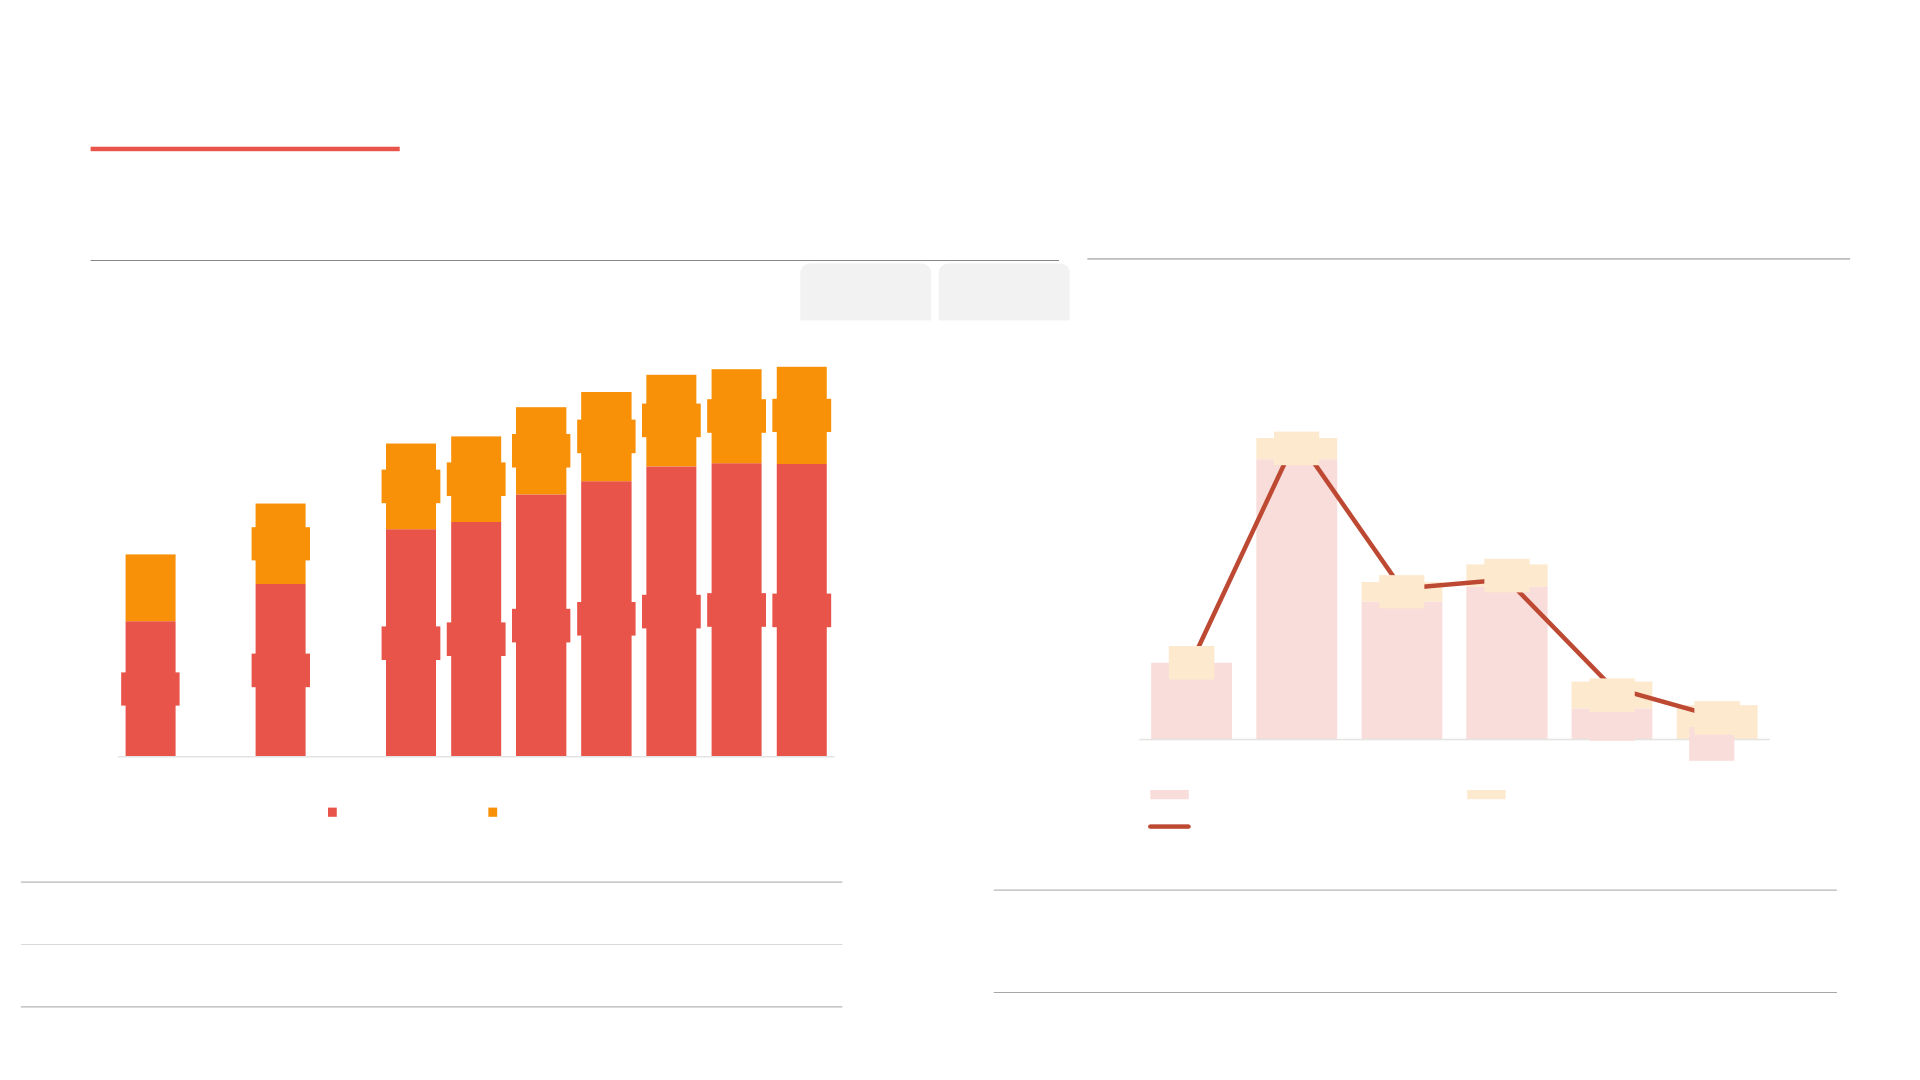
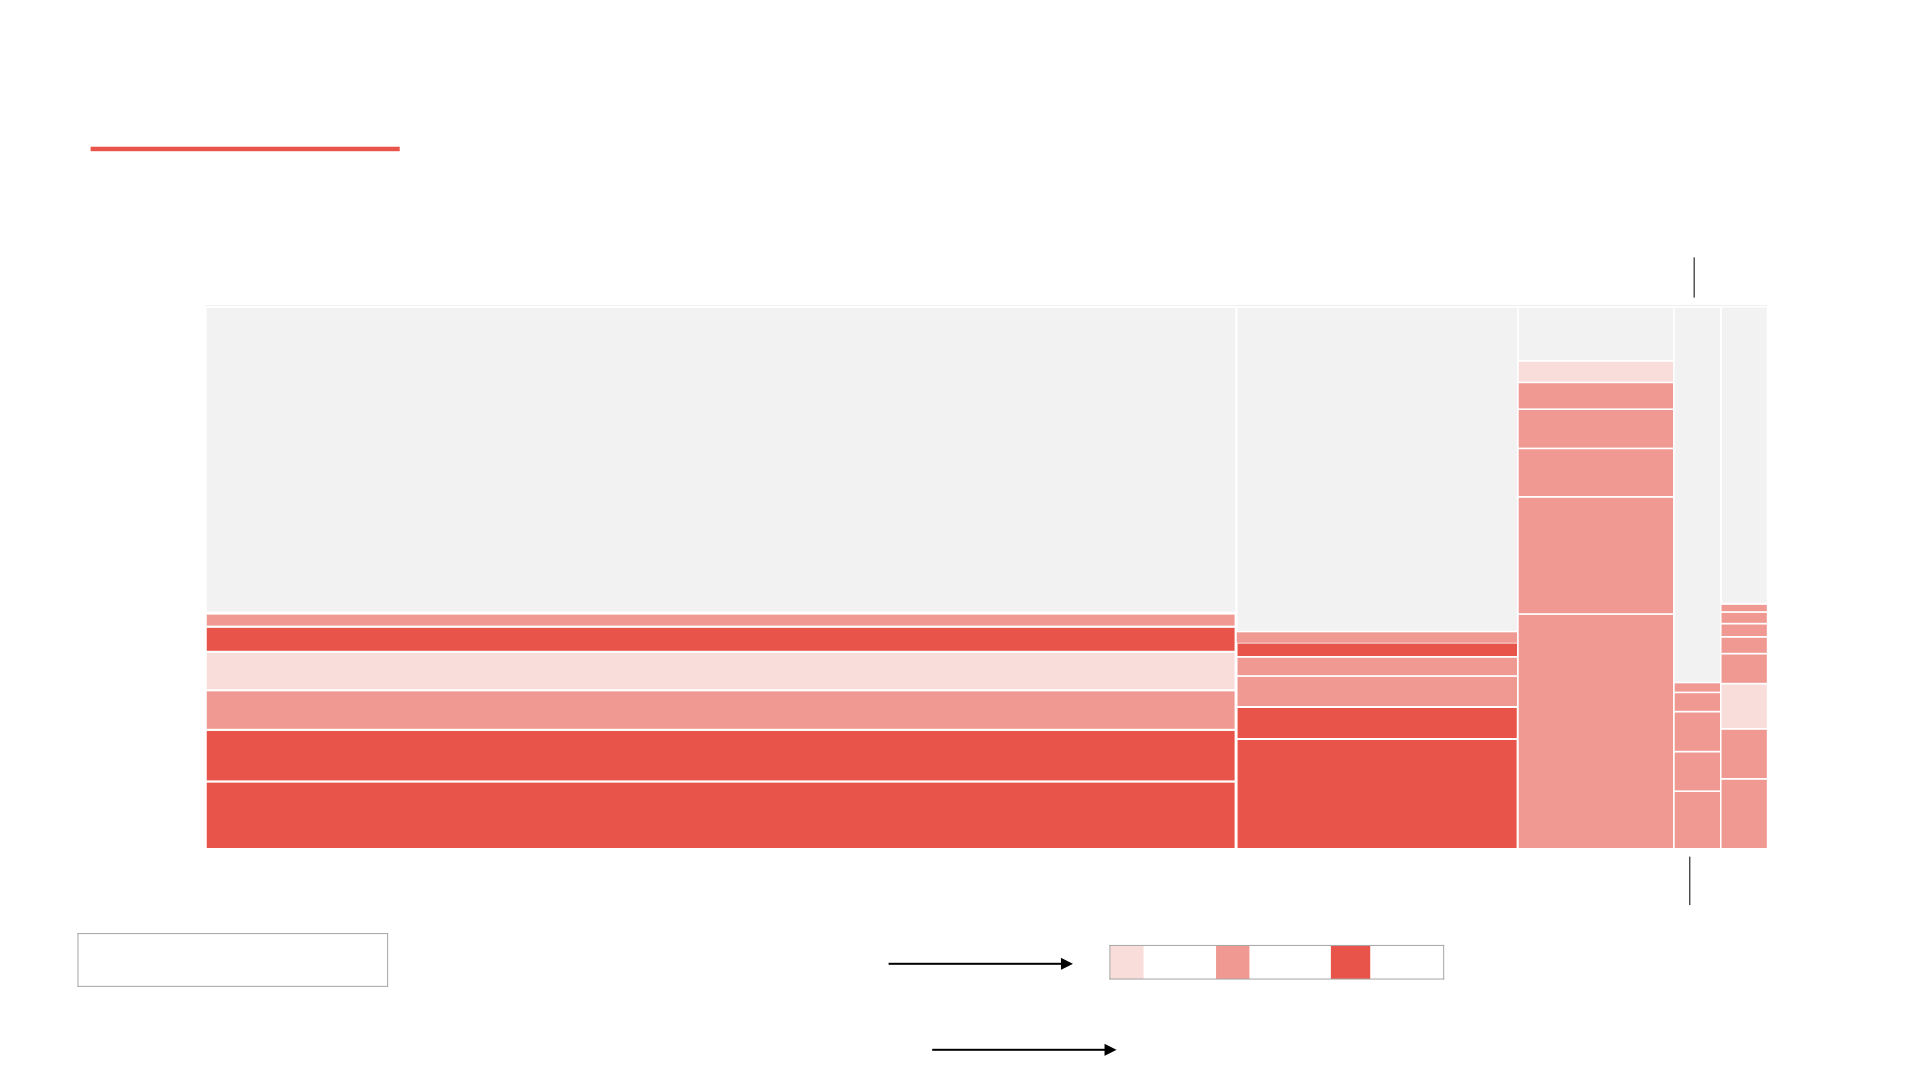
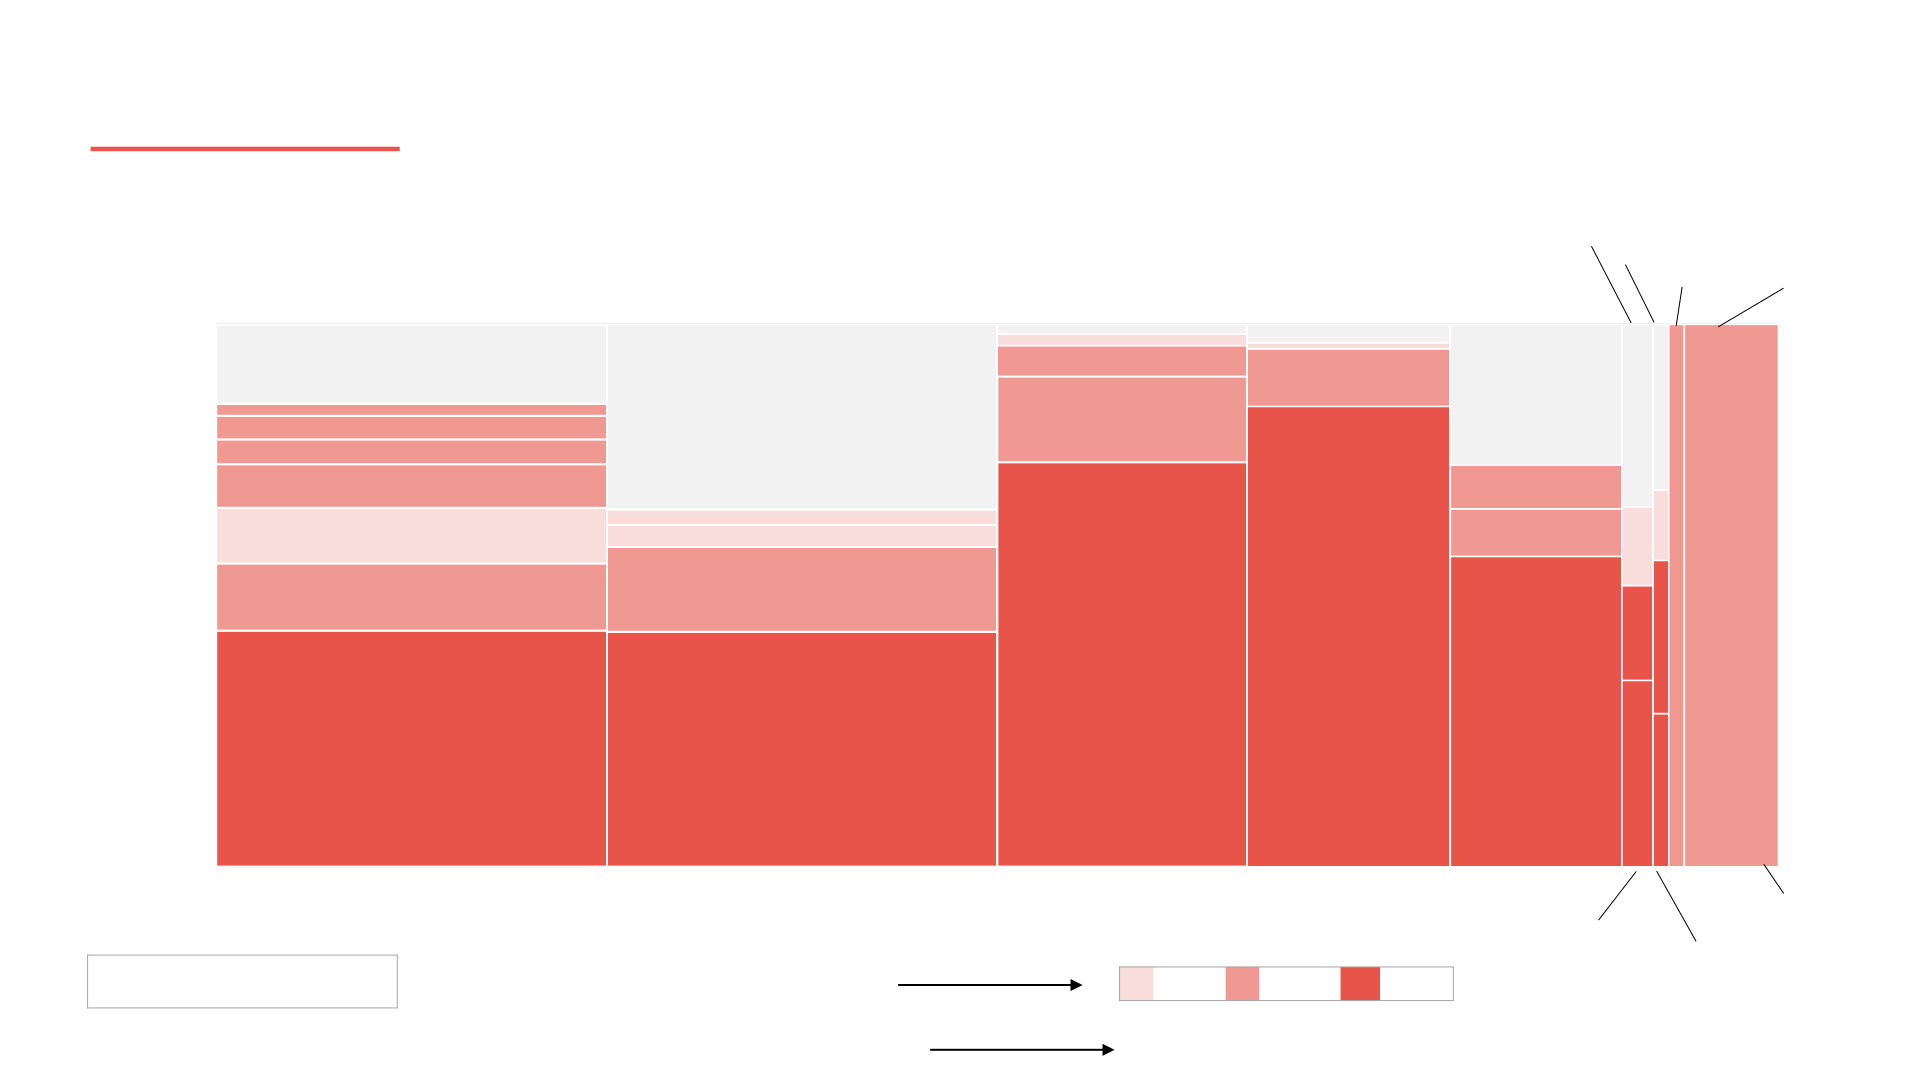
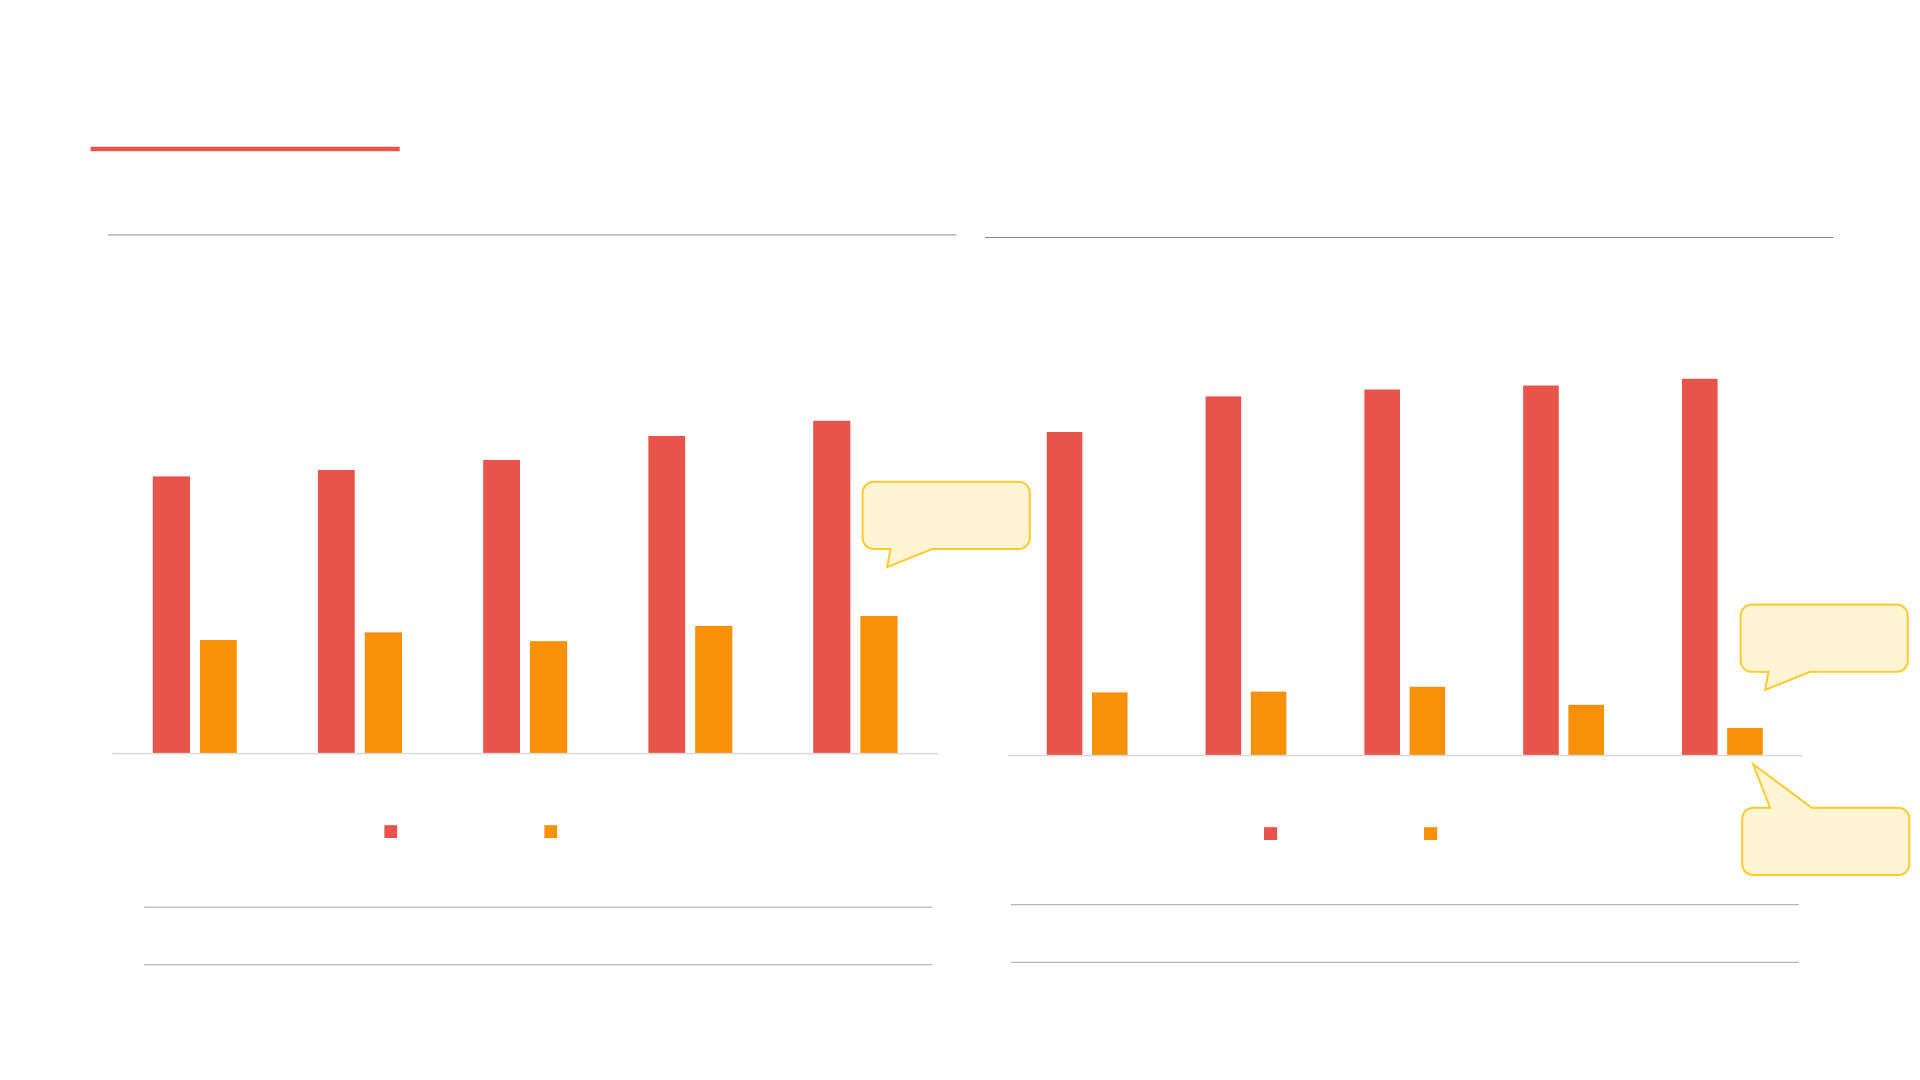
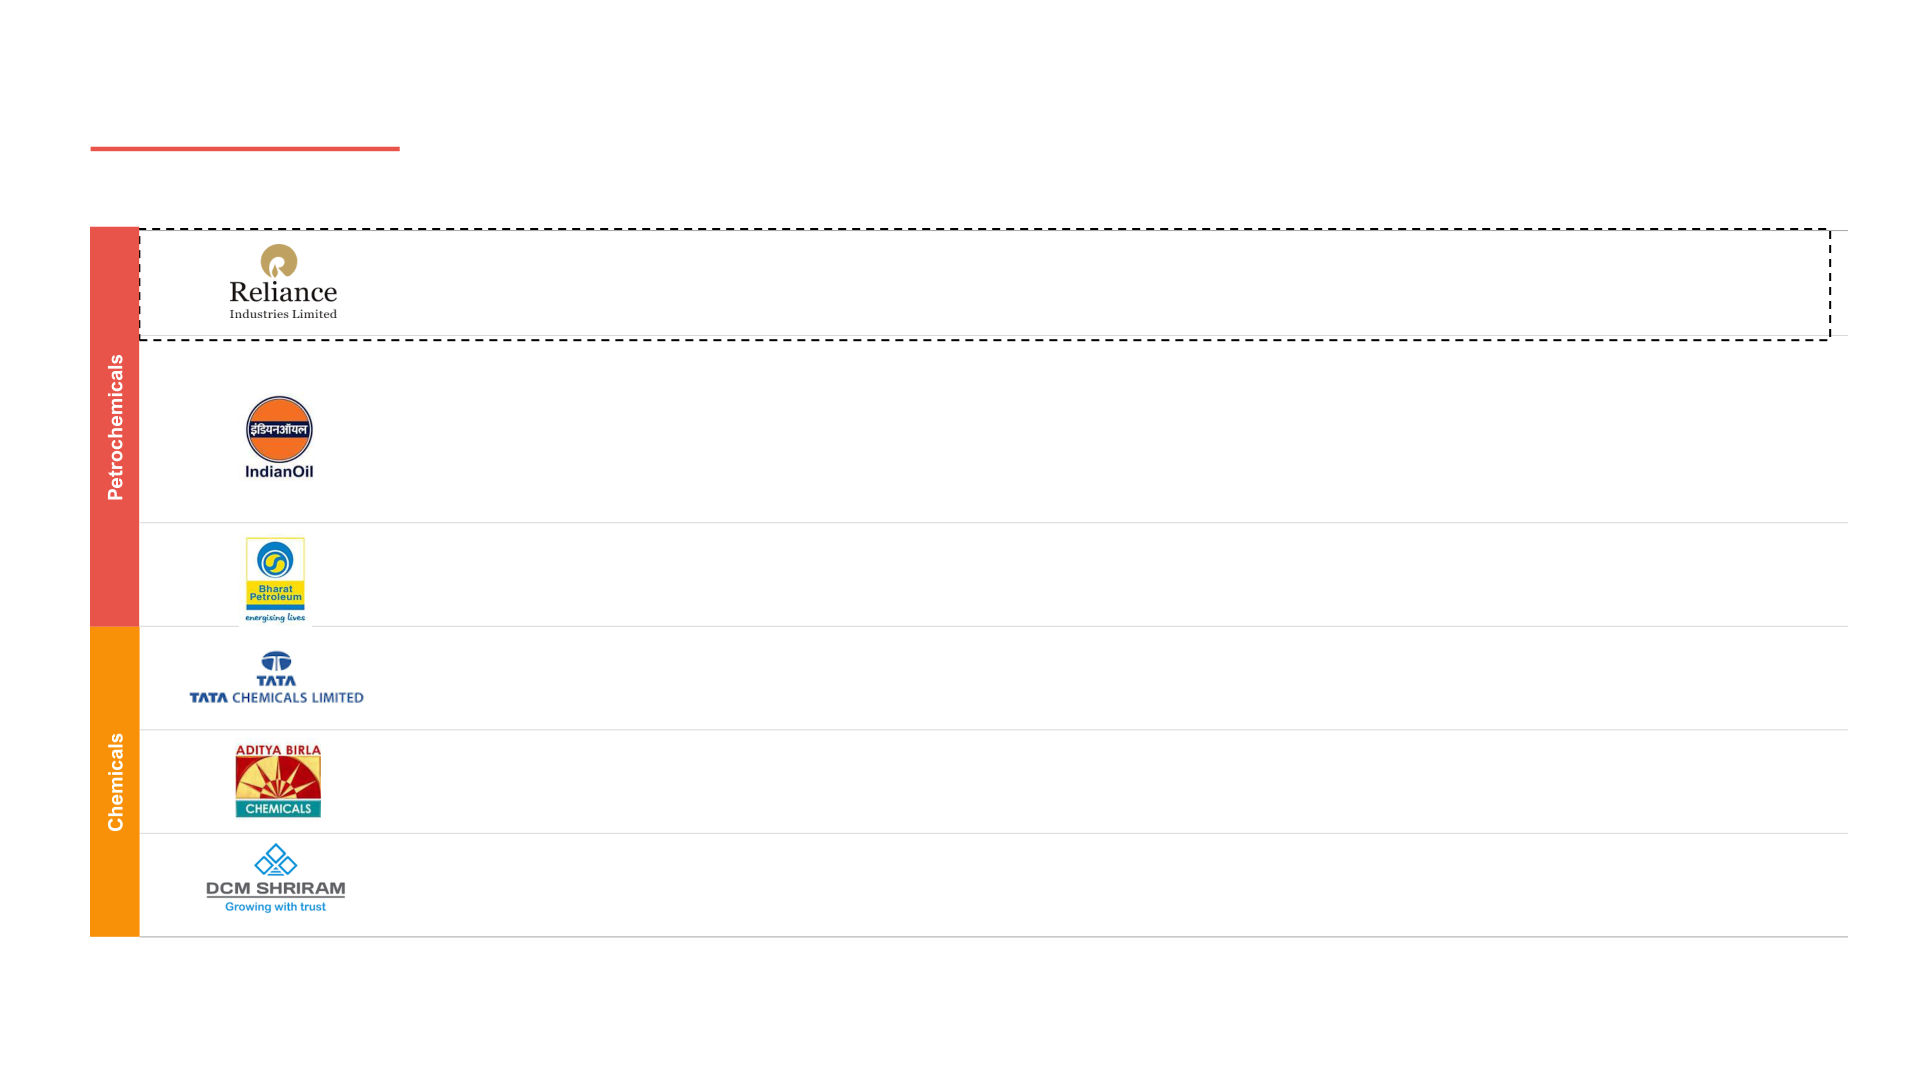
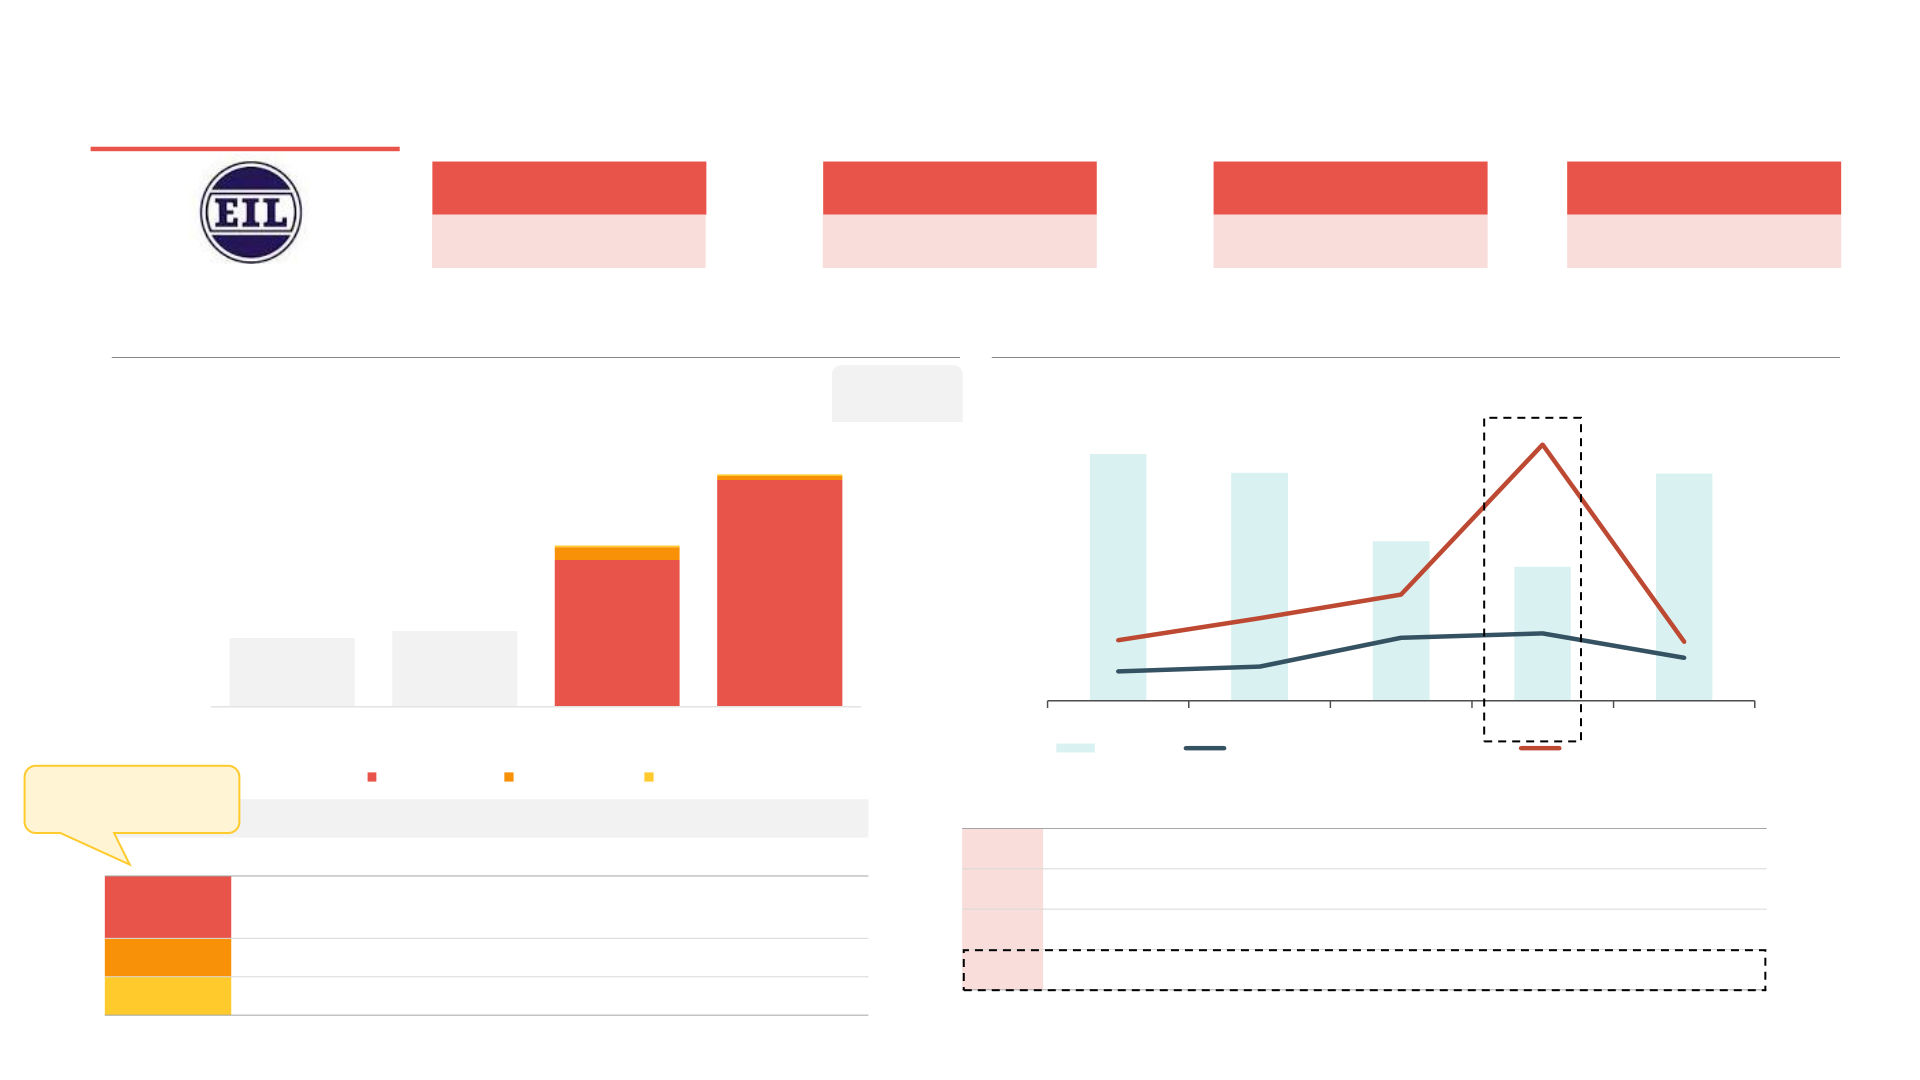
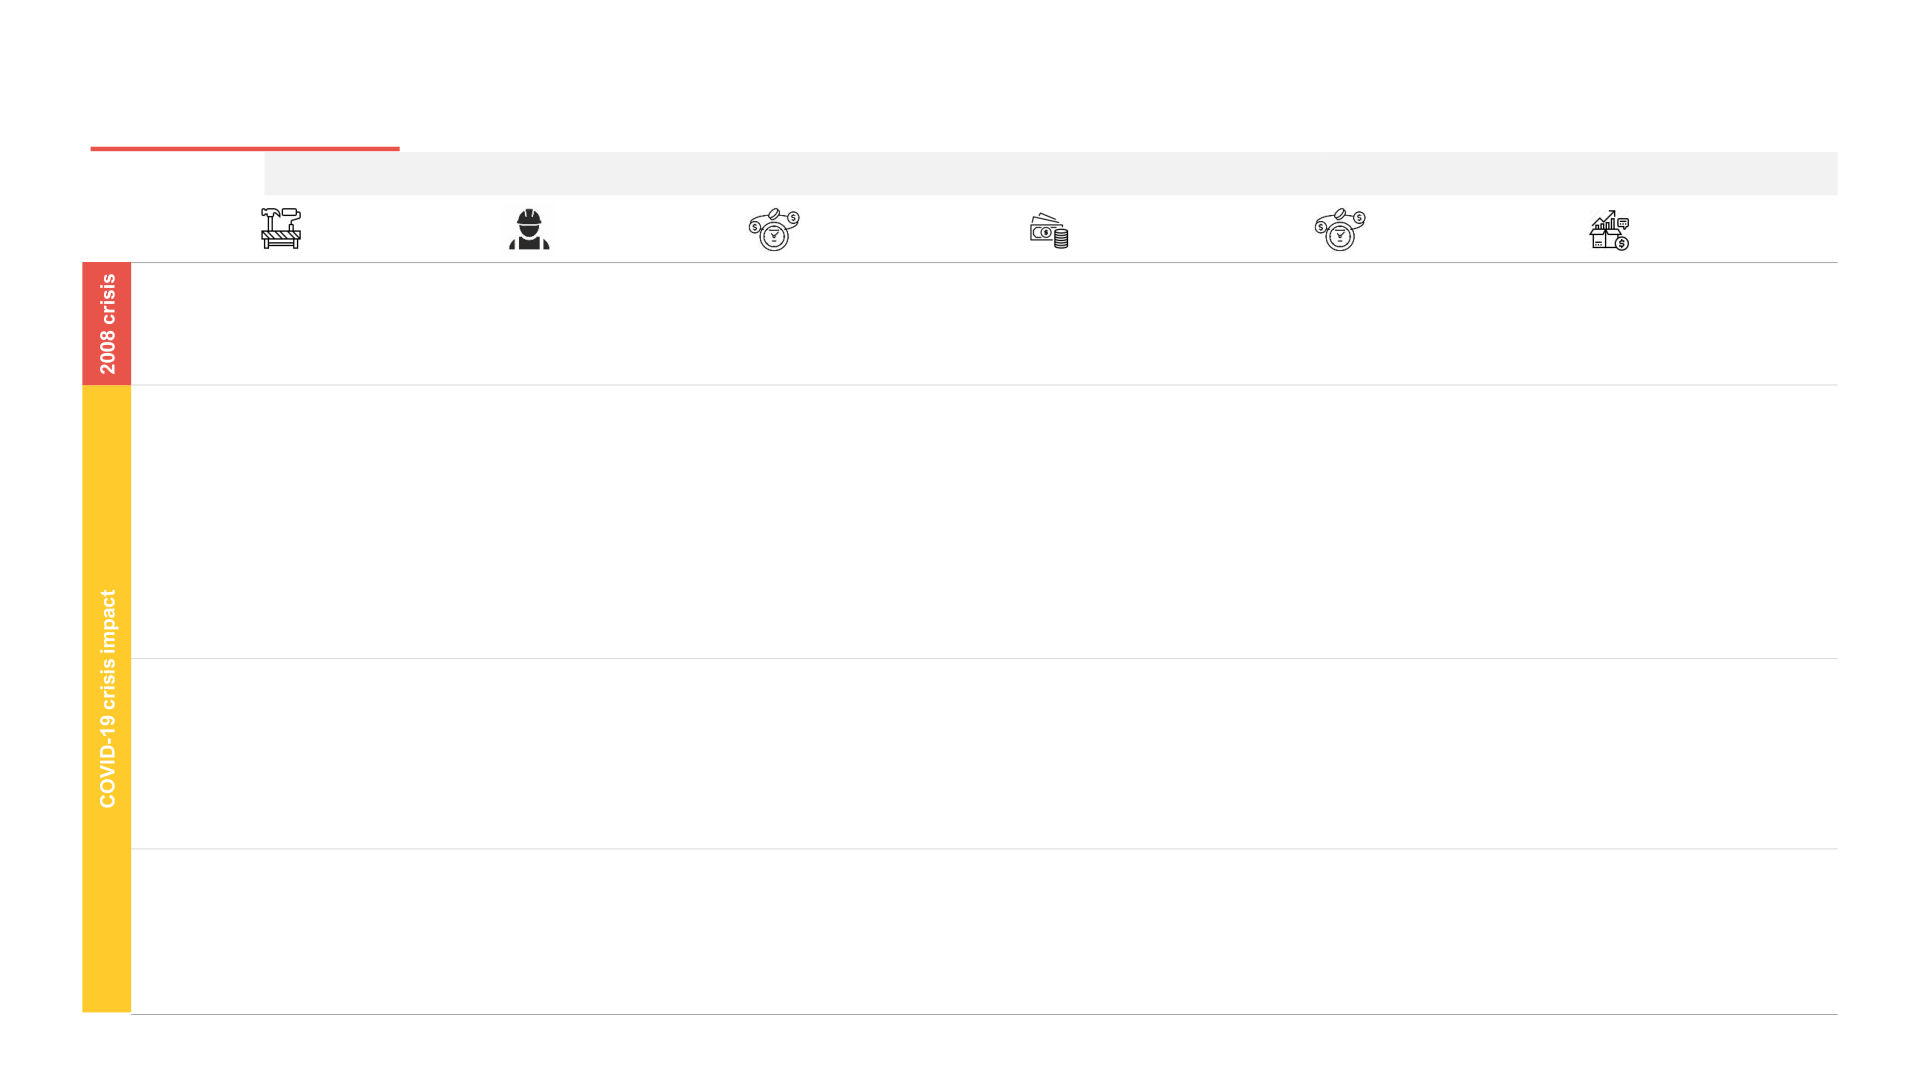
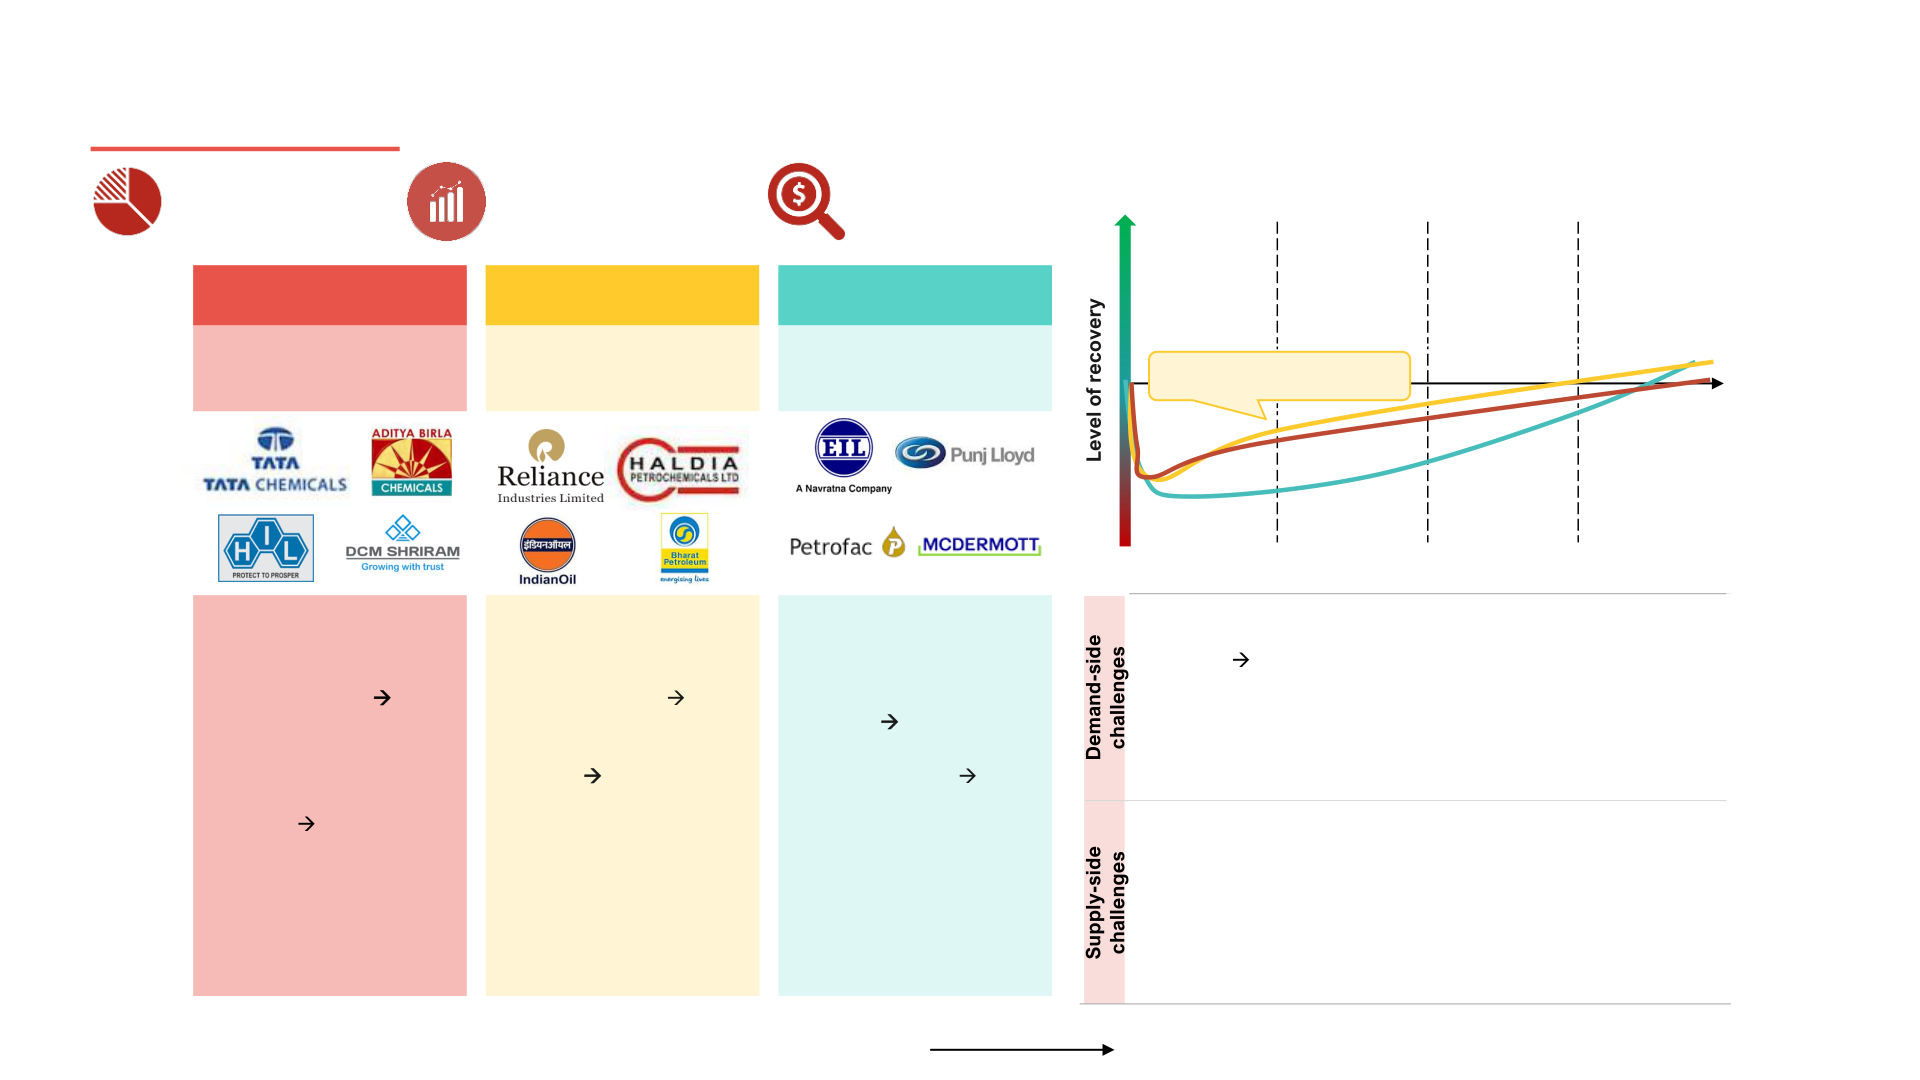
Infrastructure ‘Re - accelerate’ series – Oil and gas and chemicals REPORT: How India’s oil & gas and chemical sectors will rebound from COVID - 19 crisis September 2020 Confidential and proprietary © Praxian Global Pvt. Ltd. Table of contents 1 Executive summary 2 Oil and gas 2.1 Exploration 2.2 Refinery 3 Chemicals 3.1 Major chemicals 3.2 Petrochemicals 4 Policy recommendations © PGA Labs | 2 Glossary (1/2) Abbreviation Full form Explanation (if required) Money owed by a company to its suppliers AP Accounts payable Money owed to a company by its customers AR Accounts receivable BORL Bharat Oman Refinery Limited BPCL Bharat Petroleum Corporation Limited CAGR Compounded Annual Growth Rate Money spent by a company to buy, maintain or improve its fixed assets Capex Capital expenditure CCC Cash conversion cycle Time taken by a company to convert its investment in inventory into cash flow from sales CPCL Chennai Petroleum Corporation Limited DIO Days inventory outstanding Average number of days a company holds its inventory before selling it Average number of days a company takes to pay its suppliers DPO Days payables outstanding Average number of days an organization takes to receive payments from its customers DRO Days receivables outstanding EBITDA Earning before interest, taxes, depreciation and amortization ECB External commercial borrowing Debt raised by companies from other countries (where interest rates are lower) EPC Engineering, procurement and construction Firms engaged in construction activities in the infrastructure sector GACL Gujarat Alkalies and Chemicals Limited GDP Gross Domestic Product GNFC Gujarat Narmada Valley Fertilizers and Chemicals GSECL Gujarat State Electricity Corporation Limited HIL Hindustan Insecticides Limited © PGA Labs | 3 Glossary (2/2) Abbreviation Full form Explanation (if required) HMEL HPCL - Mittal Energy Limited HOCL Hindustan Organic Chemicals Limited HPCL Hindustan Petroleum Corporation Limited IOCL Indian Oil Corporation Limited ISRL Indian Synthetic Rubber Limited JV Joint venture MRPL Mangalore Refinery and Petrochemicals Limited NPA Non - performing assets NPL National Peroxide Limited PAT Profit after tax PCPIR Petroleum, Chemicals and Petrochemicals Investment Regions PLR Prime Lending Rate RCF Rashtriya Chemical Fertilizers RIL Reliance Industries Limited RM Raw material SME Small and Medium Enterprises UPL United Phosphorus Limited WC Working capital Capital requirement of a business to maintain its day - to - day operations © PGA Labs | 4 Foreword The aftereffects of COVID - 19 pandemic will be wide and large. The manpower availability, payment terms and costing, availability of finance, pandemic has already affected the economy severely. Although the payment terms and pricing, and consumer demand. We have also recovery is going to be a long - drawn and hard - fought process, Indian analysed the likely recovery scenario for all stakeholders in the sector. economy is resilient and shall bounce back. The situation is evolving rapidly, and some of the expected scenarios This report is intended to provide various industry stakeholders including might have slight variations. This report reflects our perspectives in business leaders an overall perspective on the impact of COVID - 19 on August 2020. Contact us for latest updates. the oil and gas and chemical sectors as the economy starts recovering nd post a nation - wide lockdown that started on 22 March 2020. We, at PGA Labs, look forward to continuing the discussion with our friends across sectors and exchanging notes as the situation evolves. We also discuss how the impact of the current economic crisis is different from 2008 financial crisis. We have identified the growth trends in the sectors along with the ley players in each sector. In the section ‘Project status’, we have assessed the status of current projects. In the section on EPC company”, we have looked at the trends of receivables and payables for EPC companies in the sector, which is reflective of the health of asset owners in those sectors. We have examined the impact of COVID - 19 on key parameters like raw material and equipment supply, _____________________ _____________________ Madhur Singhal Aryaman Tandon Managing Director Director © PGA Labs | 5 Key highlights: Oil and gas, and chemicals Overall Oil and gas Chemicals • Oil and gas is an important contributor to economy • Refinery capacity has increased at 2.5% CAGR over • India’s net imports of chemicals and petrochemicals is and accounts for 15% of India’s GDP FY12 - 18, indicating moderate increase in demand for 40% and 7% of their respective domestic production – Importance of oil and gas sector in economy petroleum products in FY19, primarily because of higher production cost is leading to increased focus on capacity – Advent of electric vehicles might impact and lower manufacturing scale expansion demand in future, but increase in demand for – Installed capacity has grown at moderate ATF, petrochemical feedstock etc. will drive CAGR of 2.1% and 4.3% over FY12 - 18 • India is focusing on higher exports of refined oil and growth – Polymer, synthetic rubber and inorganic and chemical / petrochemicals by focusing on targeting organic chemicals have higher imports higher manufacturing scale; government setting • Public sector accounts for 57% refinery capacity. up PCPIRs to achieve production scale Private companies like RIL have invested heavily in • Chemical sector is fragmented with presence of large both upstream and downstream segments number of SMEs, whereas petrochemical sector has • Private sector participation has increased, with big – Foreign oil companies have also entered the oligopolistic structure with high private sector conglomerates such as RIL investing in increasing downstream segment by creating JVs with presence their production capacity public sector players – Most downstream oil and gas companies have petrochemical refineries • Most of companies (except SMEs in chemical • Sector is attractive for EPC firms due to stable sector) have strong balance sheet but decreased payment cycle because of healthy balance sheet of • Sector is attractive for EPC firms due to stable demand is likely to delay new capacity expansion asset owners payment cycle because of healthy balance sheet of plans – DRO and DPO for EPC firms decreased from 4 asset owners to 2 months and 6 to 4 months respectively – WC requirement for EPC firms increased from • COVID is expected to act as a short - to - medium over FY15 - 19 - 22 to - 7 days over FY11 - 19 term blip in the growth of the sectors. Existing projects might see medium - term delay due to • Oil demand is expected to rebound by Q3FY21, but • Chemical and petrochemical demand is expected to lower availability of labor and raw materials upstream companies will be more vulnerable to rebound by end of Q3FY21, but margins may remain price fluctuations affected Source(s): PGA Labs analysis © PGA Labs | 6 Oil and gas Oil and gas primarily consists of 3 major components – exploration, refining and pipelines Oil and gas Exploration Refining Pipelines • Exploration refers to drilling into wells • Refining refers to processing crude oil • Pipelines refers to underground / containing oil and gas reserves to procured from oil exploration underwater pipes constructed to extract them. companies in refineries. transport crude / refined oil over large • Oil wells awarded to companies based • Products such as petrol, diesel, distance on bidding conducted by government. kerosene, petrochemical feedstock etc. are extracted from crude oil. Public Public Central Private Private Private / JV JV JV Sources: PGA Labs analysis © PGA Labs | 7 Addressed in this report Oil and gas - Exploration Sector overview: Exploratory and development well drilling has declined post peak in FY14; private sector involvement has declined post peak in FY14 Public sector involvement in drilling has increased whereas Yearly drilling as a % of cumulative drilling carried out since private sector’s share has declined in recent years 1947 has remained consistent between 3 – 3.5% Exploratory and development well CAGR CAGR Yearly drilling as % of cumulative drilling FY12 - 18 drilling metreage (K m.) FY09 - 12 Drilling (K m.) Drilling as % of cumulative drilling 42.8 45.0 10.0% 41.6 40.4 39.2 Pvt. companies’ participation has 40.0 1,415 declined considerably 37.9 35.2 36.5 8.0% 1,319 35.0 1,291 1,272 - 0.6% 2.9% 1,246 1,228 30.0 1,168 1,118 6.0% 125 5.2% - 11.9% 256 500 152 25.0 326 478 3.7% 280 20.0 3.6% 3.5% 3.4% 286 4.0% 3.0% 2.9% 2.8% 15.0 10.0 2.0% 5.0 1,121 1,076 2.1% 2.2% 1,035 - 0.0% 946 915 888 FY12 FY13 FY14 FY15 FY16 FY17 FY18 841 832 Drilling Drilling as a % of cumulative drilling Key reasons for stagnant % net drilling • Slow process of awarding new oil blocks for exploratory and development drilling FY09 FY12 FY13 FY14 FY15 FY16 FY17 FY18 • Rules related to sharing royalties with the government even if not enough oil is explored in a well Public sector Private sector / JV Sources: Ministry of Oil and Gas, Directorate General of Hydrocarbons, PGA Labs analysis © PGA Labs | 8 Oil and gas - Exploration Competitor landscape: ONGC accounts for the highest crude oil production; public sector accounts for ~70% of crude oil production Overview by crude oil produced MMT (FY18) Total ~ 36 MMT 26 MMT 10 MMT 100% Others 6% OIL 13% 90% RIL 8% 80% 70% 60% 50% ONGC Cairn Energy 87% 84% 40% 30% 20% 10% 0% Central Private / JV CAGR over last 5 years Central government companies Private / JV companies (FY13 – 18) Confidence level ◑ ◑ <1% 1 - 3% >3% <1% 1 - 3% >5% Sources: Ministry of Oil and Natural Gas, PGA Labs analysis © PGA Labs | 9 Low High ○◔◑◕● ○◔◑◕● Oil and gas - Exploration Competitor landscape: ONGC accounts for the highest natural gas production from its oil fields; public sector contributes to ~80% gas production Overview by natural gas produced MMSCM (FY18) Total ~ 33K MMSCM 26K MMSCM 7K MMSCM 100% OIL 11% Others 90% 20% 80% Cairn Energy 70% 19% 60% 50% ONGC 89% 40% RIL 30% 61% 20% 10% 0% Central Private / JV CAGR over last 5 years Central government companies Private / JV companies (FY13 – 18) Confidence level <1% 1 - 3% >3% <1% 1 - 3% >5% ◑ ◑ Sources: Ministry of Oil and Natural Gas, PGA Labs analysis © PGA Labs | 10 Low High ○◔◑◕● ○◔◑◕● Oil and gas - Refining Sector overview: Refinery capacity has grown at 2.5% CAGR over FY12 – 18; public sector firms account for 57% of refinery capacity Refinery capacity remained stagnant between FY12 and FY15; Refinery capacity addition as % of net capacity has CAGR between FY15 - 18 declined as compared to FY09 - 12 increased post FY15 CAGR CAGR Refinery capacity addition Refinery capacity (MMTPA) FY12 - 18 FY09 - 12 Capacity addition as % of net Capacity addition (MMTPA) 4.9% CAGR between FY15 and capacity FY18 16.0 10% 15.0 248 2.5% 6.6% 13.6 234 230 14.0 N/A 2.4% 17.3 215 215 8% 213 213 15.0 15.0 12.0 15.0 15.0 7% 15.0 15.0 10.0 176 5% 3.4% 2.1% 88.2 6% 80.0 0 80.0 8.0 80.0 80.0 78.0 78.0 4% 70.5 6.0 3.9 4.0 2% 2.0 2.0 2% 1% 0% 0% - - 142.1 4.4% 2.8% 139.0 135.1 - 0% 120.1 120.1 120.1 120.1 105.5 FY13 FY14 FY15 FY16 FY17 FY18 Capacity added % addition w.r.t. installed capacity Key reasons for variation in % capacity addition FY09 FY12 FY13 FY14 FY15 FY16 FY17 FY18 • Expansion projects planned by companies post FY10 (when oil prices increased) got completed after FY15. Public sector Private sector JV • Entry of JV players post FY10 had already added considerable capacity before FY13. Sources: Ministry of Oil and Natural Gas, PGA Labs analysis © PGA Labs | 11 Oil and gas - Refining Competitor landscape: Public sector companies account for 57% of refinery capacity in India; IOCL has the highest refinery capacity followed by RIL Overview by refinery capacity % (FY18) Total ~ 247 MMTPA 142 MMTPA 88 MMTPA 17 MMTPA 100% Others 2% CPCL 8% 90% Nyara Energy 23% BORL MRPL 11% 34% 80% HPCL 11% 70% 60% BPCL 19% 50% 40% RIL 77% HMEL 30% 66% IOCL 49% 20% 10% 0% Public Private Joint Venture CAGR over last 5 years Private Joint Venture Public (FY13 – FY18) 0 - 5% 5 - 10% >10% 0 - 0.5% 0.5 - 2% >2% 0 - 10% 10 - 20% >20% Confidence level ◑ ◑ Sources: Ministry of Oil and Natural Gas, PGA Labs analysis © PGA Labs | 12 Low High ○◔◑◕● ○◔◑◕● Oil and gas Project status: Capacity expansion in oil refineries is happening at a consistent CAGR observed over previous years Organization Description • Reliance plans a shift from oil to chemical business in anticipation of reduced demand for oil due to advent of electric vehi cle s, and better margins in petrochemical products • Nayara Energy planning to invest INR 1,300B to expand the capacity of Vadinar refinery from 20 MMTPA to 46 MMTPA over 2022 – 24. • Indian Oil plans to expand its Gujarat refinery from 13.7 MMTPA to 18 MMTPA over the next few years. • The company plans to expand Panipat refinery from 15 MMTPA to 25 MMTPA. • Overall, the company aims at expanding its refinery capacity from 69.2 MMTPA to 150 MMTPA by 2030. • HPCL plans to expand its Vizag refinery from 8.3MMTPA to 15MMTPA. • Mumbai refinery is being expanded from 7.5 MMTPA to 9.5 MMTPA. • HPCL and Rajasthan government are constructing a 9 MMTPA refinery through a JV in Barmer , Rajasthan. • HMEL’s refinery of 11.5 MMTPA is expandable upto 18 MMTPA and the company plans to expand it over the next few years. • BORL is expanding its refinery capacity to 7.8 MMTPA and further plans to expand it to 15 MMTPA over the next few years. • CPCL plans to add a 9 MMTPA refinery to expand its refinery capacity from 10.5 MMTPA to 19.5 MMTPA. Sources: Company websites, PGA Labs analysis © PGA Labs | 13 Oil and gas EPC company: L&T Hydrocarbon Engineering has a negative WC requirement due to better vendor terms, which is consistent with WC requirement of L&T group Revenue* EBITDA* PAT* Order book size* INR 126.9B INR 9.5B INR 5.5B INR 381B L&T Hydrocarbon’s contribution to L&T’s net order book L&T Hydrocarbon has a negative WC requirement, has increased from 6% to 13% over the period FY15 - 19 primarily due to higher DPO Trade receivables as % of revenue Revenue (INR B) Trade payables as % of cost Order book of L&T Hydrocarbon Engineering (INR B) 150.0 60% 126.9 47% CAGR 110.4 120.0 42% 29% 40% 87.9 32% 90.0 30% 43% 71.1 57.2 60.0 28% 20% 25% 381 30.0 17% 15% 261 263 13% 0.0 0% 150 140 FY15 FY16 FY17 FY18 FY19 Revenue Trade receivables as % of revenue Trade payables as % of cost FY15 FY16 FY17 FY18 FY19 FY15 FY16 FY17 FY18 FY19 DPO % composition of L&T’s order book 191 157 112 117 131 FY15 FY16 FY17 FY18 FY19 DRO 124 90 60 50 54 DIO 2 6 6 3 1 6% 6% 10% 10% 13% CCC - 64 - 61 - 46 - 64 - 75 Notes: * represents values for FY19; Revenue refers to operating revenue Sources: Annual report, PGA Labs analysis © PGA Labs | 14 Oil and gas COVID impact: COVID - 19 is expected to have a high short term - impact across demand and supply factors; demand to increase in medium - term Supply side factors Demand side factors RM and Payment terms and Payment terms and Petroleum Labor Availability of finance equipment costing pricing demand • No restriction on • No restriction of • Oil prices declined • Strong balance sheets • No major impact as • No major impact availability of raw availability of labor leading to decreased of companies during fuel consumption as fuel materials and for construction revenue, which led to crisis. Benchmark PLR did not decline consumption did Overall ● ● ● ● ● ● equipment increase in AP increased from 13.25% not decline to 14% during crisis • EPC company: • EPC company: • EPC company: • EPC company: WC • EPC company: • Short - term Limited Labor starts Increase in AP as requirement to increase Increase in AR as demand reduction availability of joining back. payments delayed by as projects get stalled. payments get due to drop in Short - RMs due to Contract labor companies. Cost of • Asset owners: Overall delayed consumption due term disruption not available RM to decline due to balance sheets of • Asset owners: to lockdown ● ● ● ● ● ● E quipment • Asset owners: decrease in demand. companies are strong. Increase in AR due (1 to 3 import to be hit. Labor to be • Asset owners: Cost Lower margins due to to delay in payments months) • Asset owners: available at of crude oil to reduced crude oil cost from petrol pumps Inventory liquidation to slow Normal supply of exploration / decrease due to might lead to delay in due to decreased down as demand crude oil refinery sites demand slump new projects demand Covered under essential decreases commodities • EPC company: • EPC company: • EPC company: AP • EPC company: WC • EPC company: AR • Demand starts Resumption of More than 80% start decreasing as requirement reduces as starts reducing as increasing as RM supply. laborers join payments by asset construction resumes. payments resume aviation sector Medium - I mported back. Contract owners resume. Cost • Asset owners: No • Asset owners: AR and other term (4 equipment labor starts of RM start increasing major impact on bank reduces as transport ● ● ● ● ● ● supply may returning as demand resumes finance, but new consumption mediums start to 8 remain • Asset owners: • Asset owners: AP projects might remain increases. Prices returning to months) disrupted Labor to remain start reducing . Crude delayed as demand may remain higher normalcy • Asset owners: available oil prices to remain takes time to resume due to taxes Normal supply moderate • EPC company: • EPC company: All • EPC company: AP • EPC company: WC • EPC company: • Demand Full - scale laborers join back. and cost back to pre - requirement back to Payments normalize increases back to Long - resumption of • Asset owners: COVID levels. pre - COVID levels. and AR improves pre - COVID levels term (9 construction Labor remains • Asset owners: AP • Asset owners: No • Asset owners: AR ● ● ● ● ● ● to 12 activity available further reduces. major on bank finance. reduce to pre - • Asset owners: Crude oil prices might New projects start COVID level but months) Normal supply start increasing moving prices remain high Sources: PGA Labs analysis © PGA Labs | 15 Increasing negative Increasing positive impact impact ● ● ● ● ● Oil and gas Future outlook: Upstream oil and gas firms will be most vulnerable due to price fluctuation; recovery to be led by downstream firms Expected investment Expected annual growth Capacity* (FY18) Expected industry recovery pattern source rate (FY18 - 23) 247 MMTPA Public and private 2 - 3% Highly sector positive Slower recovery due to greater Upstream Downstream EPC pushback in upstream EPC projects Positive due to volatility in prices Uptick as offices slowly Time period Market Pre - COVID Oligopoly Oligopoly Oligopoly reopen and people prefer structure levels personal vehicles Players Negative Highly Lower reduction for upstream negative companies as downstream companies will procure cheaper crude oil for storage AMJ 20 JAS 20 OND 20 JFM 21 • Decline in • Gradual • Return of normalcy as fuel COVID19 fuel demand improvement demand stabilizes ◑ ◑ ◕ ◕ impact ◑ ◑ Lesser on - in demand road vehicles • Impact on capex • Impact on capex • Delay in high - ticket Industry • Decline in Fluctuation in oil prices to Fluctuation in oil prices to projects Pushback in outlook industrial affect margins and impact margins, resulting in timelines of some projects usage sustainability of well pushback in capex • Cost escalations operations investment Increase in cost due to • RM and • Gradual • Return of normalcy as prices • Pushback in well • Oil to petrochemical project delays to affect equipment increase in and demand stabilize operationalization New switch Better margins in margins supply prices to wells may be petrochemical sector to • Lower fuel ease operationalized when prices drive switch from oil price can pressure on stabilize drive upstream storage for players future sales Note(s): *Capacity refers to refinery capacity Sources: PGA Labs analysis © PGA Labs | 16 Low High ○◔◑◕● ○◔◑◕● Chemicals Major chemicals and petrochemicals are the primary product categories covered under chemicals Chemicals Major chemicals Petrochemicals • Major chemicals are products such as alkali • Petrochemicals are manufactured using chemicals, organic chemicals, inorganic petrochemical feedstock derived from oil chemicals, dyes and pesticides. refineries. • These products are either sold in the market, • They are mainly used in the industry for such as pesticides, or are further used in the manufacturing products such as fabric, tires, industry to manufacture other products. plastic etc. Public Public Private Private JV Sources: PGA Labs analysis © PGA Labs | 17 Chemicals Sector overview: Major chemicals and petrochemical production capacity has increased at 3.7% CAGR over FY12 – FY20 % capacity addition has declined post FY14 due to lower Chemical and petrochemical production capacity growth has decreased capacity utilization levels post FY12 and is almost stagnant post FY16 CAGR CAGR Production capacity (MMTPA) Chemical production capacity addition FY06 - 12 FY12 - 18 Capacity addition (MMTPA) Capacity addition as % of 3.7% 56 7.6% 55 net capacity 55 52 50 5.0 10% 46 8% 45 13.5 13.9 2.1% 4.4% 13.1 12.8 0.3 12.5 4.0 8% 36 12.2 12.3 3.0 6% 29 11.5 4% 4% 0.3 9.5 0.3 2.0 4% 3.9 42.0 41.6 41.9 9.0% 4.3% 39.4 37.5 2% 33.6 32.5 1% 0.0 2.1 1.0 2% 24.7 1.9 19.4 1% 0.4 1.1 0.5 0.4 0.0 0% 0.0 FY13 FY14 FY15 FY16 FY17 FY18 FY06 FY09 FY12 FY13 FY14 FY15 FY16 FY17 FY18 Petrochemicals' capacity addition Major chemicals capacity addiiton Petrochemicals Major chemicals % capacity addition Capacity utilization (%) Key reasons for variation in chemical capacity addition Petroch • Rapid capacity expansion during FY06 – FY12 not accompanies with corresponding 93 87 85 84 85 82 86 87 88 emicals demand growth, leading to lower capacity utilization. • Fall in prices of petrochemical products leading to slower capacity addition. Major 82 70 77 77 77 76 76 76 79 chem. Sources: Department of Chemicals and Petrochemicals, PGA Labs analysis © PGA Labs | 18 Chemicals – Major chemicals Competitor landscape: Alkali chemicals account for ~65% of major chemicals production capacity; the sector is diversified with a lot of smaller SMEs Overview by installed production capacity (FY18) Total ~14 MMTPA 0.5 MMTPA 9.3 MMTPA 2.5 MMTPA 1.3 MMTPA 0.3 MMTPA 100% Others 9% 90% GACL 4% CCI 5% 80% NPL 7% Himadri Chemicals 70% Others 56% Others 60% Others 55% 9% Others 60% 69% GNFC 22% 50% Gujarat Insecticides 2% Meghmani Organics 2% UPL 3% NACL 2% 40% SRF Industries 2% GACL 5% Rallis India 3% HOCL 3% RCF 4% UPL 6% Nirma 7% 30% Atul Limited 2% Luna Chemical Industries 6% Excel Crop Aries Organics 4% Care 8% DCM Shriram 7% Laxmi Organic Chemicals 6% Bodal Chemicals Philips Carbon Black 20% 7% HIL 9% 43% Tata Chemicals 9% Kiri Industries 7% GNFC 20% 10% Insecticide Sudarshan s India 13% Aditya Birla Chemicals 12% Chemicals 11% 0% Inorganic Pesticides Alkali chemicals Organic chemicals chemicals Joint Venture CAGR over last 5 years (FY13 – FY18) Confidence level 0 - 1% 1 - 5% >5% ◑ ◑ Sources: Department of Chemicals and Petrochemicals, Company websites, PGA Labs analysis © PGA Labs | 19 Low High ○◔◑◕● ○◔◑◕● Chemicals - Petrochemicals Competitor landscape: RIL is the biggest petrochemical manufacturer with highest production capacity among all petrochemical products Overview by installed production capacity (FY18) Total ~42 MMTPA 0.7 MMTPA 0.4 MMTPA 10.8 MMTPA 10.1 MMTPA 6.6 MMTPA 5.7 MMTPA 4.8 MMTPA 0.3 MMTPA 2.3 MMTPA 100% Others 2% Others 3% Haldia Petrochemicals 2% Indian Glycols 1% IOCL 6% Others 15% Others 90% IOCL 11% 31% Others 26% BCPL 2% Others OMPL 16% MRPL 4% Others 34% 34% 80% HMEL 5% JBF Industries 8% GAIL 8% 70% Apcotex BCCL 3% Filatex India 13% HPCL 4% Haldia Petrochemicals 10% 9% 60% Nirma 15% IOCL 16% 50% IOCL 12% IOCL 17% 40% ISRL RIL 75% RIL 85% 28% 30% RIL 57% 20% RIL 44% RIL 43% RIL 34% 10% RIL 28% 0% Performance Other Polymers Olefins Aromatics Fibre intermediates Synthetic fibres plastics petrochemicals Synthetic detergent CAGR over last 5 years intermediates Synthetic rubber (FY13 – FY18) Confidence level 0 - 1% 1 - 5% >5% ◑ ◑ Sources: Company websites, PGA Labs analysis © PGA Labs | 20 Low High ○◔◑◕● ○◔◑◕● Chemicals India is a net importer of major chemicals and petrochemicals; imports as % of production has declined for petrochemicals Major chemicals’ net imports constitute ~40% of production of Net imports of petrochemicals as % of production has declined those chemicals in India from 20% to 7% over FY15 - 19 Production and net import of major chemicals in Production and net import of petrochemicals in India (MMTPA) India (MMTPA) 37.5 36.8 36.4 35.8 11.6 32.2 11.1 10.2 9.9 9.7 Driven by organic and inorganic chemicals 4.8 4.4 4.2 4.0 3.9 Driven by polymers and synthetic rubber 6.8 6.3 6.4 5.1 2.7 FY15 FY16 FY17 FY18 FY19 FY15 FY16 FY17 FY18 FY19 Decline is driven by Production Net import Production Net import increase in exports Net import as % of production Net import as % of production 20% 18% 19% 14% 7% 41% 43% 38% 40% 41% Source(s): Department of Chemicals and Petrochemicals, PGA Labs analysis © PGA Labs | 21 Chemicals Project status: Companies planning to increase their capacity expansion as capacity utilization is reaching peak levels and demand is increasing Organization Description • Reliance plans a shift from oil to chemical business in anticipation of reduced demand for oil due to advent of electric vehi cle s • In accordance with its strategy, it plans to add polypropylene capacity along with polymer production capacity by 2022 • Indian Oil is adding a 680 KTA polypropylene plant at its Paradip refinery. Also, it is planning to set up a 1.2 MMTPA PTA plant in the same refinery. • The company is planning to add polypropylene plants at its Barauni and Panipat refineries. • The company is planning to expand Naptha Cracker Unit’s capacity from 847 KTA to 947 KTA, MEG capacity from 300 KTA to 425 KTA, and BEU capacity from 117 to 204 KTA at its Panipat refinery. • Revamp of all plants to produce BS - VI complaint fuel. • BPCL plans to add a polypropylene unit of 450 TMTPA at its Mumbai refinery. • Tata Chemicals plans to expand its soda ash production capacity from 1.1 MTPA to 1.3 MTPA at its Mithapur plant. • Aditya Birla Chemicals plans to expand its caustic soda production capacity from 1.14 MTPA to 1.45 MMTPA by FY21. • The company plans to expand its Viscose Stape Fibre production capacity from 0.55 MTPA to 0.78 MTPA by FY21. • DCM Shriram plans to expand its caustic soda manufacturing capacity from 0.5 MTPA to 0.8 MTPA at its plant at Jhagadia in Gujarat. Sources: Company websites, PGA Labs analysis © PGA Labs | 22 Chemicals EPC company: EIL’s order book growth driven by consistent order inflow for refineries and chemical units; low WC requirement due to late vendor payments Revenue* EBITDA* PAT* Order book size* INR 24B INR 5.92B INR 3.7B INR 112B Lower WC requirement due to higher trade payables; trade Order book of EIL has grown at 22% CAGR over FY13 – FY19; growth driven by hydrocarbon segment payables increased considerably as revenues declined in FY17 Trade receivables as % of revenue Revenue (INR B) CAGR Order book composition for Engineers Trade payables as % of cost FY17 - 19 India Limited (INR B) 30 27 22.4% 100% 112 25 24 25 0.6 - 0.4% 2.0 101% - 43.7% 80% 20 78 17 0.6 14 60% 6.2 15 42% 33% 109.3 24.3% 40% 36 10 33 24% 23% 70.8 20% 5 27% 36.4 25% 33.2 12% 14% 17% 0 0% FY11 FY13 FY15 FY17 FY19 FY13 FY15 FY17 FY19 Revenue Trade receivables as % of revenue Trade payables as % of cost Hydrocarbon Infrastructure Others EIL is focused on building petrochemical refineries FY11 FY13 FY15 FY17 FY19 % share in order book DPO 71 160 164 352 80 FY13 FY15 FY17 FY19 DRO 43 48 82 94 72 Hydrocar - - 91% 97% bons DIO 6 0 1 12 1 Infra. - - 8% 2% CCC - 22 - 112 - 82 - 245 - 7 Others - - 1% 1% Sources: Company website, Annual reports, PGA Labs analysis © PGA Labs | 23 Chemicals COVID impact: COVID - 19 is expected to have a strong short - term impact on RM and labor availability; AR and AP to increase across the sector Supply side factors Demand side factors RM and Payment terms and Payment terms and Chemical Labor Availability of finance equipment costing pricing demand • No restriction on • No restriction of • Reduction in price of • ECBs reduced due to • No major impact as • No major impact availability of raw availability of labor crude oil during exchange rate demand for was not as traffic materials and for construction recession fluctuations. Benchmark severely impacted movement on Overall ● ● ● ● ● ● equipment PLR increased from highways did not 13.25% to 14% reduce • EPC company: • EPC company: • EPC company: • EPC companies: WC • EPC company: AR • Short - term Limited availability Labor starts Payment delays requirement to increase will increase. No demand reduction of RM and joining back, but might cause due to stalled projects. impact on cost as it due to drop in equipment due to disruptions increase in AP. Cost • Asset owners: No is fixed in the consumption due Short - supply chain continue Contract of RM and equipment major impact on capex contract. to lockdown term disruptions. labor not to decline due to availability due to • Asset owners: AR ● ● ● ● ● ● • Asset owners: available. decreased demand healthy balance sheets to increase due to (1 to 3 No restriction as • Asset owner: • Asset owner: of petrochemical payment delays. months) most of RMs are Labor to be Decrease in price of companies. SMEs will Product prices derived from available but crude oil. AP might face problems in might decline due to crude oil capacity utilization increase due to raising capex . No decrease in demand refineries to be lower delays in payments impact on PLR • EPC company: • EPC company: • EPC company: AP • EPC company: WC • EPC company: AR • Demand starts Resumption of > 80% laborers starts reducing. RM requirement reduces as reduces as increasing as Medium - RM and join back. cost increases as construction resumes payments resume. industrial demand term (4 equipment Contract labor demand increases • Asset owners: No impact on for chemical and ● ● ● ● ● ● supply. starts returning • Asset owners: AP Cautious lending by pricing petrochemical to 8 • Asset owners: • Asset owners: reduces, and crude banks to SMEs. Bigger • Asset owners: AR products months) Normal supply Labor to remain prices remain lower firms to remain reduces, but prices increases available unaffected to remain lower • EPC company: • EPC company: All • EPC company: AP • EPC company: WC • EPC company: AR • Demand Full - scale laborers join back and cost recover requirement back to recovers increases back to Long - resumption of • Asset owners: • Asset owners: AP pre - COVID level • Asset owners: AR pre - COVID levels term (9 construction Labor remains recover, and crude oil • Asset owners: Capex return to pre - COVID ● ● ● ● ● ● to 12 activity available price increases availability improves as level. Prices start • Asset owner: industrial demand increasing as months) Normal supply increases demand increases Sources: PGA Labs analysis © PGA Labs | 24 Chemicals Future outlook: Petrochemical companies are expected to drive sector recovery; strong balance sheets of companies to aid in recovery Expected investment Capacity (FY18) Expected annual growth source Expected industry recovery pattern 56 MMTPA rate (FY18 - 23) Public and private (combined) 3 - 4% Highly sector positive Chemical Petrochemical EPC Positive Time period Market Pre - COVID Uptick in demand as end - user Fragmented Oligopoly Oligopoly structure levels industries re - open Players Negative Highly negative AMJ 20 JAS 20 OND 20 JFM 21 • Decline in • Gradual • Return of normalcy as demand COVID19 industrial improvement stabilizes ◑ ◑ ◑ ◑ ◕ ◕ impact demand in demand Closure • Impact on capex • Impact on capex • Delay in high - ticket Industry during Decline in revenue due to Marginal impact as projects Pushback in outlook lockdown reduced demand to impact industrial demand declines timelines of some projects debt - raising capacity • Exports Increased focus • Cost escalations • Under - utilization of by companies on exports as Increase in cost due to • RM and • Gradual • Return of normalcy as demand capacity Short - to - demand starts rising project delays to affect equipment increase in stabilize medium term impact on margins supply prices due to capacity utilization • Lower fuel to ease price can pressure increase petrochem Margins Sources: PGA Labs analysis © PGA Labs | 25 Low High ○◔◑◕● ○◔◑◕● Oil and gas, and chemicals Government needs to ensure oil and gas companies continue with their capex plans; SMEs in chemical sector will require support to ensure WC availability Oil and gas, major chemicals and petrochemicals Oil and gas Chemicals • Decrease royalty charged for oil exploration in the short - • WC provision for SMEs active in the chemical ◑ ◑ term to provide a cushion against falling oil and gas prices. manufacturing space due to their low buffer for WC Short - term (1 to 3 months) • Decrease taxes on ATF to enable airline industry to • Review / reduce import tariff on petrochemical ◔ ◑ increase fuel consumption when air travel restarts feedstock to increase profitability • Ensure clearance for capacity expansion projects • Ensure clearance for capacity expansion projects ◑ ◑ Medium - term (4 • Introduce liquidity in the market by reducing lending • Introduce liquidity in the market by reducing lending to 8 months) ◕ ◕ rates to spur capex investment rates to spur capex investment • Increase incentives such as tax, logistics etc. for • Increase incentives such as tax, logistics etc. for ◕ ◕ increasing investments in PCPIRs increasing investments in PCPIRs Long - term (9 to 12 months) • Speed up award of more oil blocks under NELP to ensure • Introduce incentives in sectors which consume the ◕ ◑ inflow of private sector investment petrochemical products as RMs Sources: PGA Labs analysis © PGA Labs | 26 Low impact High impact ○◔◑◕● ○◔◑◕● How we help our clients We work with leading infrastructure asset owners and service providers and help Specific practitioner expertise them navigate the uncertainties surrounding the sector and economy Madhur Singhal Aryaman Tandon Portfolio strategy Optimizing portfolio of clients by assessing current and future growth Practice Leader Practice Leader plans and creating strong pipeline strategies Asset monetization and EPC and Waste investments management Cost optimization Identifying sustainable opportunities for profit improvement by focusing on strategic cost management Growth and scale - up Growing fast and scaling up by optimizing client offerings to target fast - Shishir Mankad Neerav Gupta growing infrastructure segments Domain Leader Domain Leader Infrastructure services Ports and SEZ Customer loyalty and experience Measuring and driving improvement in customer loyalty through detailed customer insights and proven frameworks Investment advisory Assessing market conditions and identifying key assets to acquire / hive off in line with long – term growth plans Anuj Mahajan Ashutosh Somani Practice Member Practice Member Enablement and implementation Urban development and Airports and Roads policy formulation Handholding incubation process of new business units and handling PMO for large - ticket construction projects How we help our clients We work across multiple manufacturing segments(Railways, T&D, Water, Fabrication etc.) to deliver best products at competitive prices Key management On Time Delivery Amrit Acharya Srinath Ramakkrushnan Zetwerk with its manufacturing capabilities ensures 100% On time Cofounder & CEO Cofounder delivery Quality With a quality team of >50 quality engineers, all manufacturing processes go through a stringent inspection ensuring best in class Vishal Chaudhary Rahul Sharma quality. Cofounder Cofounder Transparency and Real Time Visibility Zetwerk’s proprietary project management software ensures real time visibility of progress on ground. Pan India Presence Dheeraj Dhingra Peeyush Agarwal With manufacturing facilities in all corners of the country, we act as one Head Sales Strategy Business Head - Railways stop solution for all your manufacturing needs. Small to Large Projects We execute projects of all sizes ranging from few lakhs to upwards of multiple of crore How we help our clients We have a wide bouquet of deep business research skills and advanced analysis capabilities. Our research is unique, focusses on “What and Why” and our approach is holistic unlike a typical MR firm. We have successfully worked with clients across verticals Benchmarking (cost, Sector360: Scan / 50+ 100+ 250+ product features) fact - base Comparison of players across Detailed review and VC firms Investors Engagements relevant parameters landscape of a sector Our people have deep experience in Business research Company360: Competitor Company review intelligence Aryaman Tandon Seema Karwa Detailed review of company’s Intelligence and analysis Director Vice President details, strategy and operations of a company’s tactics Consumer Internet and FoodTech , Investments, and Ecommerce Consumer tech Survey administration and Voice of the Abhishek Maiti Vaibhav Tamrakar management customer Design, oversee, implement, Customer interviews and Vice President Vice President analyze and present findings survey - based analysis Shared mobility, Hospitality and EdTech, FoodTech , and E - groceries Mobility Mehak Batra Web scraping Process mapping Associate Vice President and analytics and best practices Scraping and analysis of public Enlist best practices Healthcare and Analytics data Connect with us - We will be happy to share perspectives Madhur Singhal Vaibhav Tamrakar Managing Director, Mumbai Vice President, Bengaluru madhur.singhal @praxisga.com vaibhav.tamrakar @praxisga.com M: +91 908 221 8254 M: +91 962 522 6697 Aryaman Tandon Abhishek Maiti For media queries, please Director, Gurugram Vice President, New Delhi aryaman.tandon@praxisga.com a bhishek.maiti @praxisga.com contact T: +91 11 4932 3564 M: +91 962 522 6702 Diksha Bhutani Parul Singhh Seema Karwa Ashutosh Somani Lead, Marketing and Communications Head, Marketing and Communications Vice President, Gurgaon Manager, Gurgaon marketing @praxisga.com pr @praxisga.com seema.karwa @pgalabs.com a shutosh.somani @praxisga.com M: +91 935 413 7148 M: +91 782 794 4926 M: +91 962 522 6696 M: +91 968 995 4290 Disclaimer: This material has been prepared by PGA Labs, which is the trade name of Praxian Global Private Limited (“Praxis”) with the in ten t to showcase our capability and disseminate learnings to potential partners/clients. This material can be referred to by the viewers on the internet but should be referenced to PGA Labs, if reused or adapted in any form or in any forum. The fr ame works, approaches, tools, analysis and opinions are solely Praxis’s intellectual property and are a combination of collection of best data we could find publicly, and Praxis team’s own experiences and observations. We make no representation or warranty, express or implied, that such information is accurate or complete, and nothing contain ed in here can be construed as definitive predictions or forecasts. Before reading further, the Recipient expressly agrees that this might not address any and all risks and challenges facing Recipient, its business and the markets within which it operates, nor all possible market conditi on s. No responsibility or liability whatsoever is accepted by any person including Praxis or its Business partners and affiliates and their respective officers, employees or agents for any errors or om issions in this document. This document is not complete without an accompanying oral discussion and presentation by Praxis though Praxis is not obligat ed to do so. Praxis does not have any duty to update or supplement any information in this document. Praxis shall not be responsible for any loss sustained by any person who relies on this presentation. © PGA Labs | 30 THANK YOU