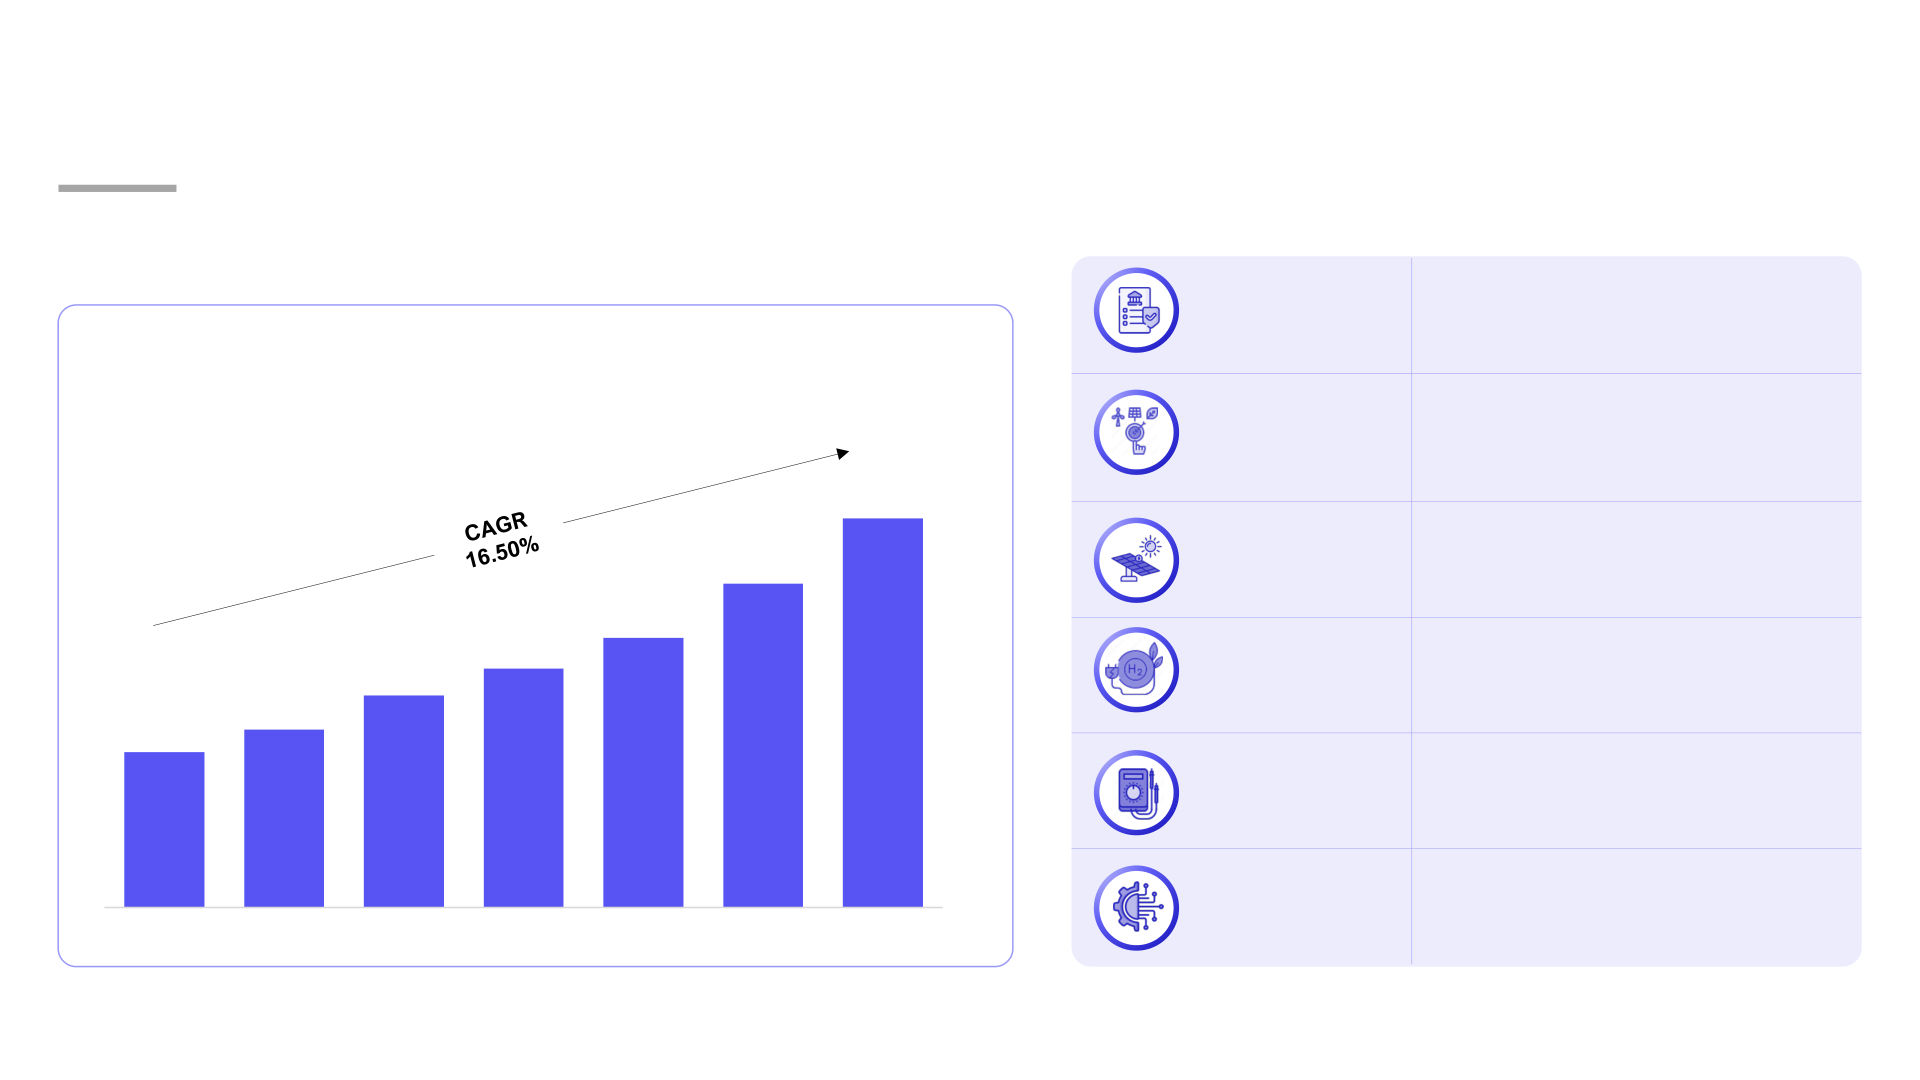
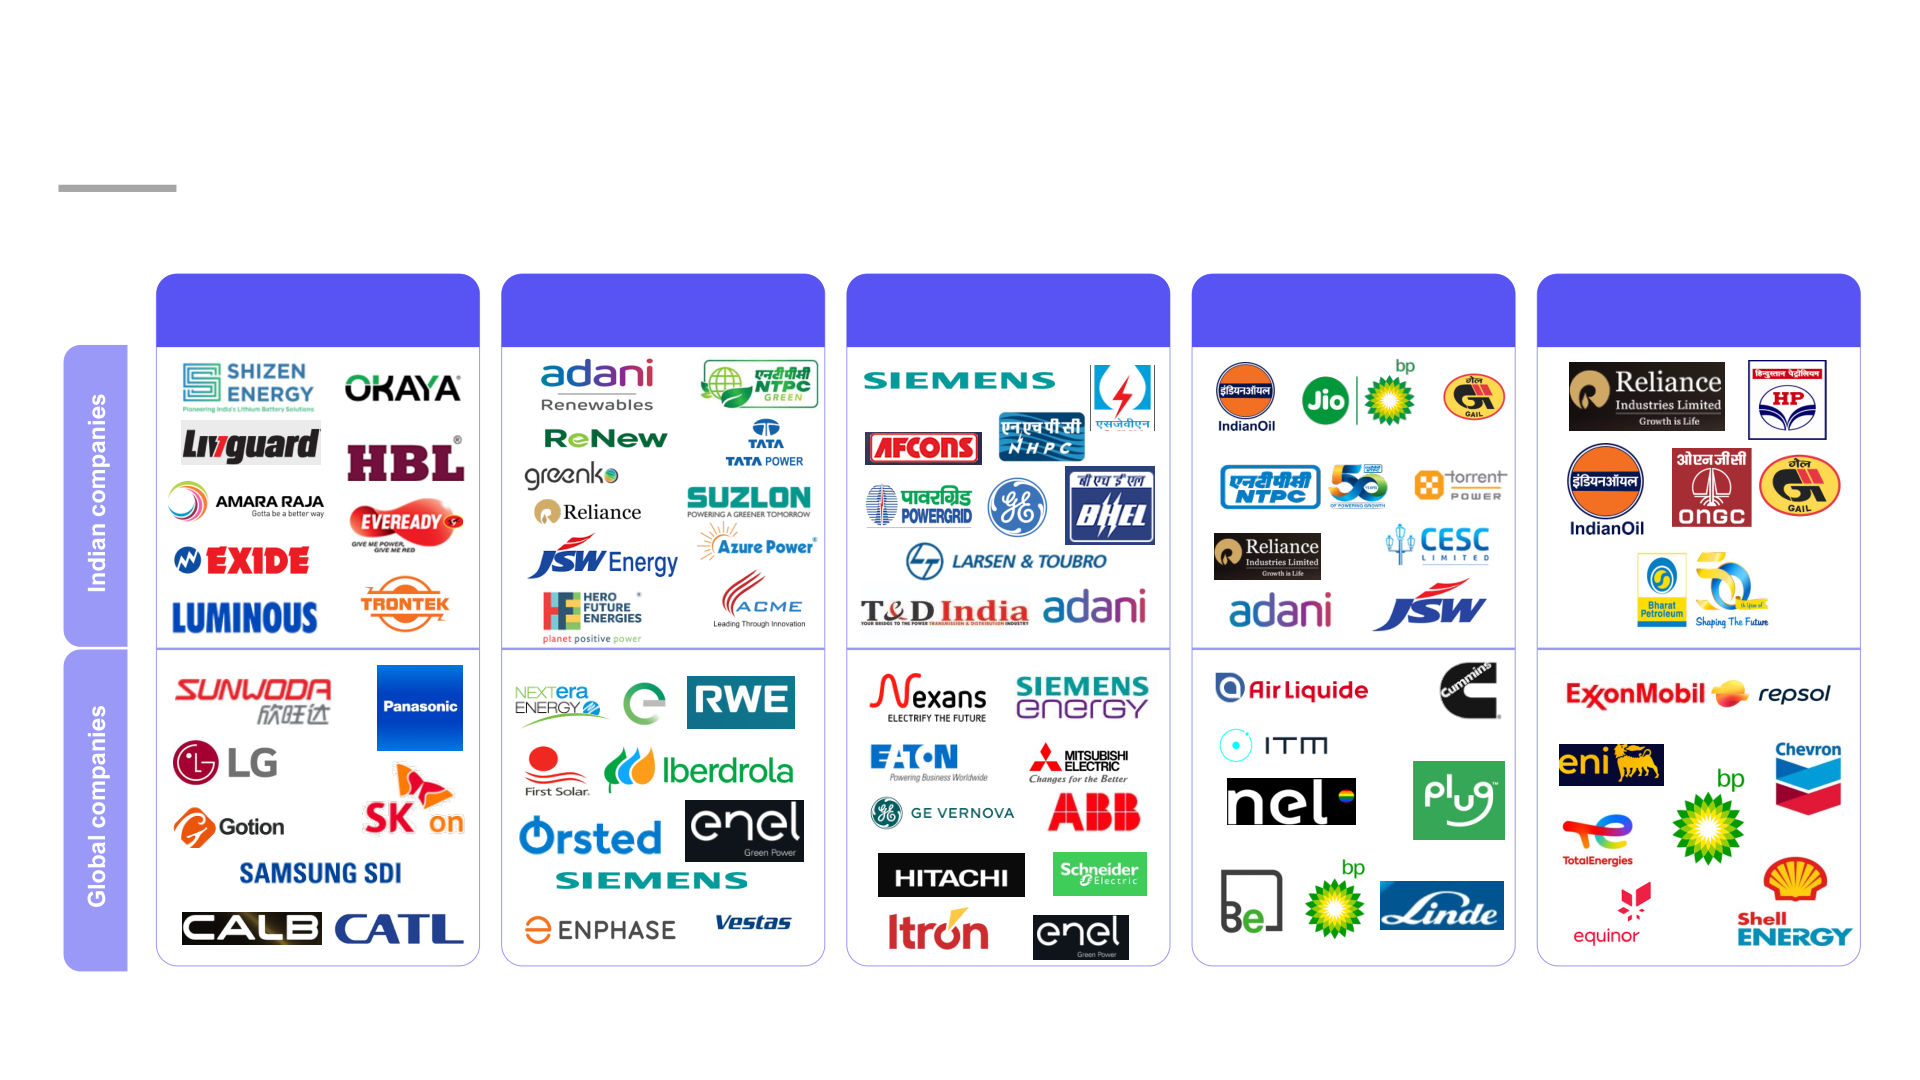
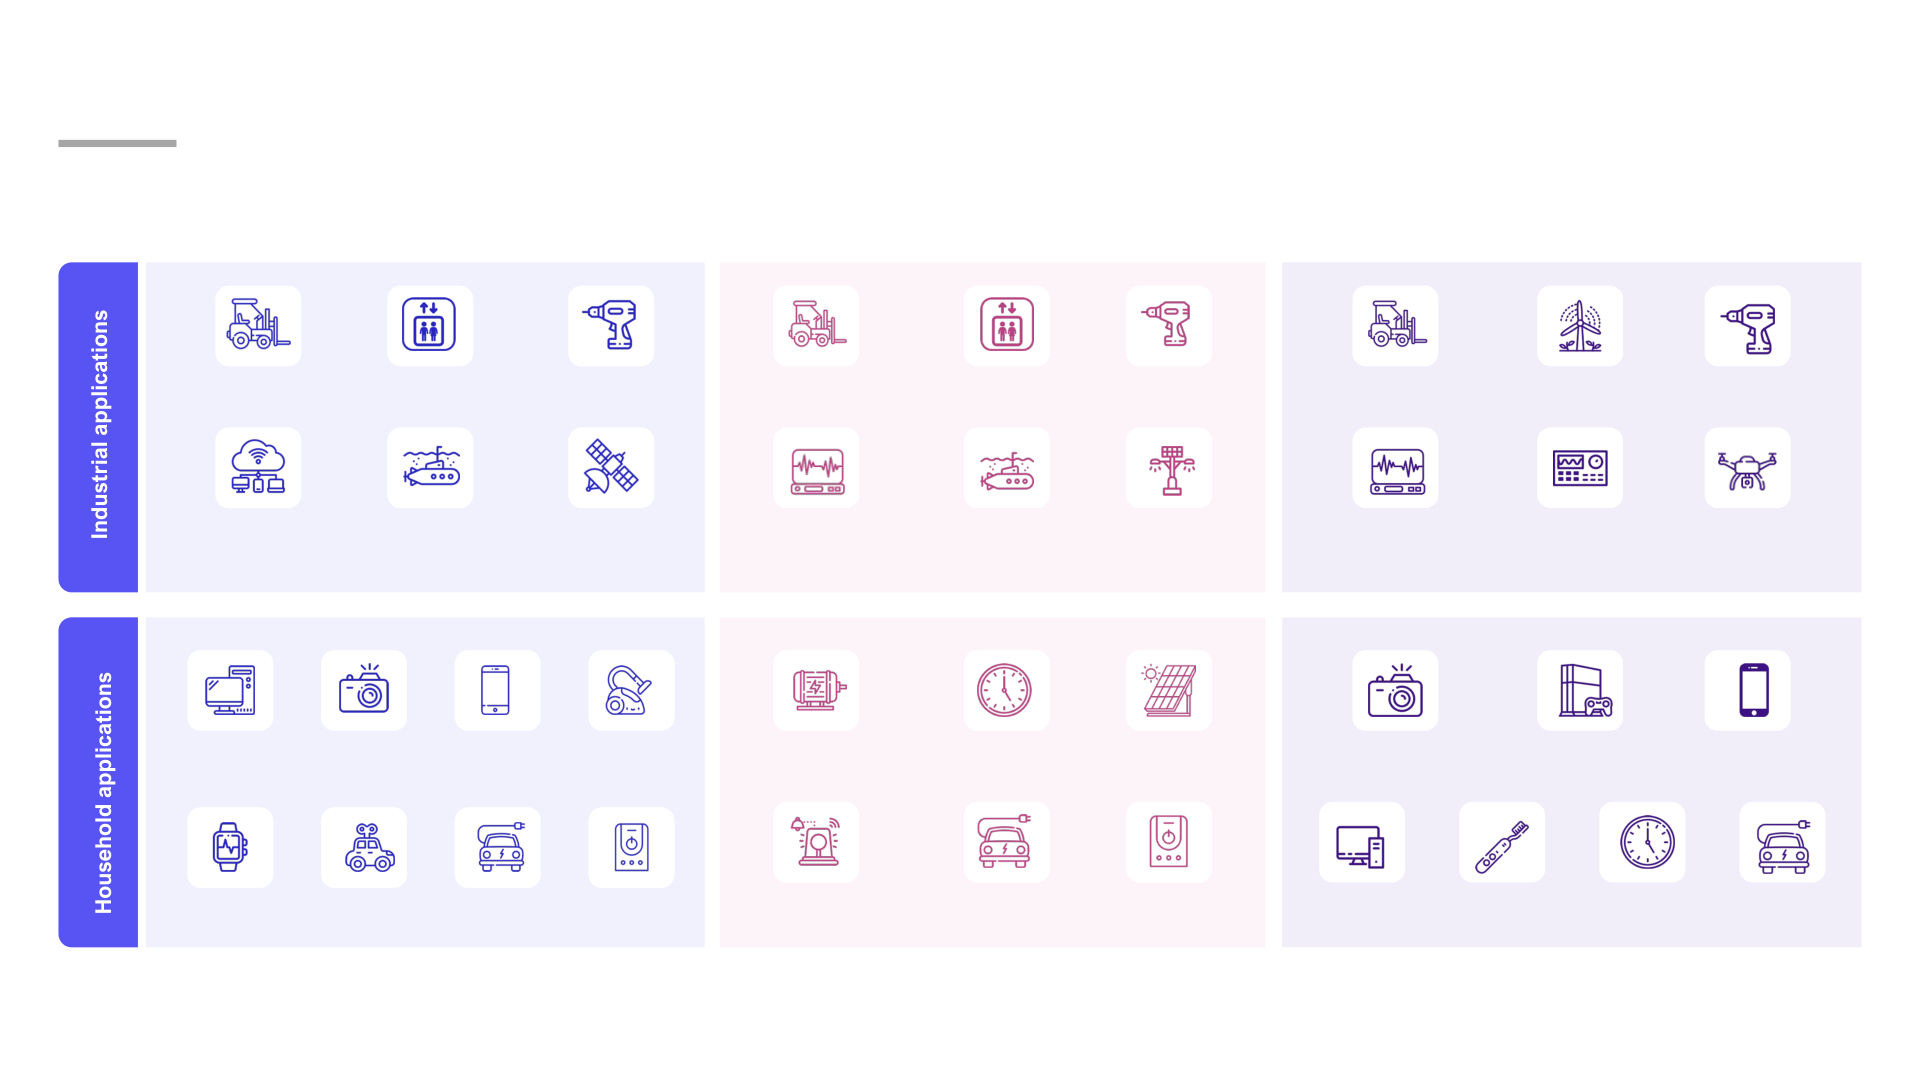
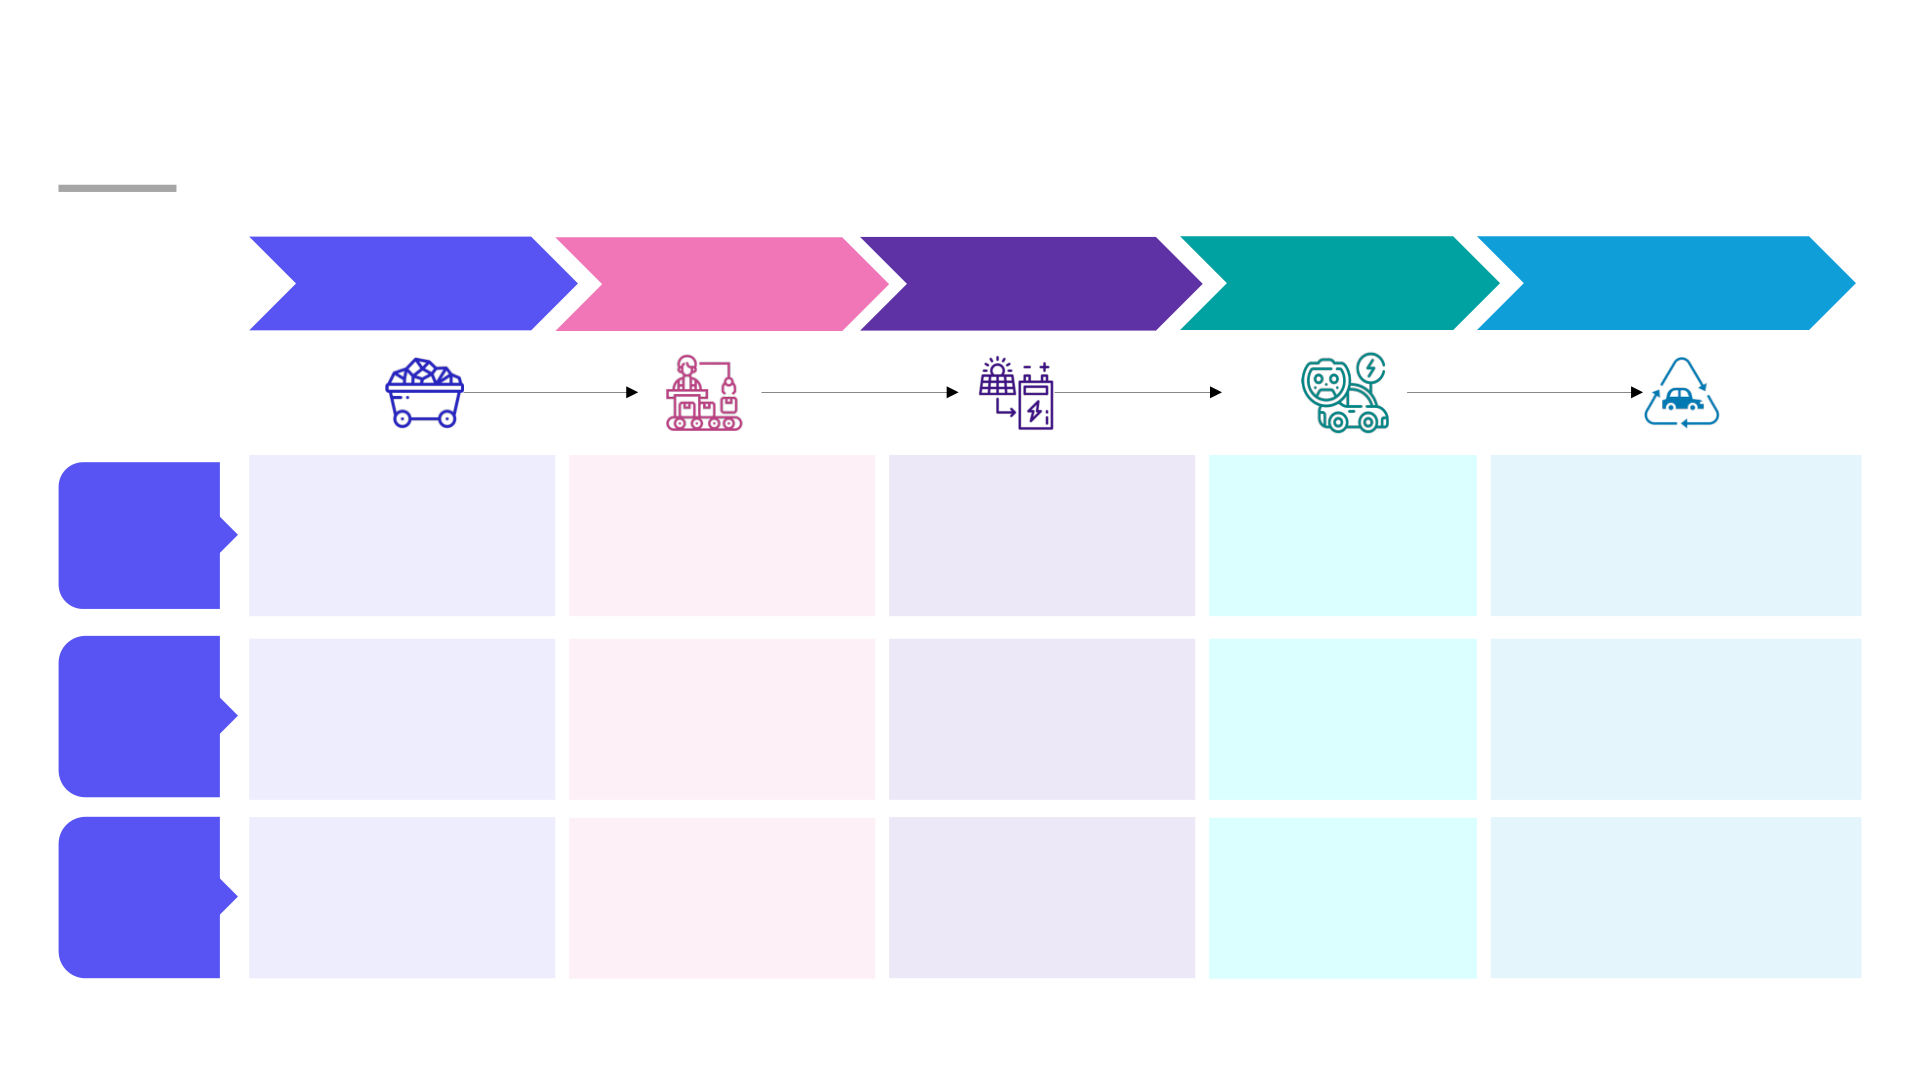
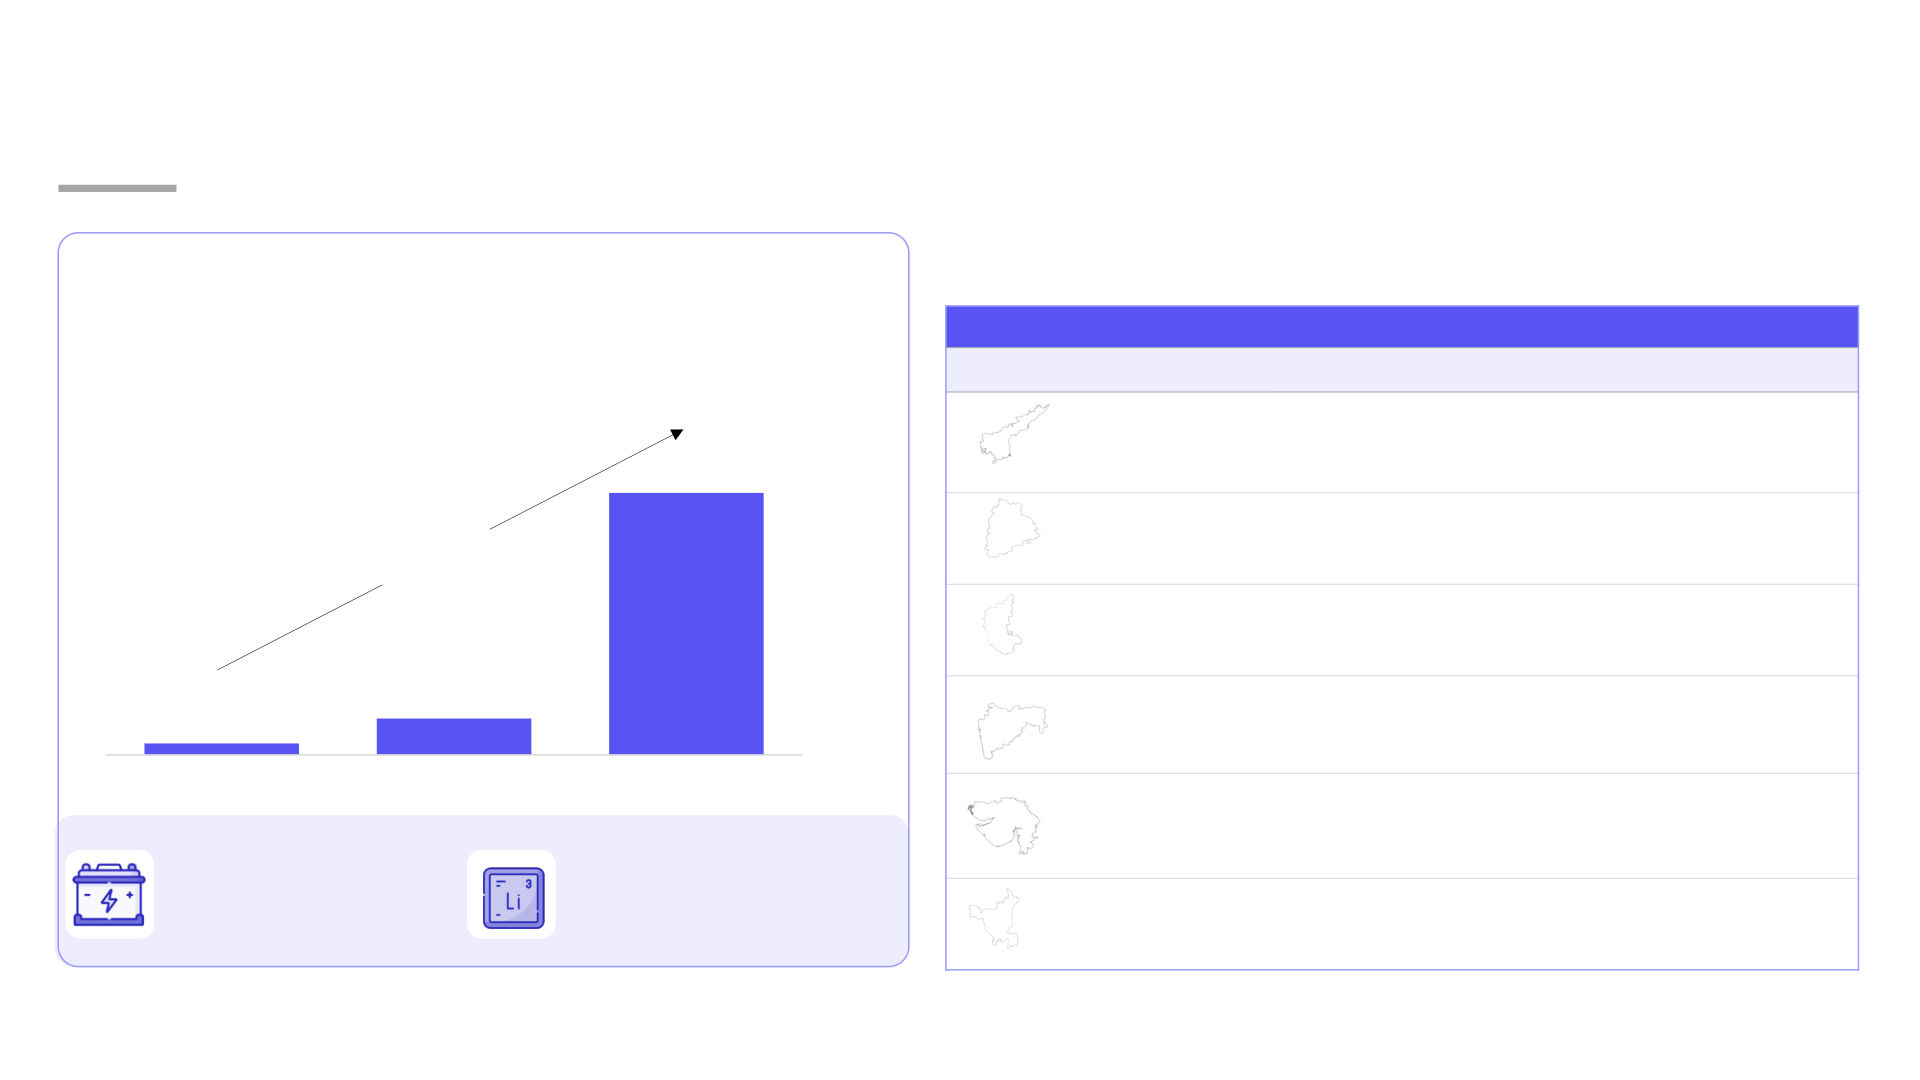
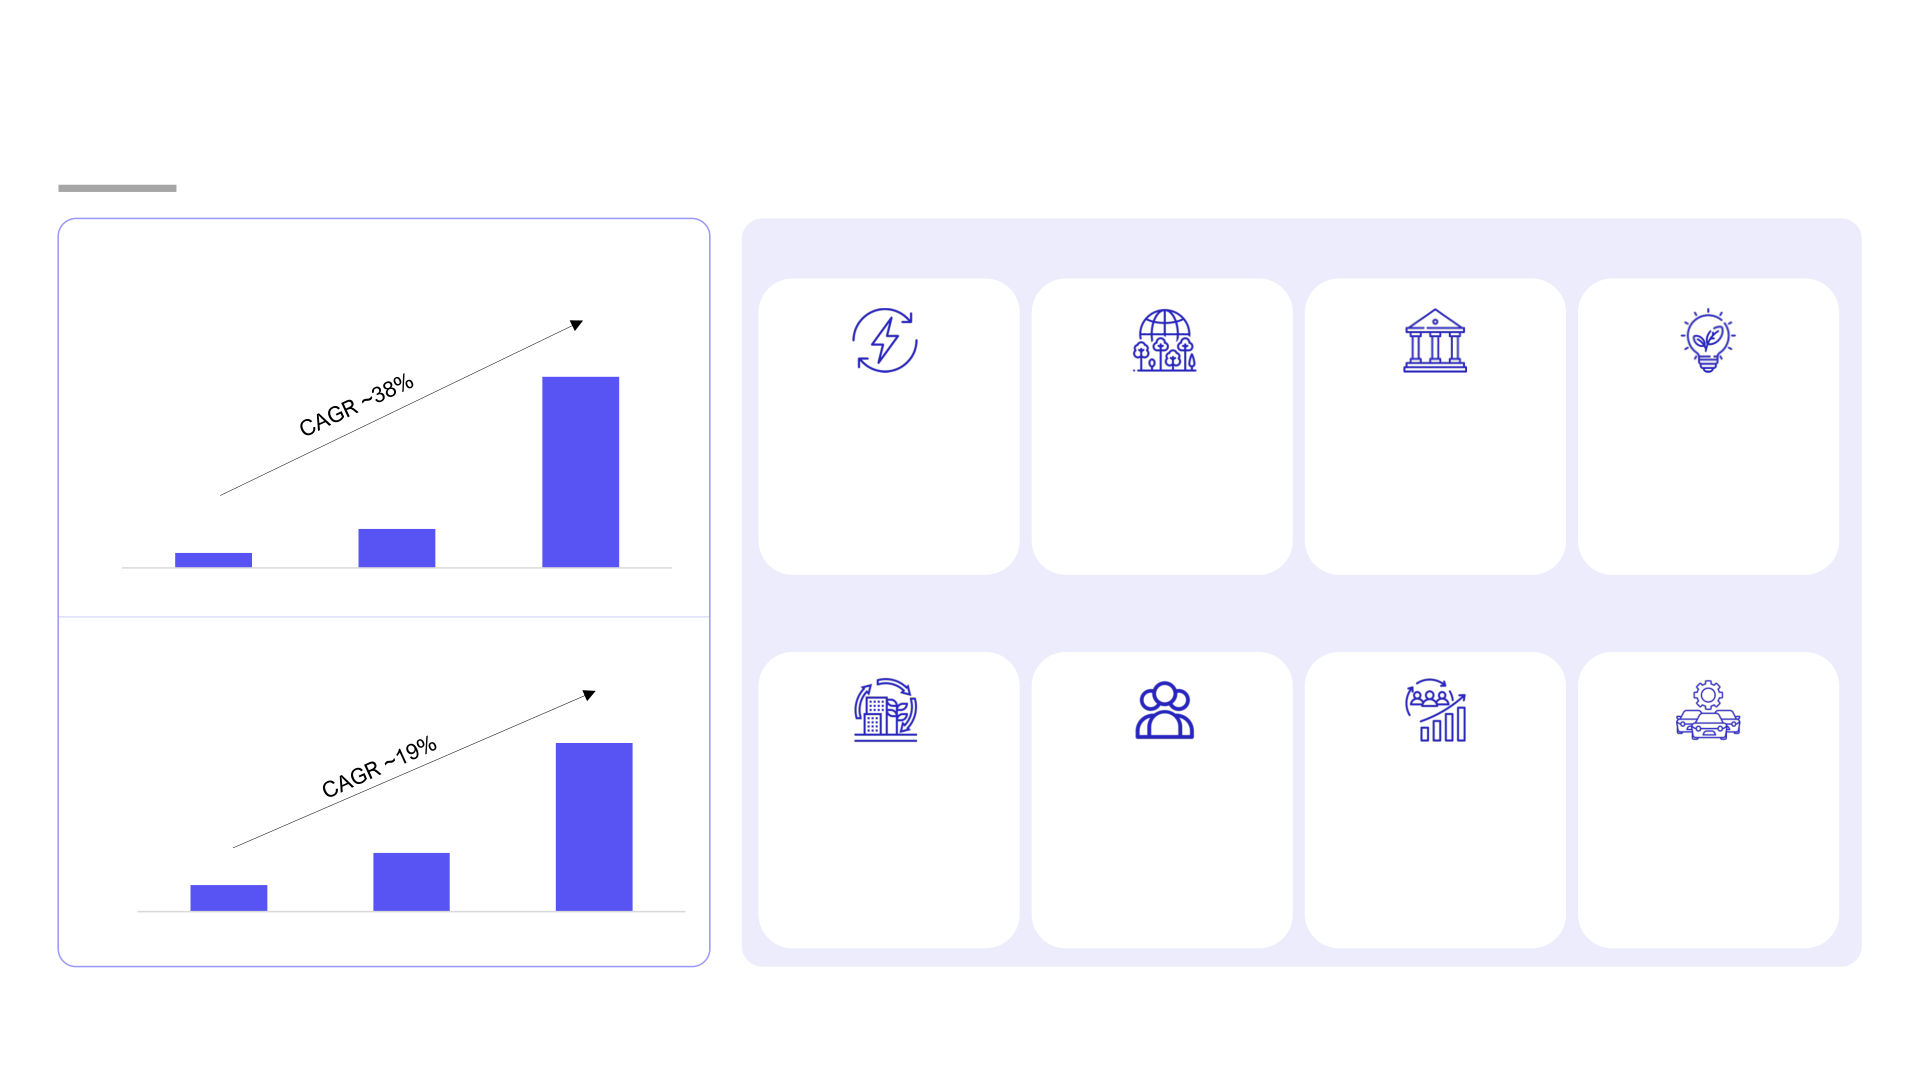
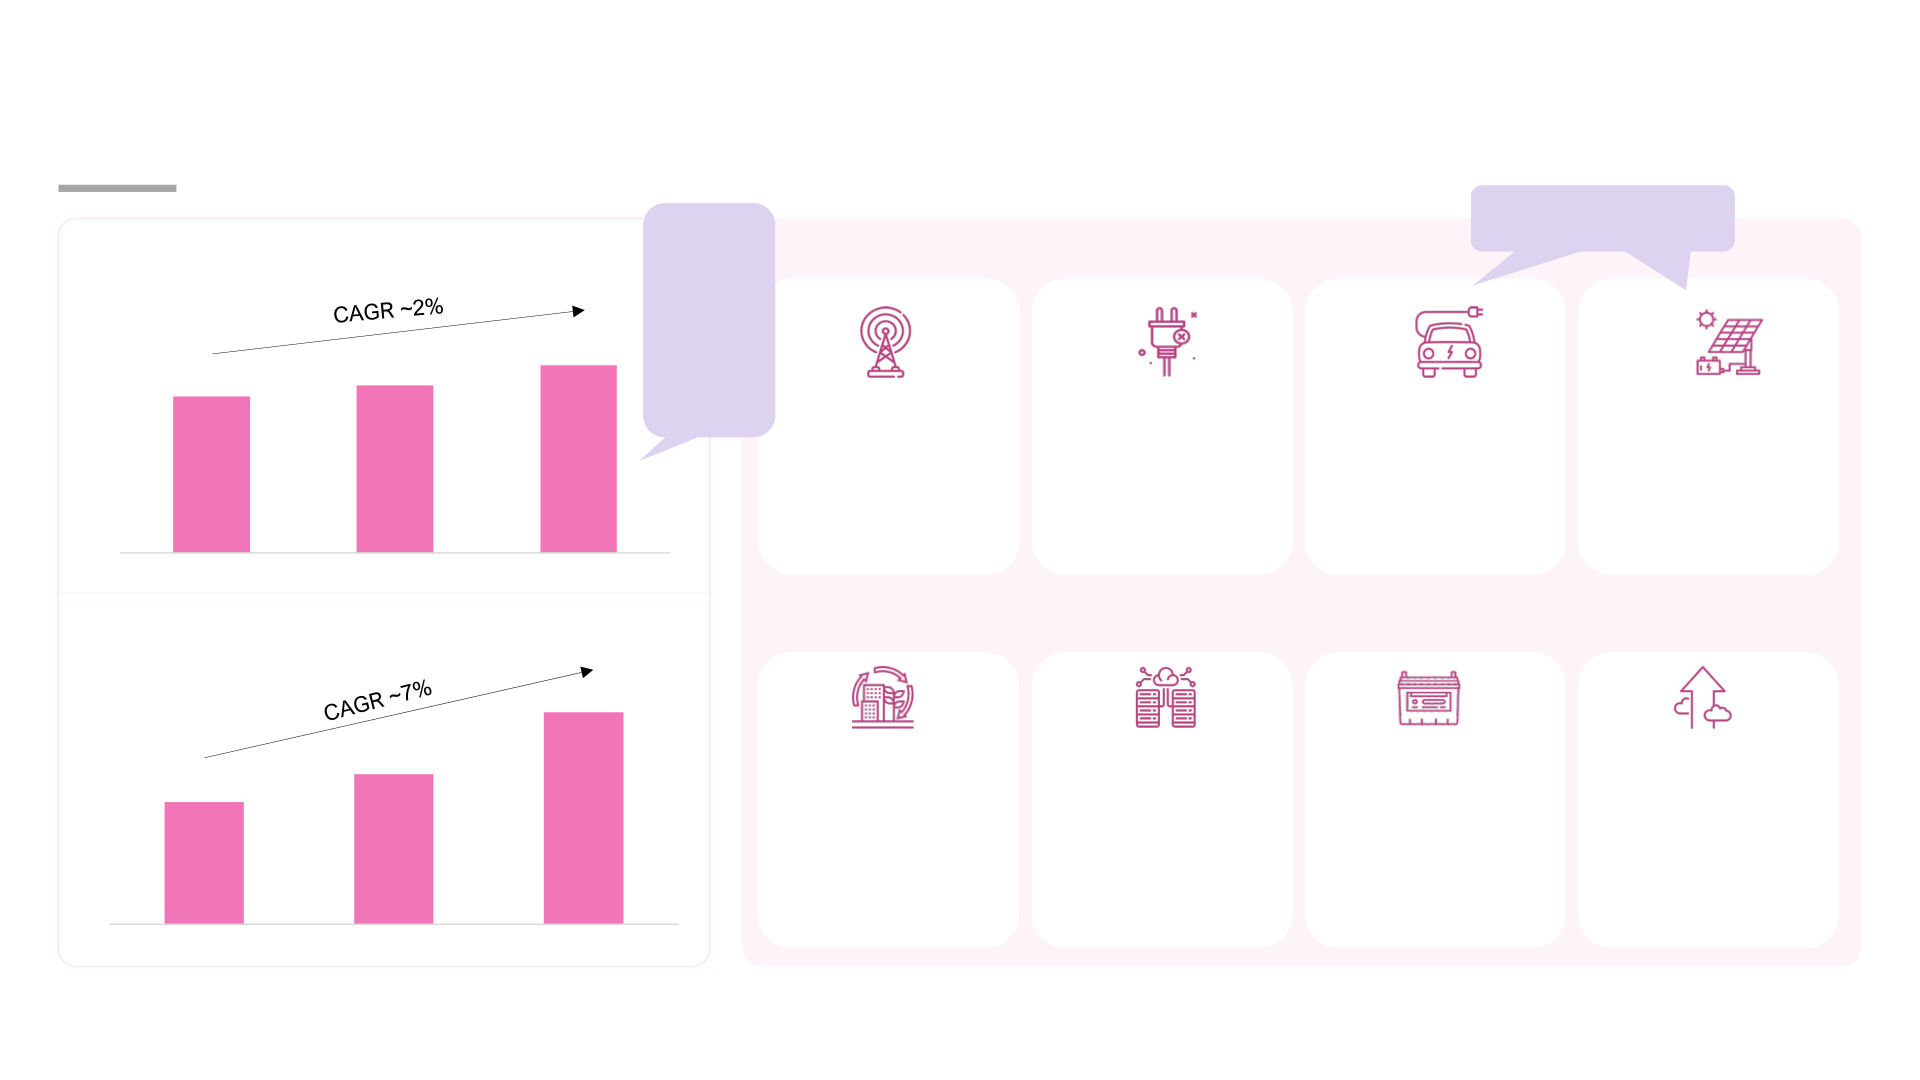
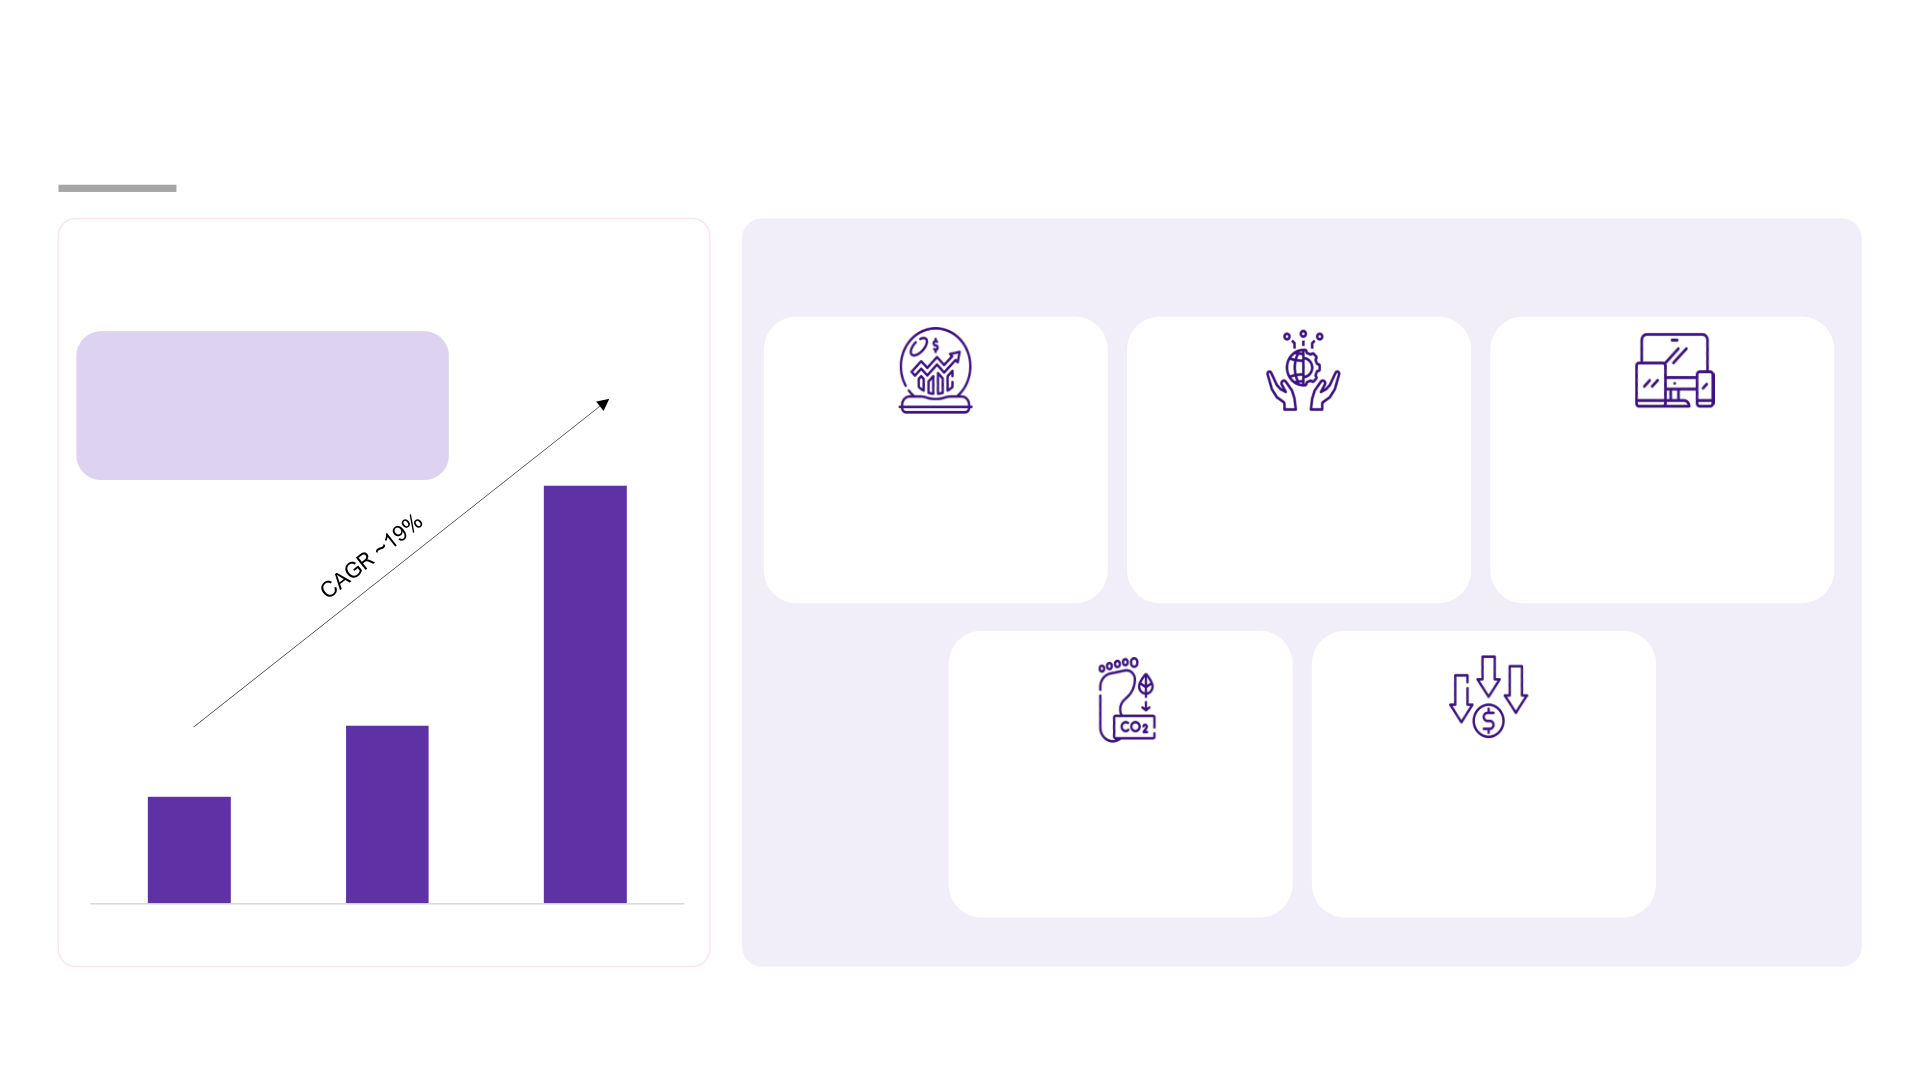
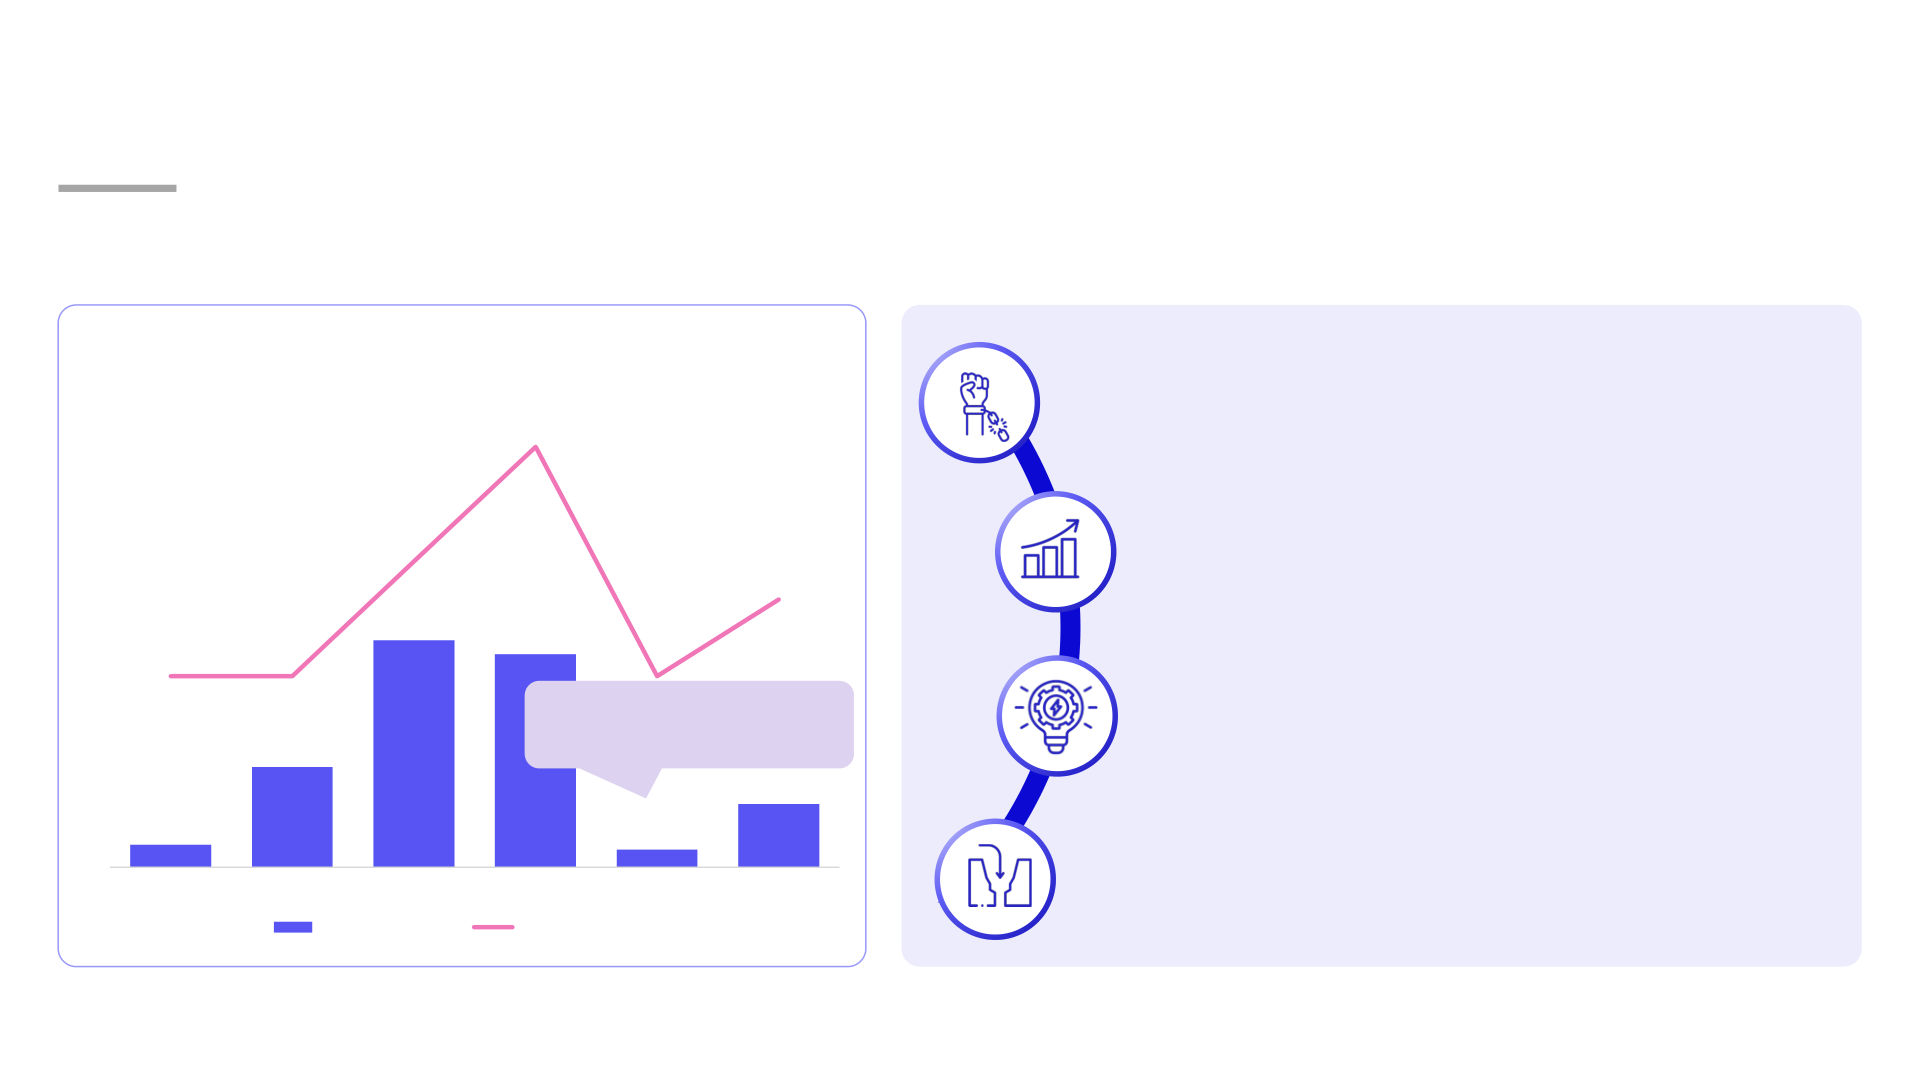
Foreword Industrial decarbonization and advanced battery technologies represent two converging frontiers of the global energy transition. As industries account for nearly a third of global emissions, decarbonizing manufacturing, materials, and logistics has become imperative to achieving net - zero goals . Simultaneously, battery technologies are redefining how energy is stored, distributed, and utilized, enabling renewable integration, industrial electrification, and sustainable mobility . This report presents a comprehensive view of India’s industrial decarbonization landscape , detailing sector - wise emission patterns, transition levers, and emerging business opportunities. It also explores the evolution of the battery ecosystem, from raw - material sourcing and manufacturing localization to R&D intensity, recycling, and policy enablement. Together, these insights reflect India’s growing strategic ambition to combine industrial competitiveness with climate responsibility. Through an in - depth analysis of policy frameworks, technology pathways, and market opportunities, the report underscores how India can position itself as a global hub for industrial decarbonization and battery innovation. With strong government Abhishek Maiti Abhishek Maiti commitment, private - sector agility, and a growing ecosystem of clean - tech startups, India is poised to lead the next industrial revolution, one defined by sustainability and Director - Technology & Internet, self - reliance . Industrial goods & services We hope this report informs strategic decisions, inspires collective action, and propels stakeholders toward a cleaner, smarter, and more resilient industrial future. Executive summary • Industrial activities contribute ~1,700 MtCO ₂ e annually, driven by sectors such as steel, cement, chemicals, and textiles • Decarbonization is no longer optional; it is central to achieving India’s net - zero by 2070 commitment Industrial • Transition levers include energy efficiency , fuel switching , carbon capture, utilization & storage (CCUS) , and digitalization decarbonization overview • India’s industrial decarbonization market is expected to expand from US$ 72 Bn in FY24 to ~US$ 180 Bn by FY30 , growing at a CAGR of ~16.5% • Supported by flagship schemes like PAT , FAME II , and SURYA , alongside state - level decarbonization and EV initiatives Policy & ecosystem • Bureau of Energy Efficiency (BEE) and MNRE initiatives are shaping technology adoption and industry compliance enablers • Rising investments across hydrogen, renewable energy, and circular manufacturing underline India’s systemic policy push • Batteries are emerging as a cornerstone for industrial decarbonization, enabling renewable integration , energy storage , and industrial electrification Battery technology • India’s battery demand expected to surge from ~3 GWh (CY22) to ~70 GWh (CY30) (~50% CAGR) landscape • The lithium battery market projected to reach US$ 32 Bn by CY30 , driven by EVs, storage systems, and Make - in - India initiatives • Parallel growth seen in lead - acid and nickel - metal hydride technologies for backup and hybrid uses • PLI Scheme and Make in India attracting major global players ( Suzuki, Toshiba, Denso, and Panasonic) into domestic manufacturing Localization, R&D • Localization drives import reduction , supply - chain resilience , and export competitiveness & investment trends • R&D investment remains below potential (0.64% of GDP), highlighting the need to bridge the “ Valley of Death ” between lab research and commercialization • Battery recycling expected to reduce lifecycle emissions by up to 35% by CY35 , while recovering critical minerals (Li, Co, Ni) Recycling & • Enhances material security, reduces dependency on imports, and aligns with EU Battery Regulation & US IRA frameworks circular economy • Co - located recycling hubs near gigafactories will create closed - loop ecosystems supporting India’s sustainability goals transition • Recycling is set to become the next growth frontier for India’s clean - tech manufacturing economy Product in Spotlight: 1Insights This report was curated using 1Insights , 1Lattice’s proprietary market intelligence platform that powers data - backed analysis across sectors. It provides an in - depth view of India’s industrial decarbonization landscape and advancements in battery technologies , covering key themes such as sectoral emission patterns, growth drivers, government initiatives, technology pathways, and emerging opportunities in energy storage and recycling . 1/2 Agenda • What was the estimated industrial sector CO ₂ equivalent emission in India during FY23, & why does it underscore the urgency for Need for decarbonization? decarbonization • How does industrial decarbonization align with India’s national net - zero targets? • What role does energy efficiency play in reducing industrial emissions? Industrial Key levers for • How can biomass, green hydrogen, & electrification contribute to fuel switching in heavy industries? decarbonization decarbonization • What is Carbon Capture, Utilization, & Storage (CCUS) in India's decarbonization journey? • What is the projected growth of India’s industrial decarbonization market from 2024 to 2030, & what CAGR does this reflect? Market outlook & opportunities • Which sectors are likely to drive the highest demand in India’s emerging decarbonization market? • What are the key stages in the conventional battery value chain? Battery basics & value chain • How does the battery value chain impact supply sustainability & cost efficiency? • What are the primary use cases for lithium - ion, lead - acid, & nickel - metal hydride batteries in the household & industrial sector s? Types & applications • How do battery chemistries influence their application suitability in different environments? • What are the three essential components of a battery, & how do they work together to produce electrical energy? Battery structure & Battery functioning • How does the chemical - to - electrical energy conversion process differ across battery types, if at all? technologies • Why is the recycling rate of lead - acid batteries (~98%) significantly higher than that of lithium - ion batteries (~50%)? Recycling & • What factors make nickel - based batteries more suitable for reuse despite lower recycling rates? reusability • How does battery recycling support environmental sustainability & circular economy goals? • What factors are driving the recent surge in battery manufacturing investments across multiple Indian states? India’s Manufacturing Push • How can increased domestic battery production influence India’s position in the global EV & energy storage market? © 1Lattice | 5 2/2 Agenda • What is the projected market size of lithium - ion batteries in India by CY2030, & what CAGR is this growth based on? India's battery • How does the expected growth of the lead - acid battery market in India compared to that of lithium - ion batteries? market growth • What factors might be driving the significantly higher CAGR of lithium - ion batteries over lead - acid ones in India? • What is the estimated global market size for lithium - ion batteries by 2030, & how does its CAGR compare to that of nickel - metal hydride batteries? Global battery • Despite a lower CAGR, why might the global lead - acid battery market remain relevant through 2030? market trends • What global trends are influencing the accelerated growth of nickel - metal hydride & lithium - ion battery technologies? Battery technologies Policy & • What is the value of India’s PLI (Production - Linked Incentive) scheme for EV batteries, & how might it benefit domestic battery production? government • Which countries besides India are actively supporting battery R&D, & what strategies are they adopting to stay competitive? support Research & • How are Indian academic institutions contributing to the advancement of next - generation battery technologies? development • Why is investment in R&D critical for India’s long - term battery ecosystem development? initiatives © 1Lattice | 6 Overview A sectoral deep dive into India’s industrial emissions landscape, classified into major & minor industries • Stem from fuel combustion, chemical reactions, & material handling 1 Industrial emissions are GHGs released from manufacturing, • These emissions are major contributors to carbon footprints, making construction, mining, & raw material processing decarbonization both a challenge & an opportunity Key sectors contributing to India’s industrial emissions Sectors Source of emissions Description • High energy - intensive processes Steel • Fossil fuel combustion in furnaces, sintering, coke ovens • Vital for construction & infrastructure growth • Major contributor due to process emissions Cement • Calcination of limestone & fuel use in kilns • Essential for real estate & public works • Use of fossil fuels & process emissions from fertilizer, plastics, & • Supports agriculture & manufacturing Chemicals & fertilizers refineries • Contributes to both energy & process - related GHGs 2 • A large MSME driven sector with dispersed but cumulative Textiles & apparel manufacturing • Energy use in dyeing, washing, & finishing processes emissions • Generates CO ₂ through thermal treatment & contributes to Non - metallic minerals • Processing of glass, ceramics, & lime construction - related emissions • Emissions from combustion of biomass & chemicals used in • Resource & water - intensive Paper & pulp bleaching & pulping • Growing demand for packaging increases pressure on emissions Food & beverages • Emissions from boilers, refrigeration, & processing units • Expands with urbanization & changing consumption • Supplies raw materials for multiple industries Mining & quarrying • Diesel combustion in machinery & dust emissions • Indirect emissions from transportation Construction • On - site fuel use, material transport, & cement - based products • Rapid urban expansion is increasing its carbon intensity • Broad category decarbonization efforts can create large Manufacturing (general) • Energy use in machinery & operational inefficiencies cumulative impact 1 2 Note(s): Green house gases, Micro, small, & medium - sized enterprises, Industry sectors have been classified into major & other industries according to the G HG emission contribution © 1Lattice | 8 Source(s): IEA reports, 1Lattce analysis Emissions data India’s industrial emissions touched ~1,700 Mt CO2 equivalent in FY23, underscoring its pivotal role in global climate action 1 India’s industrial GHG emissions by sectors, (FY23)* Major emission growth drivers % contribution Parameters Rationale Sectors Components • Expansion of sectors like steel, cement, & Rapid industrialization chemicals increases process & energy - related emissions 2 ₂ ₂ • The remaining ~ 847 Mt CO equivalent comes from Other industries • Rising energy demand Higher output drives greater reliance on coal & ~49% various industrial processes like mining, paper, fossil fuels for power & heat generation ceramics, metallurgy etc. • Urban infrastructure Growing demand for construction materials development leads to emissions - intensive manufacturing • A major export - linked sector, emits around ~ 100 Mt Textiles & manufacturing ₂ ₂ ~6% CO equivalent or 6% of industrial emissions • Lax implementation of emission norms & ~7% Weak regulatory ₂ ₂ • Contribute approximately ~ 110 Mt CO equivalent or monitoring contributes to unchecked industrial Chemicals & fertilizers enforcement 7% of India’s industrial emissions pollution ~14% • With ~ 235 Mt CO ₂ ₂ equivalent, accounting for 14% of Cement & construction the national industrial emissions Limited clean tech • Slow adoption of energy - efficient processes & adoption renewable sources increases carbon intensity ~24% • Is the largest industrial emitter, contributing ~ 408 Mt CO ₂ ₂ equivalent or 24% of India’s industrial GHG Steel Dependence on coal • Industrial thermal energy demand is still emissions heavily reliant on coal due to cost & availability 1 2 Note(s): Green house gas, Million tons of carbon dioxide equivalent, *Last updated data till FY23 considered for the analysis © 1Lattice | 9 Source(s): Industry publications, media articles, MoEFCC , PIB, 1Lattice analysisz Industries in focus Steel, cement & construction, chemicals & fertilizers, & textile & manufacturing are key sectors driving decarbonization efforts Steel Cement & construction Chemicals & fertilizers Textile & manufacturing • Green H ₂ ₂ - based DRI* & EAFs** • Clinker substitution • Green hydrogen feedstock • Renewable energy integration – Replace coal with clean hydrogen & electricity, – Use of fly ash / slag reduces high - emission – Replaces grey hydrogen in ammonia / – Displaces coal - based grid power in cutting process CO ₂ by up to 90% clinker content, cutting up to 30% CO ₂ /t urea, avoiding ~10 t CO ₂ /t H ₂ energy - intensive mills • Scrap recycling cement • Process electrification • Energy - efficient machinery & – Lowers demand for virgin iron ore & coal, • Renewable energy & waste heat – Switches chemical production from digitalization Key reducing energy intensity by ~60% fossil to renewable electricity recovery – Lowers energy consumption/unit of trends • CCUS*** pilots – Displaces fossil fuels in energy - intensive • Bio - based/circular feedstocks output – Capture furnace CO ₂ that is otherwise kilns – Reduce dependence on • Water & fibre circularity unavoidable petrochemicals & lower lifecycle • CCUS*** at kilnsz – Reduces upstream resource use & emissions – Addresses process emissions (~60% of associated emissions cement’s CO ₂ emissions) • First in India to test hydrogen injection in • Operates one of world’s lowest carbon • Piloting green ammonia & green • 43% power from renewable / low - carbon Case blast furnace cement plant ( Dalmiapuram ) urea using renewable energy + sources during FY24 study 1 • CCUS capacity of 0.5 Mt CO ₂ /yr • Investing in scrap - based EAF** route electrolyzers • Exploring new age manufacturing facility # – Potential to cut 7 – 10% CO ₂ /t steel – Potential 1.6 - 2 t CO abatement / t • Pledge for carbon - negative by CY40 2 capable of reducing GHG emissions ammonia annually upto 93% • ~US$ 1.3B green steel program • Reduced clinker factor to <70% • Renewable - powered ammonia pilot • Solar powered plants Case 1 • MoUs for CCUS*** & H supply – ( Vs global average 75%) with electrolyzers • Water - efficient processing, reducing 2 study 2 – 2 – 3 t CO ₂ avoided/t ammonia • Reduce carbon intensity by 45% by CY30, • 600+ MW renewable energy capacity water consumption by 15 - 20% • 15 – 20% CO ₂ intensity reduction achieved compared to CY05 levels • Target for 100% carbon neutrality by CY50 Note(s): *Direct reduced iron, **Electric arc furnace, ***Carbon Capture Utilization & Storage, # Greehhouse gas Source(s): Company websites, industry publications, media articles, 1Lattice analysis © 1Lattice | 10 India market size India’s decarbonization market is estimated to reach ~US$ 180B in FY30 from ~US$ 72B in FY24, growing at ~16 CAGR during FY24 - 30 Key growth drivers India decarbonization market is expected to grow at ~16.50% CAGR from ~US$ 72B in FY24 to ~US$ 180B by FY30 1 • National target of 500 GW non - fossil fuel Rapid renewable capacity by 2030 catalyzing massive solar & energy expansion India decarbonization market wind scale - up . (US$ B, FY24 - 30P*) • Sets the long - term policy signal, prompting National net - zero early investment in clean infrastructure & target (2070) innovation. 180.6 PLI schemes for • Incentivizing domestic manufacturing of solar 150.3 clean tech modules, batteries, green hydrogen, & EVs 125.1 110.9 2 • Targets 5 MMT of annual production, Green hydrogen 98.3 unlocking decarbonization across hard - to - mission abate sectors like steel & refining. 82.6 72.0 Electrification of • EV adoption, electric freight corridors, & clean transport & cooking are reducing sectoral carbon intensity. industry Growing corporate • Indian conglomerates (e.g., Reliance, Adani, net - zero Tata) committing to net - zero, investing in low - declarations carbon technologies. FY24 FY25 FY26P FY27P FY28P FY29P FY30P 1 2 Notes(s): Gigawatt, M illion M etric T onnes Source(s): Industry publications, media articles, 1Lattice analysis © 1Lattice | 11 Government policies Indian government is taking active steps to accelerate decarbonization at both national & state levels like PAT scheme, FAME II, SURYA scheme, & Delhi EV policy Government Policy/scheme D escription Impact on decarbonization ~74.6 MT of carbon emissions were upon the 1 Central Market - based mechanism under BEE targeting energy - intensive st • PAT Scheme (Perform, Achieve & Trade) completion of the 1 two PAT cycles; incentivizing industries to improve efficiency energy - saving certificates trading 2 National scheme to promote EV adoption via subsidies for 2W, • FAME II (Faster Adoption & Manufacturing EV sales of ~16.1L EVs supported by CY25; boosting 3W, e - buses, & charging infrastructure with a budget outlay of of Hybrid & Electric Vehicles) demand - side decarbonization in transport sector ~INR 11.5K Cr. Scheme launched with a budget outlay of ~INR 19.7 Cr. to Targeting ~5 MT green hydrogen per annum by • National Green Hydrogen Mission position India as a global hub for green hydrogen production & CY30, creating demand for electrolyzers & exports renewables Foundational policy built to support the EV • National Electric Mobility Mission Plan Long - term EV roadmap launched in CY13 to achieve national ecosystem , significantly reducing reliance on fossil (NEMMP) fuel security by promoting hybrid & EV adoption fuels Launched to provide rooftop solar installation subsidies for ~1.4L solar rooftop systems with an aggregate State • SURYA Gujarat Scheme residential consumers capacity of ~550.2 MW were installed in CY25 Purchase incentives , scrappage policy & charging infrastructure • Delhi EV Policy support, with an aim to ensure that 1 in 4 vehicles sold in Delhi in ~3.8 MT of carbon emission avoided since CY13 CY24 is an EV • Andhra Pradesh Green Hydrogen & Launched to promote green fuel production , targeting an annual Expected to contribute ~5% to India’s total green Green Ammonia Policy production of ~2M tons of renewable ammonia by CY28 hydrogen production of 1.5 MT by CY30 CY30 Aimed to ensure that Rajasthan emerges as a major contributing Rajasthan has emerged as a state leader in India's • Rajasthan Integrated Clean Energy Policy state in order to achieve the national target of 500 GW capacity solar energy production, with a production of ~18GW of renewable energy in early CY24 1 2 Note(s):, Bureau of Energy Efficiency, Electric vehicles Source(s): Bureau of Energy Efficiency, FAME India Scheme, Press releases, Bloomberg NEF, 1Lattice analysis © 1Lattice | 12 Levers Energy efficiency, fuel switching, CCUS & digitalization are the key strategic levers for industrial decarbonization Architecting a net - zero industrial future – core transition pathways 1 Lever Definition Strategic foresight Time to impact Cost curve Scalability Strategic priority • Minimizing energy waste through process • Low - hanging fruit with high ROI. optimization, equipment upgrades, & AI - • Efficiency is not just a cost saver — it’s a Energy powered monitoring carbon eliminator at scale. Future - ready Immediate Low High efficiency industries will embed efficiency KPIs into every operational layer Choosing cleaner alternatives like: • Decarbonization is a materials & • Biomass: Circular & carbon - neutral for molecule transition . The future hinges heat - intensive operations on regional fuel - switch readiness, grid • Hydrogen: Particularly green hydrogen, decarbonization, & energy storage Fuel enabling clean combustion in steel, refining, innovations Mid - term Medium Medium switching & ammonia • Electrification: Replacing fossil heat & process energy with renewables - powered electricity • Capturing CO ₂ from high - emission point • CCUS is the insurance policy for hard - sources & either storing it underground or to - abate sectors . Early movers will converting it into usable products (e.g., influence carbon markets, offset CCUS Long - term High Selective synthetic fuels, construction materials) strategies, & future regulations • Deploying digital platforms, sensors, & • Tomorrow’s zero - carbon industry will advanced analytics to enable real - time be software - defined . Digital Digitalization Ongoing Medium High emissions monitoring, process control, & decarbonization is not an add - on — it’s AI - driven optimization the core operating system 1 Note(s): Priority rankings (1 star = low, 5 star = high) Sources: IEA, IPCC, 1Lattce analysis © 1Lattice | 13 Key companies Indian & global companies in the decarbonization; investment flows & spotlighting key players accelerating the net - zero transition Companies committed to decarbonization Hydrogen & Alternative Grid & Infrastructure Renewable Energy Batteries Oil & Gas Transition Fuels Source(s): Company website, Press releases, FAME 2 India Policy, MNRE.gov , 1Lattice analysis © 1Lattice | 14 Upcoming alternative EV batteries Batteries are accelerating industrial decarbonization by enabling reliable renewable energy use, flexible grid operations & smart energy management Batteries accelerate industrial decarbonization • Battery storage is enabling industries to draw power from renewables even during non - generation hours, cutting dependence on fossil fuels & lowering carbon intensity Integration of 1 2 renewable energy • The Central Electricity Authority projects ~32 GW /160 GWh battery capacity by CY30 to back India’s 500 GW renewable target, reinforcing the role of storage in achieving deep decarbonization • Battery energy storage systems (BESS) are driving electrification of key industrial processes by supplying clean, stored renewable power, replacing fossil - fuel - based energy sources Electrification of 3 industrial processes • With this, BESS can enable electrification of high - temperature industrial processes (~700 - 1,600 ° C), helping sectors like steel & cement transition to low carbon emission, which otherwise generate ~ 35% of industrial CO ₂ emissions • Battery systems are transforming peak load management by supplying stored renewable power during high - demand periods, exemplified by Delhi’s 4 5 6 20 MW / 40 MWh BESS project by BRPL , which now stabilizes the city’s complex load profile Peak load management 7 & grid flexibility • Similarly, SECI ’s flagship 40 MW / 120 MWh BESS installation in Chhattisgarh, paired with a 152 MWh solar plant, demonstrates how large - scale storage enhances grid flexibility & enables carbon - free power dispatch during peak hours • Thermal energy storage (TES) is enabling industrial decarbonization by providing long - duration, high - temperature energy on demand, reducing reliance on fossil fuels for continuous process heat Thermal energy 8 9 storage • It is widely being adopted, in large - scale tests & projects like NTPC Dadri’s phase - change material test & L&T’s CSP - based hybrid solutions, showcasing their potential for industrial load balancing & its ability to mitigate supply chain risks by using abundant local materials • Batteries are driving circular & smart energy systems by storing surplus renewable power & enabling 24/7 clean energy supply, reducing industrial reliance on fossil fuels Enabling circular & smart energy systems • ReNew’s 3.3 GW Round - the - Clock Hybrid Renewable Energy Project, integrating wind, solar & a 100 MWh BESS across Rajasthan, Karnataka, & Maharashtra, demonstrates how large - scale storage addresses intermittency while creating a smart, decarbonised industrial energy ecosystem 1 2 3 6 7 Note(s): Gigawatt, Gigawatt hour, Battery energy storage systems, 4Megawatt, 5Megawatt hour, BSES Rajdhani Power Limited, Solar 8 9 Energy Corporation of India, National Thermal Power Corporation, Concentrated solar power, 10 © 1Lattice | 15 Energy storage applications across industries Battery & thermal storage solutions drive industrial electrification & renewable adoption, enabling significant CO reduction across sectors 2 Industry - specific applications of energy storage technology Industry Energy storage technology Application / impact CO reduction potential 2 Batteries accelerate industrial decarbonization 1 2 • Large - scale BESS (Li - ion or second - life) • Enable a higher share of renewable electricity in EAF / • By integrating storage + renewables, potential to reduce electricity / 3 for load - shifting & peak shaving DRI operations fuel emissions by tens of % in steel sites Steel • Novel gravity - energy storage using idle • Improve grid stability , reduce reliance on diesel gensets • E.g , Cost - optimised gravity system reduced energy cost steel billets significantly (steel industry park case) • Cost savings via peak - valley arbitrage (steel plant case) • Thermal - energy storage (high - temp heat • Electrify calciner / kiln operations using stored • Integrating TES + renewable electrification achieved ~70% to ~83% 4 batteries, thermochemical TES ) coupled renewable - electricity heat sources emission reductions (including indirect electricity) in cement Cement & with electric heating manufacturing • Smoother supply of high - temperature heat, reduce fossil construction • BESS + renewables to supply fuel combustion • Kiln electrification noted as pathway to ~40% reduction of thermal decarbonized electricity for kilns emission share • BESS for peak / load management in • Replace fossil - fuel - driven boilers / crackers with • Depending on baseline, major fractions of process - heat emissions chemical plants electrified heat channels supported by storage can be reduced (for specific steps) though full quantification varies by plant • Thermal - storage (electric - heat storage) to • Store renewables when abundant , deploy when needed Chemical & drive high - temperature processes for process heat / electrolysis • Tech reviews suggest large decarbonization potential in “hard - to - fertilizer abate” chemical heat • Emerging: electrically - conductive firebrick “thermal batteries” • BESS for electricity demand smoothing • Shift dyeing / drying / steam applications from fossil - • Roadmap shows meaningful reductions: up to 30 - 60% process - heat Textile & CO ₂ ₂ reductions in favorable cases (depending on heat source, fuel fuel boilers to electric / heat - pump + stored renewables • Thermal energy storage (sensible / latent) manufacturing baseline) & heat pumps for process heating / drying • Lower peak demand, enable more flexible operation • Utility - scale BESS + micro - grids • Replace diesel generators, firm renewables, reduce fuel • Hybrid solar + 2MW BESS at Australian gold mine, ~4,500 tonne CO ₂ e avoided / year & 1.67M L diesel saved / year integrating solar / wind + storage logistics risk Mining • Storage for peak shaving , backup power • Improve operational resilience & reduce outage - related • Scaling across many mines gives a large abatement potential in remote sites emissions 1 2 3 4 5 Note(s): Battery energy storage system, Direct reduced iron, Electric arc furnace, Thermal energy storage, Carbon dioxide equivalent Source(s): Industry articles & reports, 1Lattice analysis © 1Lattice | 16 Introduction Batteries are electrochemical devices consisting of 3 elements, i.e., cathode, anode & electrolyte; Converts potent chemical energy into boundless electric power While earlier EVs utilised lead acid batteries for propulsion systems, now they are mostly used for ancillary functions like lights, Key battery types Overview computing equipment & infotainment systems Lithium batteries Lead batteries Nickel batteries Definition • Battery transforms chemical energy into • Reversible intercalation • Complete material • Hydrogen absorption / electric energy through an electrochemical process with minimal transformation requiring desorption in metal alloy reaction Electro - structural degradation electrode restructuring during matrix with moderate • Involves transfer of electrons between chemical to electrode materials each discharge cycle structural stability materials in a circuit process US$ 400 - 700 / kWh* US$ 100 - 200 / kWh* US$ 100 - 150 / kWh* Composition 1 2 3 • Battery consists of three elements: >3k charge cycles 500 - 1,000 charge cycles 1 - 1.5k charge cycles – Cathode (Negative side) 150 - 250 Wh/kg** 30 - 50 Wh /kg** 60 - 120 Wh /kg** – Anode (Positive side) Characteristics – Electrolyte (Chemical which reacts with both sides) Longer warranties Shorter warranties Medium warranties (10 - 15 years) (3 - 7 years) (3 - 5 years) Production • Premium pricing justified • Low - cost solution (simple • Middle - ground solution with • Battery production entails crafting positive by superior performance manufacturing) for proven reliability & negative electrodes • Widely used for EVs & high - power applications • Safer than Lithium • This involves crucial processes like blending, consumer electronics • Perfect for automotive batteries, ideal for hybrid Applications coating, refining, cutting, & assembling the starter batteries & backup vehicles & power tools electrodes power where safety matters 1 2 3 Note(s): *Kilowatt - hour,**Watt hour per kg, Lithium iron phosphate battery, Lead acid battery, Nickel - Chromium & Nickel - Metal Hydride battery © 1Lattice | 18 Source(s): Industry reports, media articles, company blogs, 1Lattice analysis Application of batteries Industrial & household applications of lithium batteries, lead batteries & nickel batteries Lithium batteries Lead batteries Nickel batteries Electric forklifts Elevators Power tools Electric forklifts Elevators Power tools Electric forklifts Wind power plants Power tools Medical devices Portable test Drones IoT devices Marine devices Satellites Medical devices Marine devices Solar streetlight equipment Computers Digital cameras Smartphones Cordless Electric motors Clocks Solar panels Digital cameras Gaming consoles Smartphones vacuum cleaner Wearable devices Toys EVs UPS Emergency lights EVs UPS Computers Electric Clocks EVs toothbrushes © 1Lattice | 19 Source(s): Industry reports, media articles, 1Lattice analysis Battery manufacturing value chain ~98% lead acid batteries & only ~50% lithium - ion batteries are recycled overall, Nickel batteries can be re - used due to less degradation throughout the life cycle Raw material Battery cell / pack Cell production EV Production Recycling/ Re - use mining component production • Raw material : Lithium, • Manufactured in sets of • Separator inserted between • Battery pack integrated • Not environmentally friendly as only graphite, cobalt, manganese electrodes & then anode & cathode electrode into EV & connected with ~ 50% of a lithium - ion battery can & aluminum assembled in cells sheets electric motor & other be recycled in an effective way Lithium • Later wounded or stacked parts – Lithium batteries have complex, batteries • Lithium extracted from two together expensive & potentially different sources : brine or hazardous recycling processes hard rock • Raw Material: Lead • Lead reacts with lead • Connecting plates making • Battery pack integrated • 98 - 99% of rechargeable lead - acid dioxide, in presence of up battery grid into EV & connected with batteries are recycled, making it • Lead ore ground into particles sulphuric acid resulting lead electric motor & other sustainable & efficient Lead smaller than 0.1 mm • Methods for manufacturing sulphate parts – Recycled more due to simple & batteries plates: oxide & grid • Later ore converted to oxide uniform design, high lead value, & production, & pasting & strict regulations curing • Raw Material : Nickel • Assembling battery by • Nickel metal hydride components • Consists of: • Battery pack integrated Hydroxide enclosing positive & do not completely degrade – Anode: Nickel hydroxide into EV & connected with negative electrodes, throughout the battery lifetime & – Cathode: Hydrogen - electric motor & other Nickel • Nickel found primarily in two separators & electrolyte can potentially be reused in new absorbing alloys parts batteries types of deposits - sulphide batteries – Separator made of fine & laterite fibers © 1Lattice | 20 Source(s): IEA, industry reports, media articles, 1Lattice analysis Battery demand in India Battery demand in India projected to increase to ~70 GWh by CY30 at CAGR of ~50%; Indian states attracting investments for setting up battery manufacturing facilities Telangana to attract investments of INR 9,500 Cr. & Karnataka of Battery demand in India is projected to grow at ~50% INR 6,000 Cr. to manufacture lithium - ion batteries CAGR from ~3 GWh in 2022 to ~70 GWh by 2030 Battery manufacturing scenario in Indian states States Description Battery demand in India (GWh) • Andhra Pradesh’s CY25 BESS regulations enable diverse stakeholders to deploy energy storage, targeting 25 GWh Andhra Pradesh capacity by CY29 to support renewables & grid stability 70 • Amara Raja Batteries Limited launched 16GWh battery manufacturing facility to manufacture lithium - ion Telangana CAGR batteries, with investment of INR 9,500 Cr from CY23 - 33 ~48% • Exide plans to set up dedicated lithium - ion battery Karnataka plant with capacity of 12 GWh, by investing INR 6,000 Cr from CY22 - 30 10 • Neuron Energy launched a 1.5 GWh / year lithium - ion 3 battery plant in Pune in CY25 with INR 25 Cr investment, Maharashtra targeting EVs & energy storage with in - house R&D CY22 CY25 CY30 • Tata Group is setting up a 20 GWh lithium - ion battery plant in Sanand, Gujarat, with an INR 13,000 Cr Gujarat investment to boost local manufacturing & make Gujarat a India will need 969 - 1,452 Jammu - Kashmir & Rajasthan key production hub KT* of anode, cathode, & lithium deposits remain under electrolyte material between evaluation for commercial • Exicom remains a top local battery maker, expanding its CY22 & CY30 to fulfill extraction; leading candidates for EV charging and battery footprint across grid, C&I, and Haryana domestic battery demand future domestic lithium supply EV sectors with 20,000+ installations Notes: * Kilotonne © 1Lattice | 21 Source(s): Industry reports, media articles, Press releases, 1Lattice analysis Lithium battery market India Lithium battery market to grow at ~40% CAGR to reach ~US$ 32 B by CY30; Global market to grow at CAGR of ~20% to reach ~US$ 280 B by CY30 India Lithium battery market India key trends (US$ B, CY22 - 30P) 32.0 Widespread utilization of Increasing disposable Schemes, such as Government initiatives robotic solutions, along income leads to rising ‘’Make in India’’ & & falling battery costs with deployment of smart living standards, ‘’Digital India’’, are are encouraging grid & renewable driving the demand expected to significantly domestic production , energy systems led to for consumer lower the cost of aiming to decrease 6.5 increased demand for 2.5 electronics manufacturing for import dependence to lithium batteries lithium battery 20% by FY27 CY22 CY25P CY30P Global key trends Global Lithium battery market (US$ B, CY22 - 30P) 278.11 Lithium batteries Greater customer Companies in EU & US Announcements by 13 for mobility adoption rates & have announced plans for of the top 15 OEMs to applications, such as increased consumer new mining, refining & ban ICE* vehicles & 116.10 EVs, will account for demand for greener cell production projects achieve new emission - 69.40 the vast bulk of technologies to help meet the growing reduction targets demand in CY30 - demand for lithium about 4,300 GWh batteries CY22 CY25P CY30P Note(s): *Internal combustion engine © 1Lattice | 22 Source(s): Industry reports, media articles, 1Lattice analysis Lead acid battery market India Lead acid battery market to grow at CAGR ~2% to reach ~US$ 12 B by CY30; Global market to grow at CAGR of ~7% to reach ~US$ 94 B by CY30 Lithium batteries are better suited due to higher energy Slow growth density & longer life cycle as Lithium India Lead acid battery market India key trends batteries (US$ B, CY22 - 30P) substitutes in EVs & renewable storage; 12.27 demand 10.95 10.23 sustained in cost - sensitive backup uses Reliable use as a key Increased demand for Rising EV sales for Growing renewable standby / emergency power backup in both commercial & energy industry to aid power source for the critical industries like personal use driving demand for lead rising telecom sector railways, oil & gas, demand* batteries as these are mining, etc. used to store energy CY22 CY25P CY30P Global key trends Global Lead acid battery market (US$ B, CY22 - 30P) 94.11 66.66 Rising environmental Increasing demand Novel technological Heavy demand from 54.20 concerns & green from data centres, as innovations in lead flourishing industries initiatives like EV batteries needed for acid batteries bringing like power, EV, promotion by power backup longevity, flame telecom, etc. governments around the resistance, etc. worldwide world contribute to contributing to rising demand adoption CY22 CY25P CY30P Note(s): *Used primarily for ancillary functions © 1Lattice | 23 Source(s): Industry reports, media articles, 1Lattice analysis Nickel metal hydride battery market Global Nickel metal hydride battery market to grow at CAGR ~20% to reach ~US$ 16 B by CY30 from ~US$ 4 B in CY22 Global nickel metal hydride battery market Global key trends (US$ B, CY22 - 30P) • India primarily relies on imports for NiMH batteries, with limited domestic assembly and no large - scale cell manufacturing • Most supplies come from China, Japan, & South Korea, serving consumer electronics, solar backup, & niche mobility segments. 15.74 Exponential consumption of Modernization efforts & Nickel - metal hydride electronic goods & strong development of batteries are increasingly supporting policies to expand are infrastructure for electricity being used in hybrid & set to bolster growth of the nickel - generation are being made by EVs due to its large power metal hydride battery market various governments capabilities 6.71 4.02 Increased demand for EVs due Preference for nickel - metal to rising awareness to reduce hydride batteries amongst carbon footprints is expected manufacturers rising due to its to drive the growth for nickel - lower production costs, high metal hydride battery market energy efficiency & longer life CY22 CY25P CY30P Source(s): Industry reports, media articles, 1Lattice analysis © 1Lattice | 24 Strategic role of battery production Expanding battery production can drive India’s economic growth, enhance supply chain resilience, unlock exports, & advance climate ambitions Innovation & Economic leadership Strategic autonomy & Enabling national export hub & market growth supply chain resilience climate & policy goals • Reduced import dependence: • Geopolitical advantage: Reduces • 'Make in India' for the world: • Fulfilling Net - Zero commitments: Cuts reliance on imports, saving dependence on few nations Creates export opportunities, with Supports India’s CY70 net - zero foreign exchange & insulating from dominating battery supply chain, EV exports already growing 40% in target through large - scale transport global price volatility enhancing energy security FY24 electrification • Job creation: Establishes robust • Stable supply chain: Domestic • Driving localized R&D: • Supporting government ecosystem for skilled base provides secure supply, Encourages investment in next - missions: Enables National Mission manufacturing, creating significant protecting automotive & energy gen technologies for self - reliance on Transformative Mobility & 'Vision employment opportunities sectors from disruptions (batteries ~40% of EV costs) 2030' for electrification targets • Accelerated domestic adoption: • Value chain control: Captures • Attracting global investment: • Promoting circular economy: PLI scheme support lowers EV & more value through lithium Strong ecosystem attracts Creates scale for viable domestic ESS* costs, boosting domestic reserves acquisition & domestic investors like Suzuki, Toshiba, & battery recycling, reducing demand production Denso Corp environmental impact Note(s): Energy storage solutions © 1Lattice | 25 Source(s): ICCT, media reports, industry reports, 1Lattice analysis Investments in R&D Investments in energy storage system reached 25 - 27M in CY22 & 23 & declined CY24 onwards in India; Investment in R&D critical for technology self - reliance & localization goals Total PE / VC investments** reached 27.4M in CY22, Investment in R&D needed to enable self reliance in from 2.7M in CY22; deals saw a slump CY24 onwards technology, export opportunity Total PE / VC investments** across energy storage system companies in India Technology self - reliance & localization (in US$ M, CY19 - 25*) • India's R&D spending lags global leaders - 0.64% of GDP vs China (2.4%), holding only 0.3% of global EV patents vs China's 35% 8 • Localization essential for cost competitiveness - Batteries form ~40% of EV costs; indigenous R&D needed for domestic manufacturing base Massive market growth & export potential 5 • Explosive domestic demand requires immediate capacity - Energy storage needs to grow 15x to 600 GWh by CY30 4 • Export potential - US$ 60M+ EV exports in FY24 with 40% growth, R&D needed to achieve & retain global competitiveness 27.4 25.7 2 2 2 Climate goals demand technology breakthroughs Funding slow down due to global funding 1 • Net - zero by CY70 requires 100% zero - emission CVs by CY50 - Only winter & investor preference for late - stage R&D can deliver required battery improvements EV / clean - tech plays like charging infra 12.1 • Future emission hotspots - Tractors & construction vehicles (hard - to - rather than battery R&D electrify) to exceed on - road emissions by CY30 7.7 2.7 2.1 Bridging critical commercialization gap 2 • "Valley of Death“ blocking technology transfer - Academia focuses early research while industry prefers late - stage development CY20 CY21 CY22 CY23 CY24 CY25* • Funding gap threatens competitive position – India lags significantly in terms of Funding amount Funding rounds investment than peers like China, US & European Union 1 2 Note(s): *YTD as on 29 - 09 - 2025, **excludes post - IPO deals, commercial vehicles, gap where promising technologies get stuck between lab discovery & market readiness © 1Lattice | 26 Source(s): Tracxn , WRI India – Decoding India’s battery ecosystem, ICCT – Investment in R&D for EV in India, 1Lattice analysis Battery recycling Battery recycling closes the loop in battery lifecycle, lowers environmental footprint, enables energy & cost savings, enhances supply chain resilience & aligns with policies Energy & cost savings • Recycling consumes significantly less energy than primary extraction • Lower raw material costs contribute to Lower environmental footprint Supply chain resilience cheaper, more affordable EV batteries • Recycling expected to cut battery life cycle • Provides a stable, domestic source of • Co - location near gigafactories helps reuse emissions by up to 35% by CY35 critical minerals manufacturing scrap efficiently • Decreases mining - related risks (water stress, • Reduces exposure to volatile global biodiversity loss, land disruption) commodity markets • Reduces hazardous waste leakage from • Diversifies material supply away from untreated batteries geopolitically concentrated mining regions Resource efficiency & circularity Policy & industry • Recovers critical minerals (lithium, alignment cobalt, nickel), reducing dependence • Global frameworks (e.g., EU on virgin mining Battery Regulation) mandate • Enables reuse of materials in new recycling quotas cells, closing the loop in battery • India, US, EU investing in recycling lifecycle hubs as part of battery • Supports circular economy by sustainability strategies maximising value extraction from • Industry leaders incorporating end - of - life products recycled content in next - gen cells Note(s): *Electric vehicles Source(s): IEA report on EV Battery Supply Chain Sustainability, media reports, industry reports, 1Lattice analysis © 1Lattice | 27 We are here for you Let us know how we can meet your business requirement? Amar Choudhary Abhishek Maiti CEO, 1Lattice Director - Technology & Internet, Industrial goods & services E: amar@1lattice.com E: abhishek.maiti@1lattice.com For media queries, Corporate Communications please contact communications@1lattice.com www.1lattice.com Disclaimer: This material has been prepared by 1Lattice, which is the trade name of Lattice Technologies Private Limited (“1L att ice”, “we” or “our”) with the intent to showcase our capability and disseminate learnings to potential partners/clients. This material can be referred to by the readers on the internet but should be referenced to 1Lattice, if reused or adapted in an y form, or medium and on any forum. The frameworks, approaches, tools, analysis and opinions are solely 1Lattice’s intellectual property and are a combination of the collection of the best data we could find publicly, and the 1Lattice team’ s o wn experiences and observations. Any information provided herein is only for informational purposes and you are advised to perform an independent analysis of the same before making any decision based on such information. The information does not co nstitute any business advice or guidance and is to be construed as a general summary based upon the publicly available information and our interpretation of the same using our resources. For this material, we may have relied upon diff ere nt sources of information which may be primary sources, publicly available information, and relevant information available with us. We make no representation or warranty, expressed or implied, that such information is accurate or complete, and nothing conta ine d here can be construed as definitive predictions or forecasts. Before reading further, the Recipient expressly agrees that this might not address any and all risks and challenges facing the Recipient, its business, and the markets within which it operates, nor all possible market co nd itions. Any use of the information provided herein by the viewer shall be at the sole risk of the viewer and 1Lattice or its business partners, affiliates, agents, officers or employees shall not be liable for a ny unintended or adverse effect or outcome from the use of such information by the reader. 1Lattice does not have any duty to update or supplement any information in this document. 1Lattice shall not be responsible f or any business or commercial loss sustained by any person who relies on any information provided herein. Any and all logos of companies used in the information provided herein have been published for information purposes only and 1Lattice doe s not hold any liability in connection therewith. +91 881 041 9502 abhishek.maiti@1lattice.com Delhi NCR | Mumbai | Bengaluru | UAE | KSA | Singapore