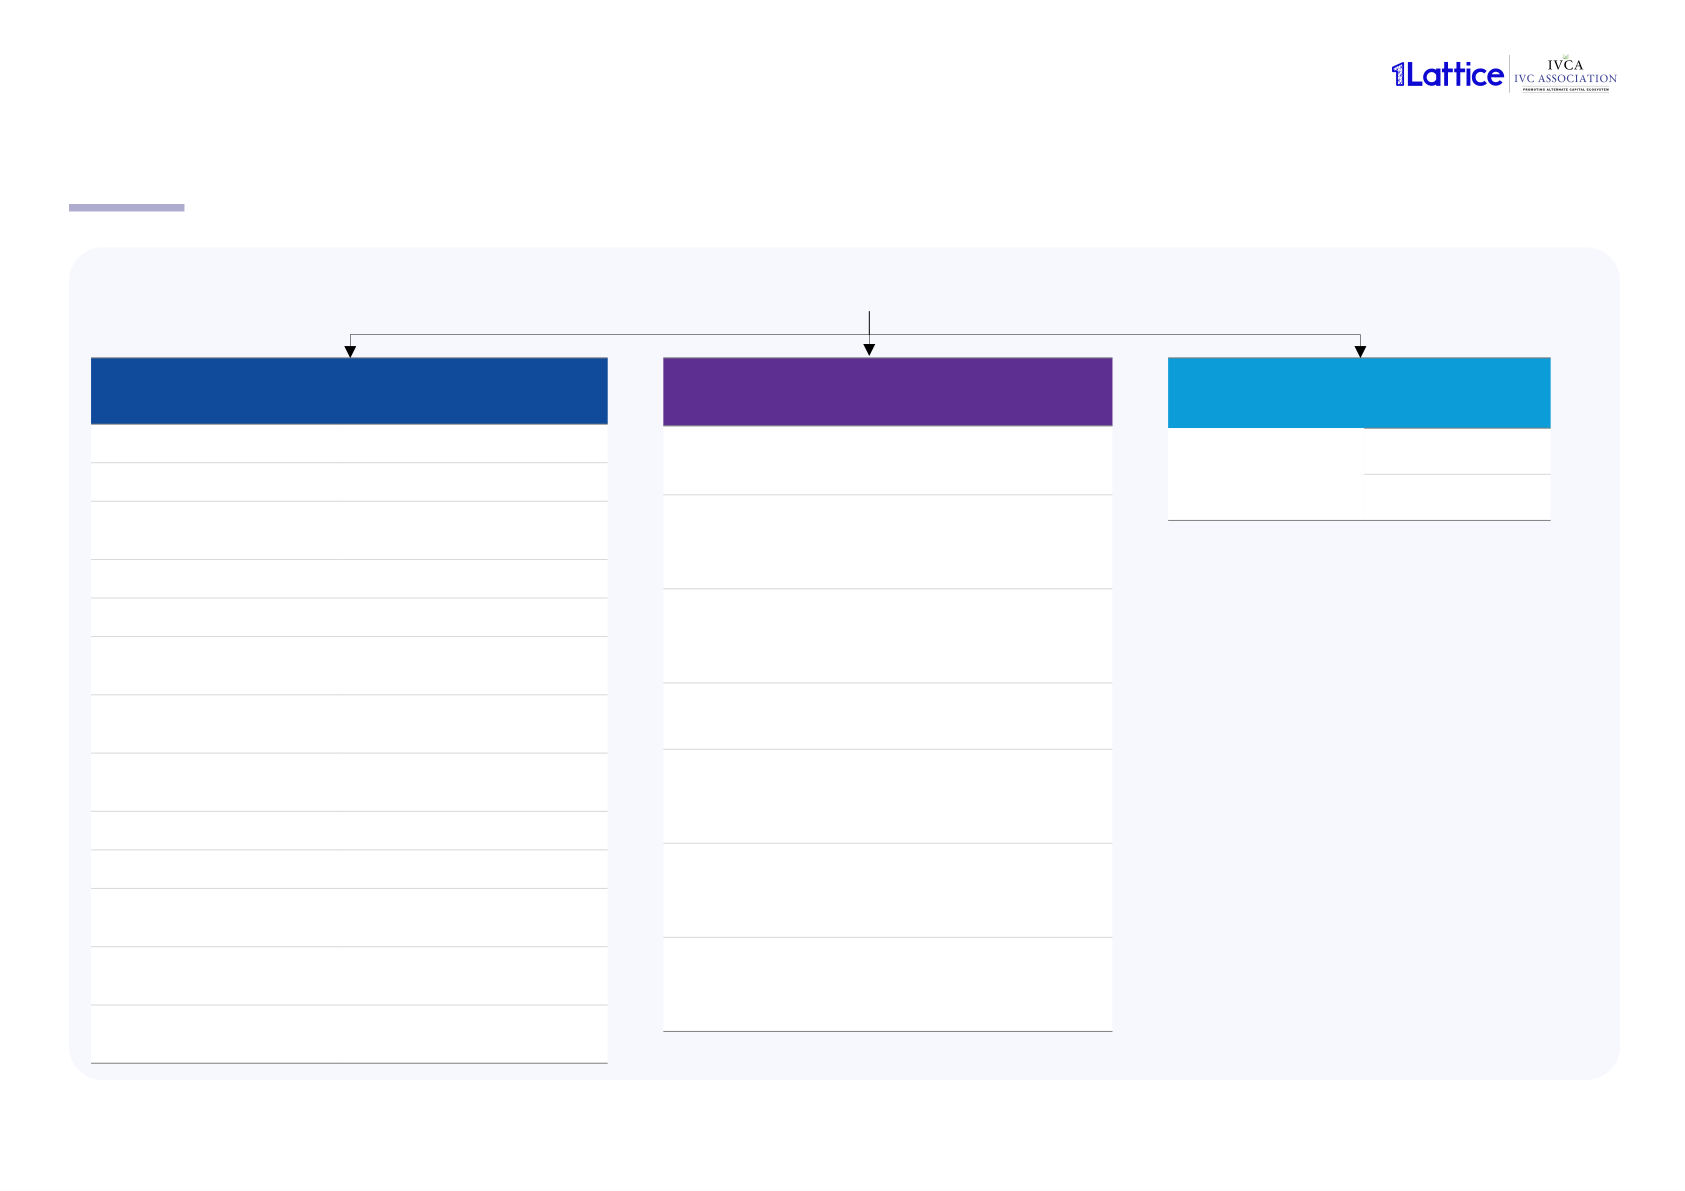
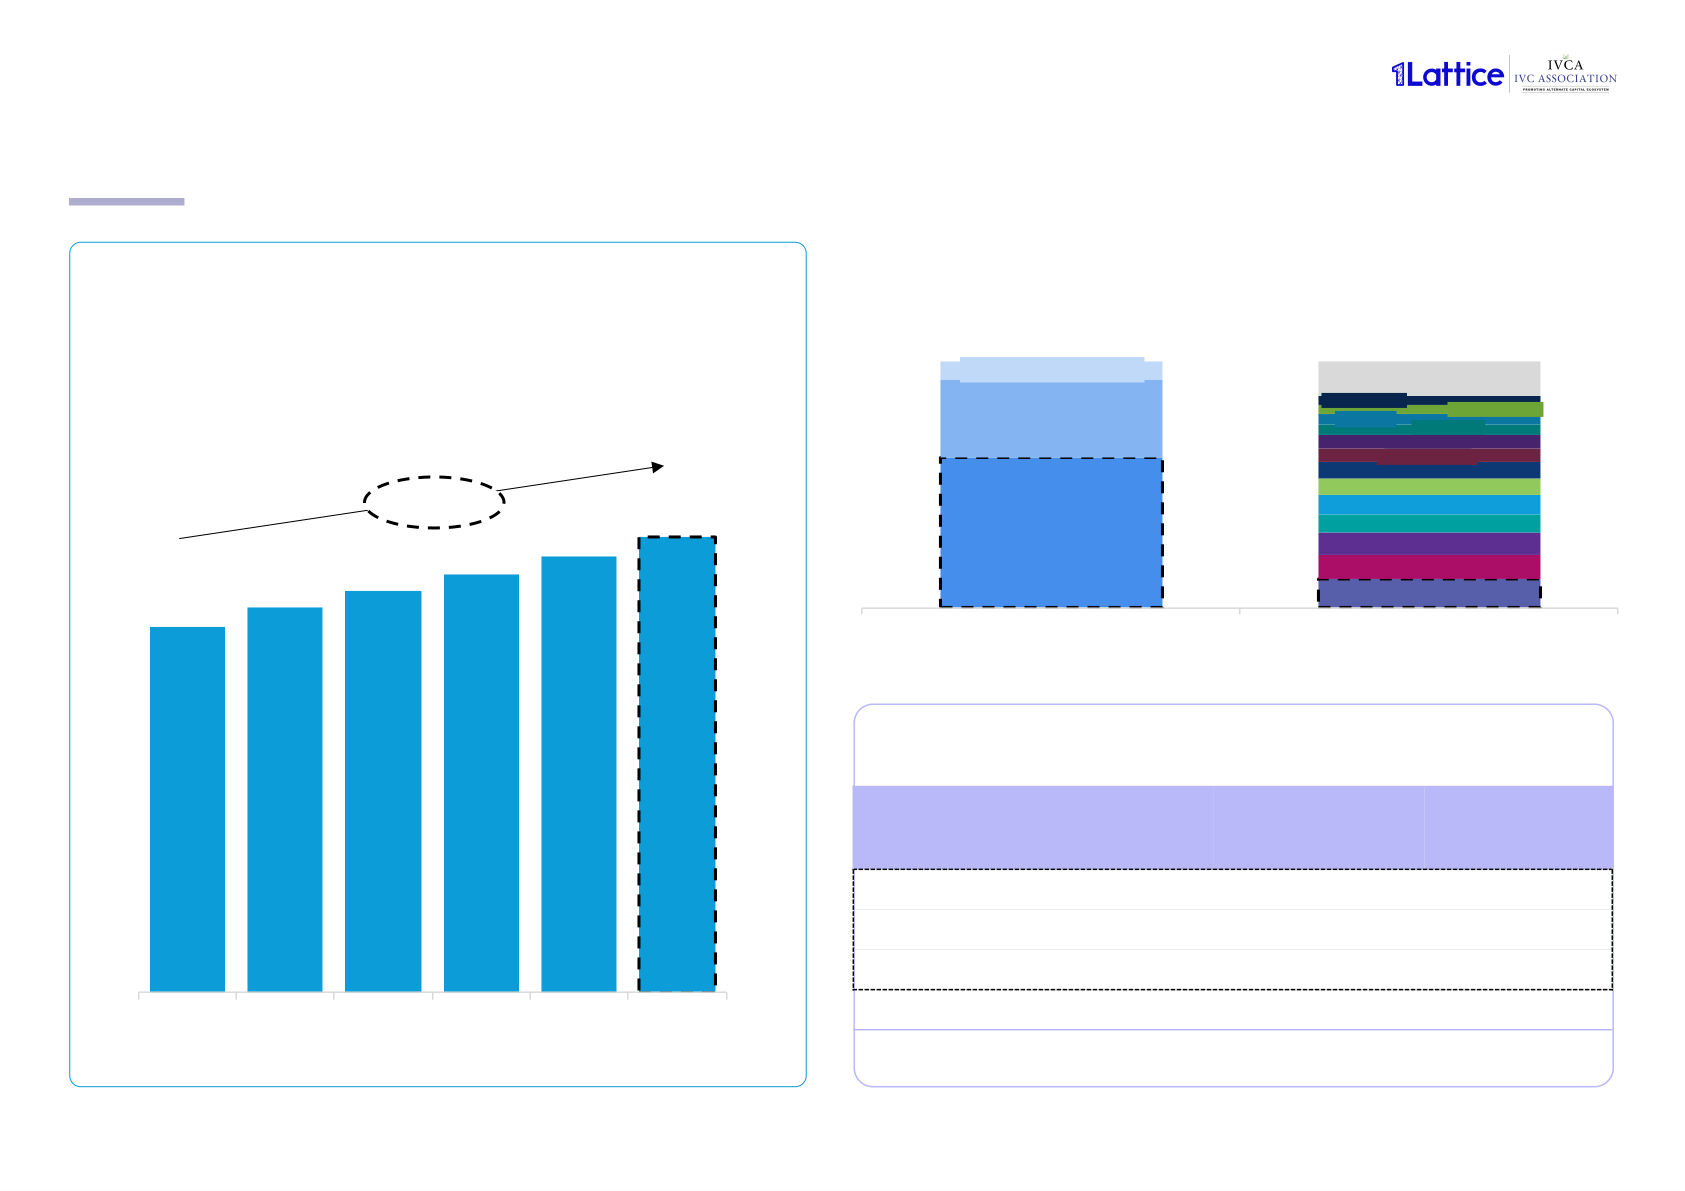
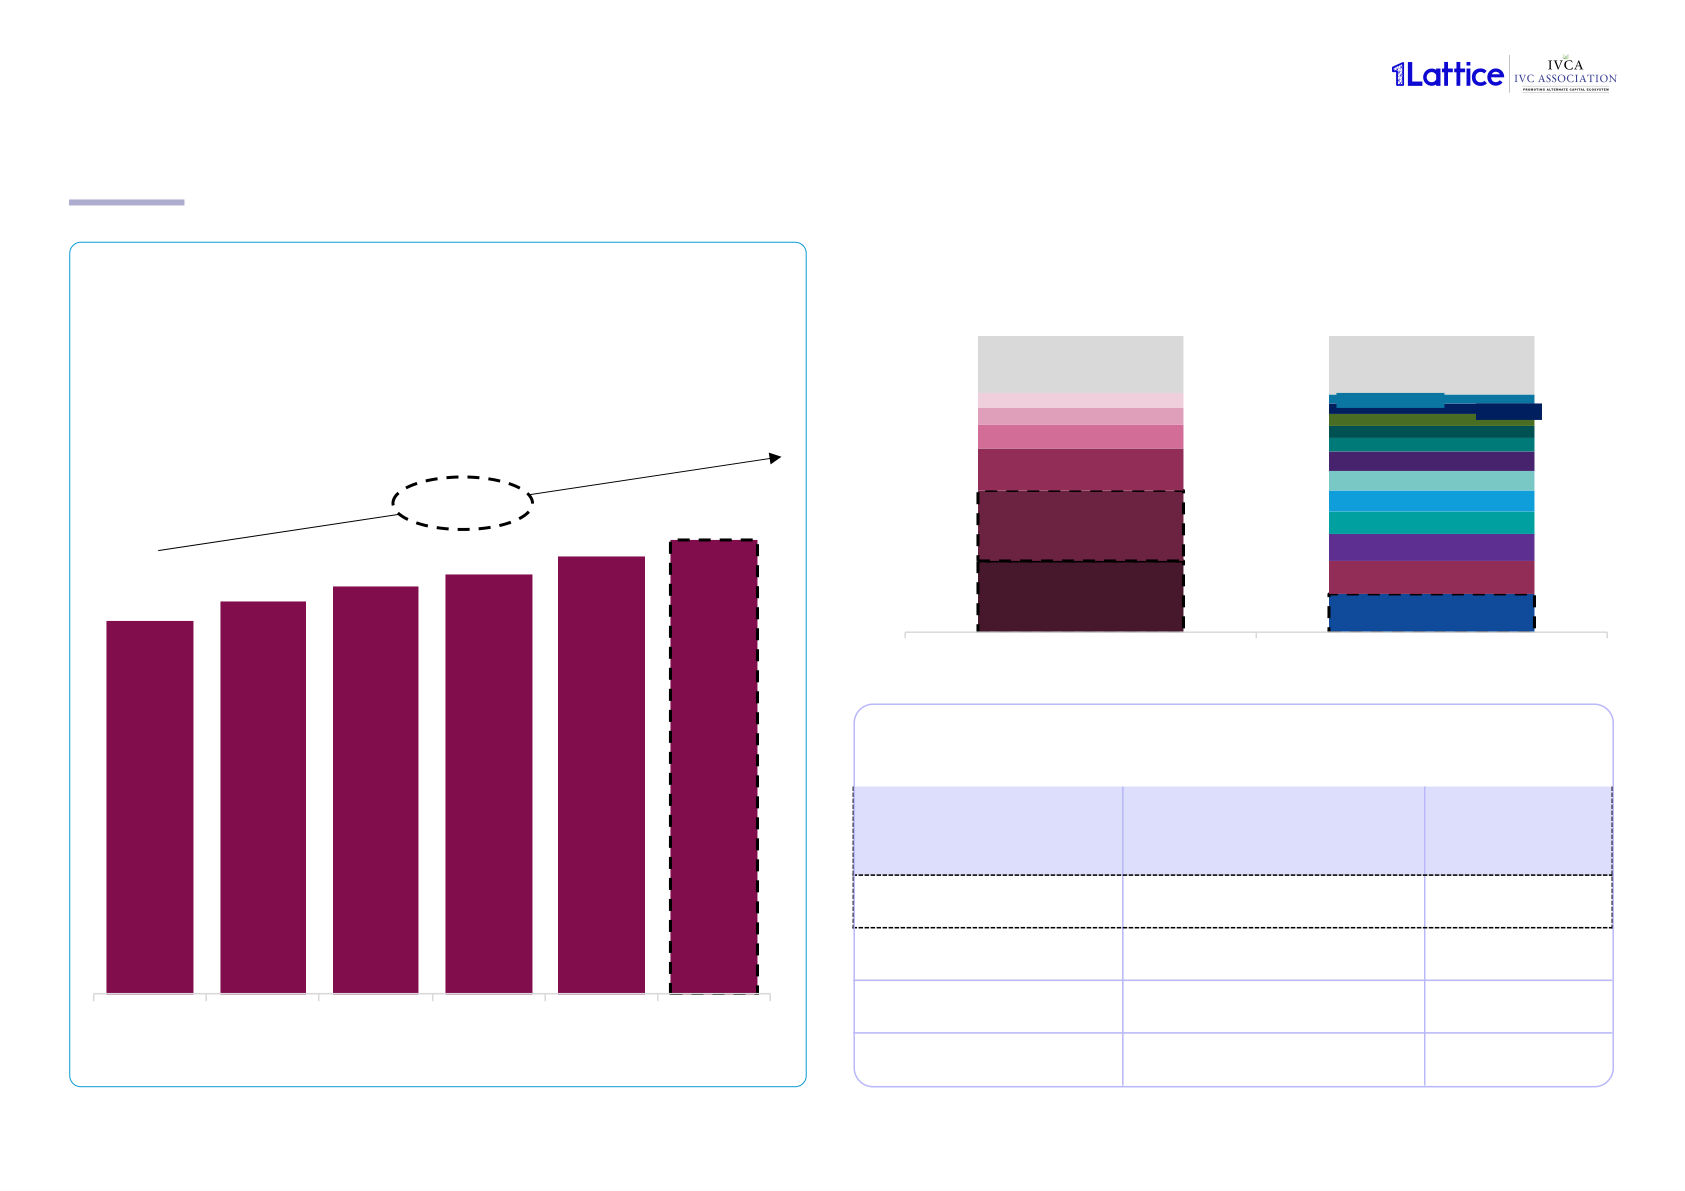
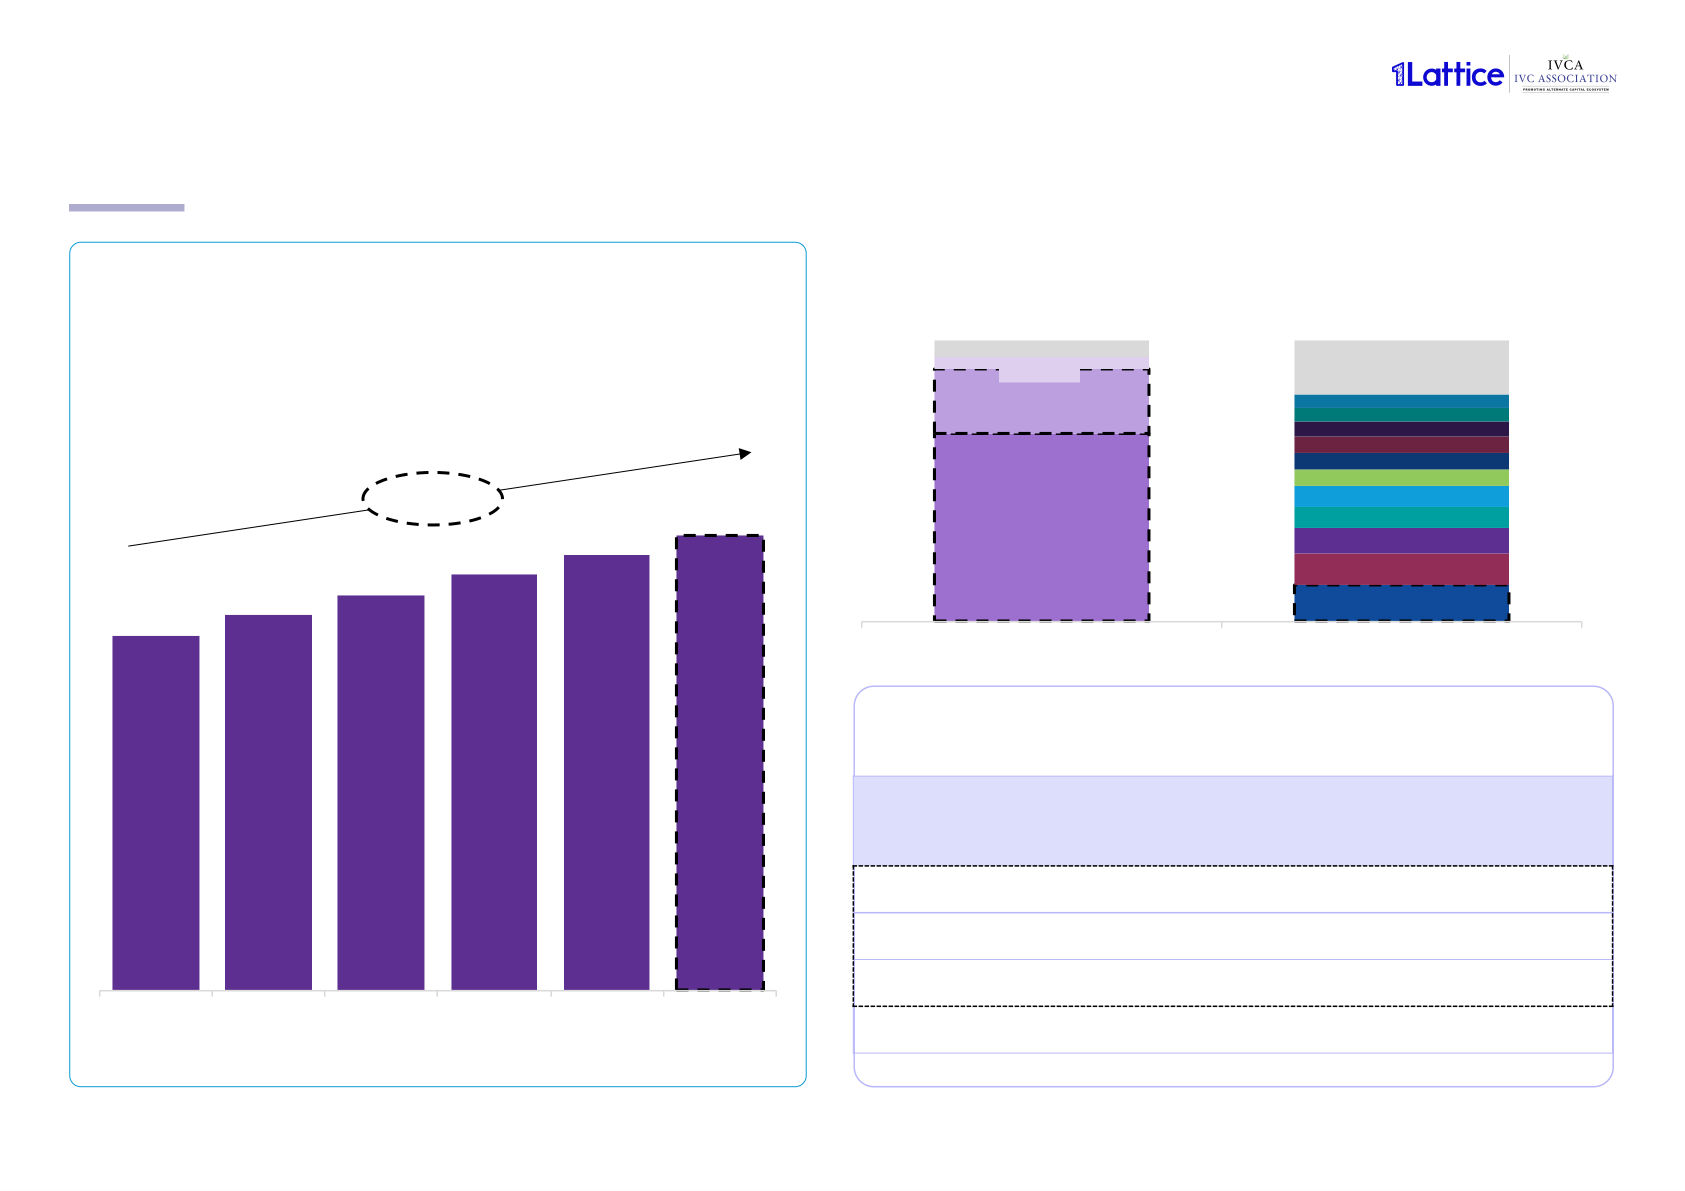
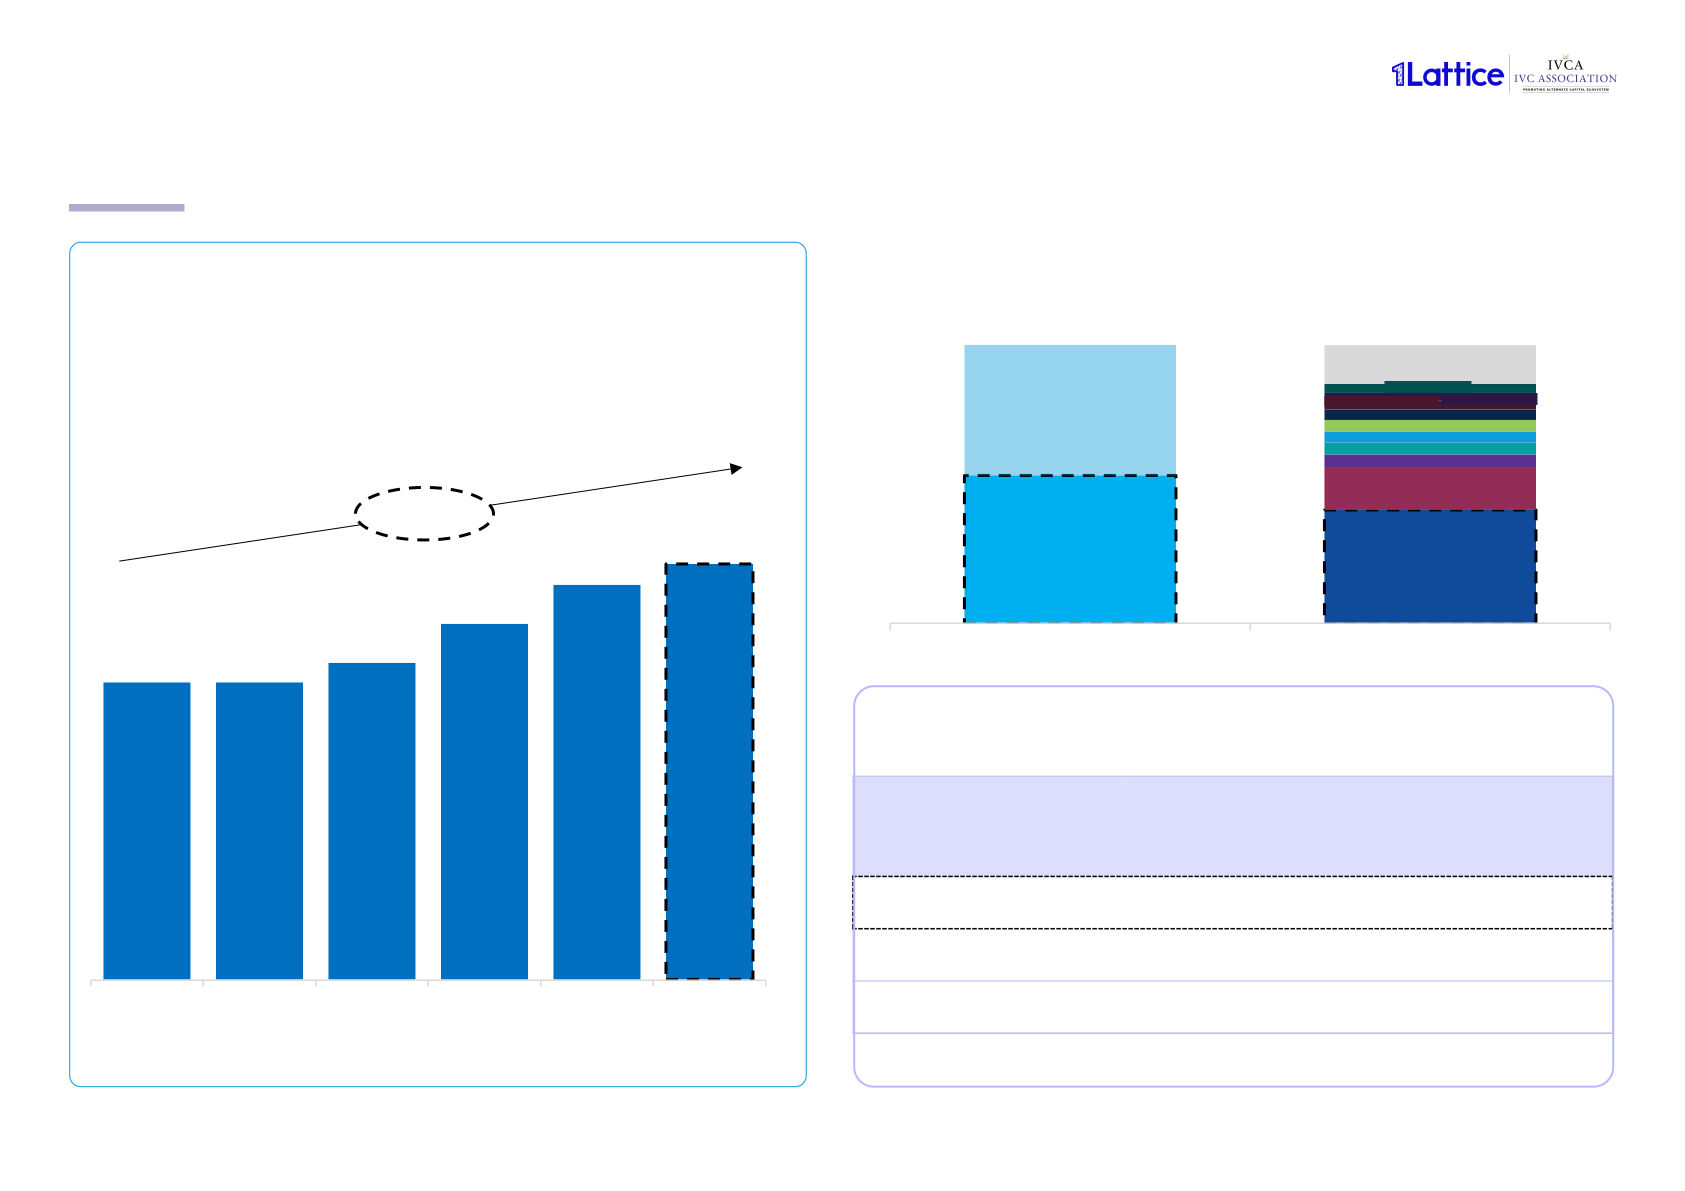
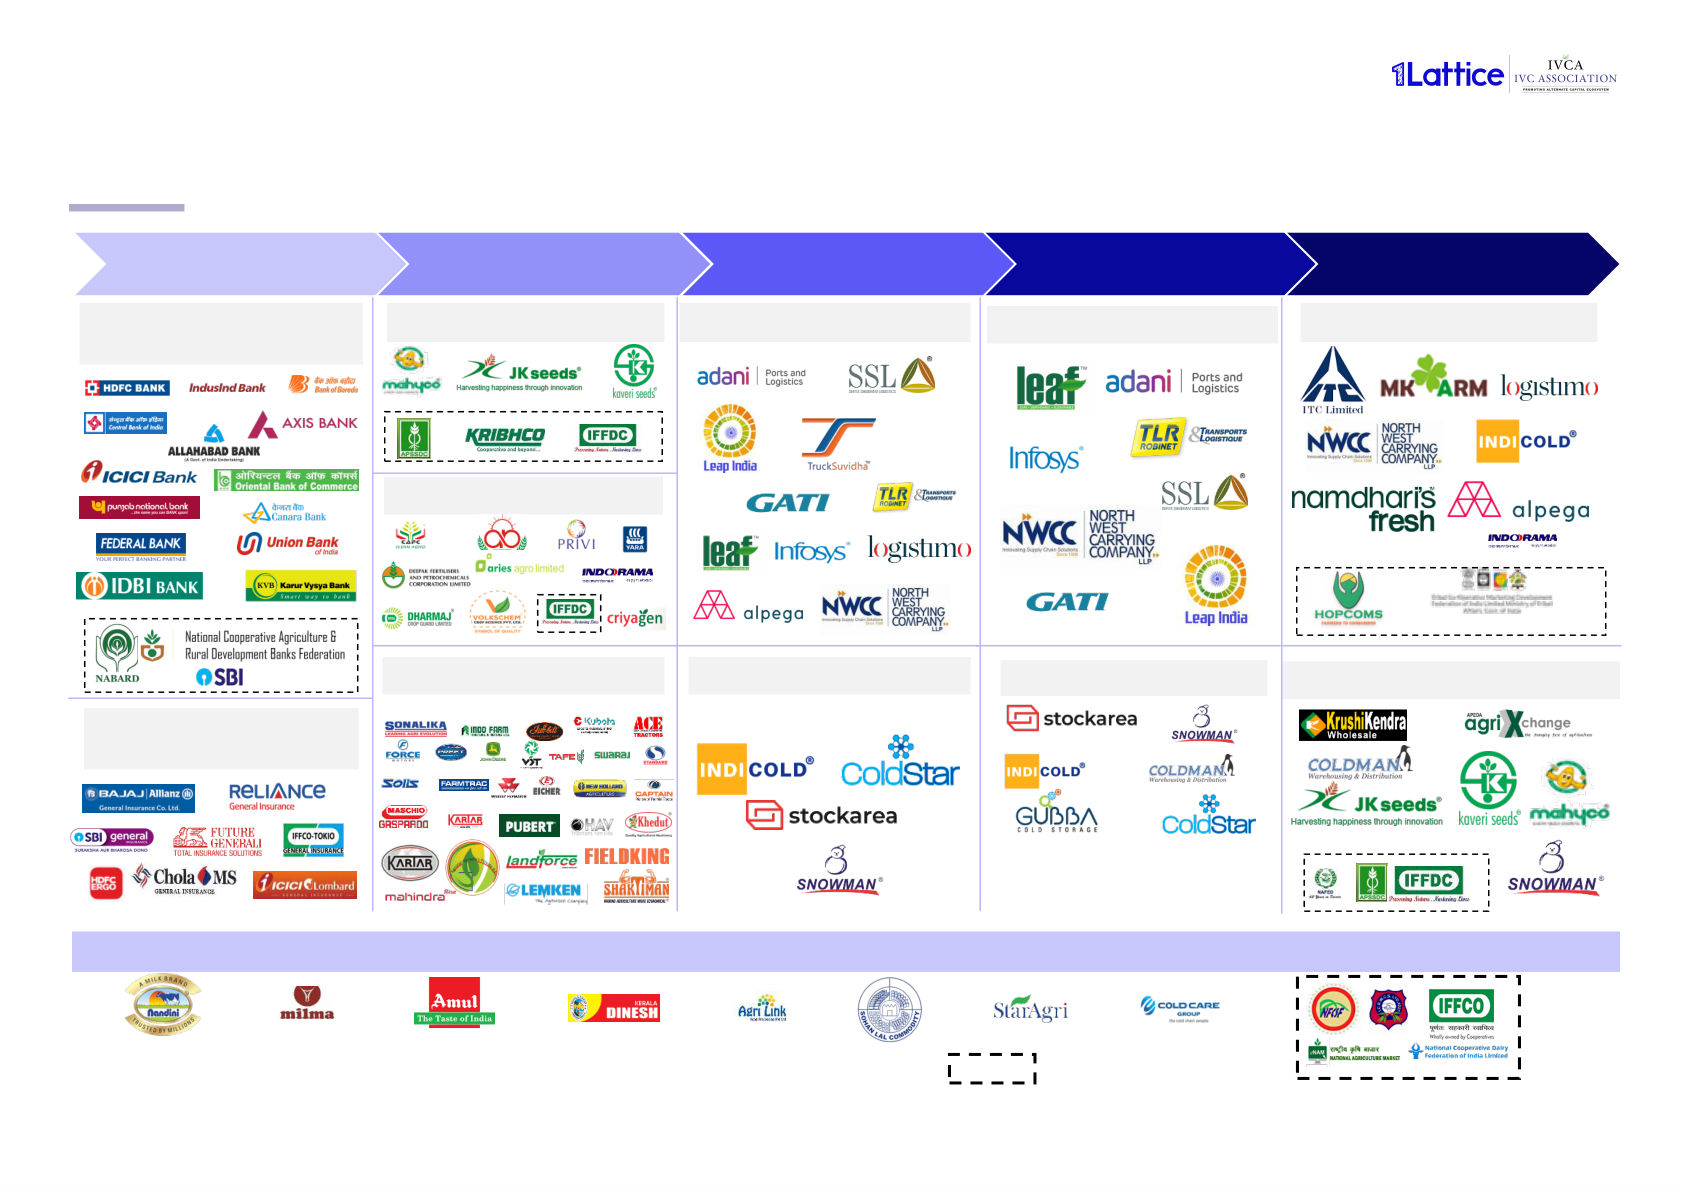
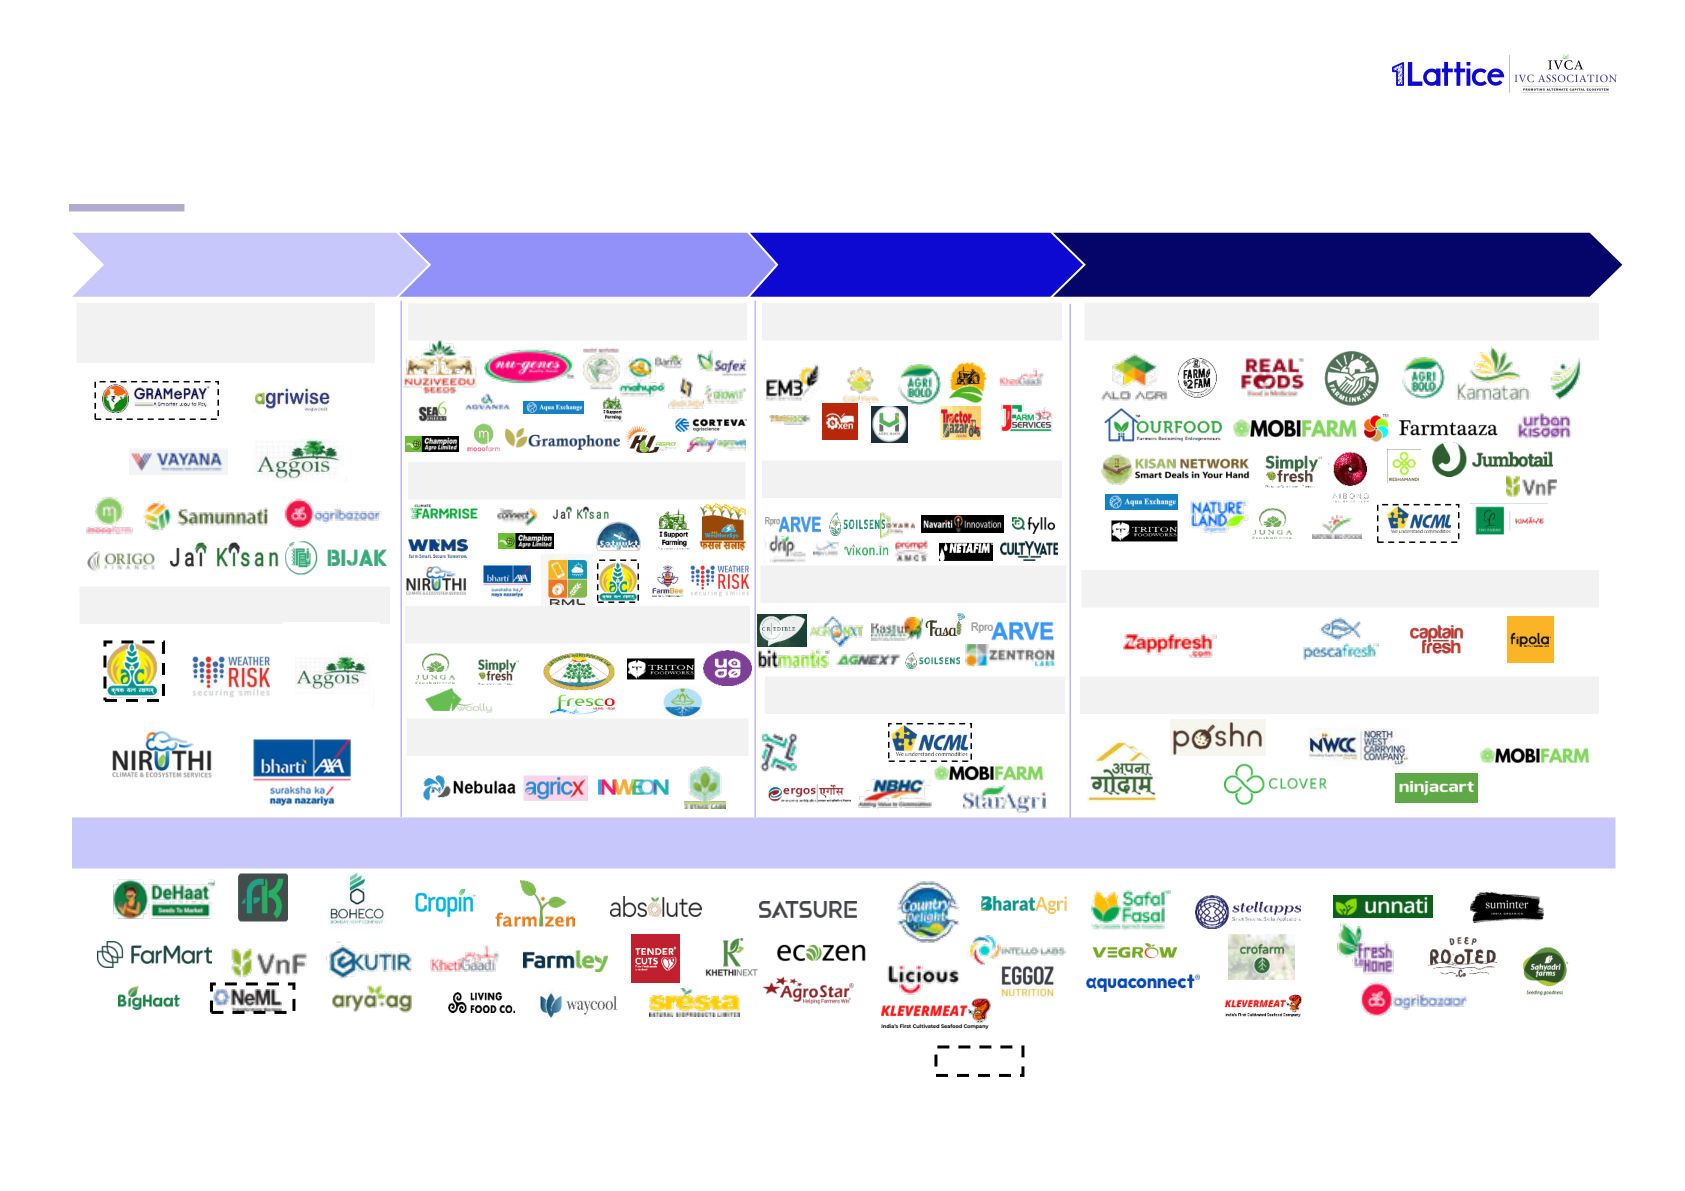
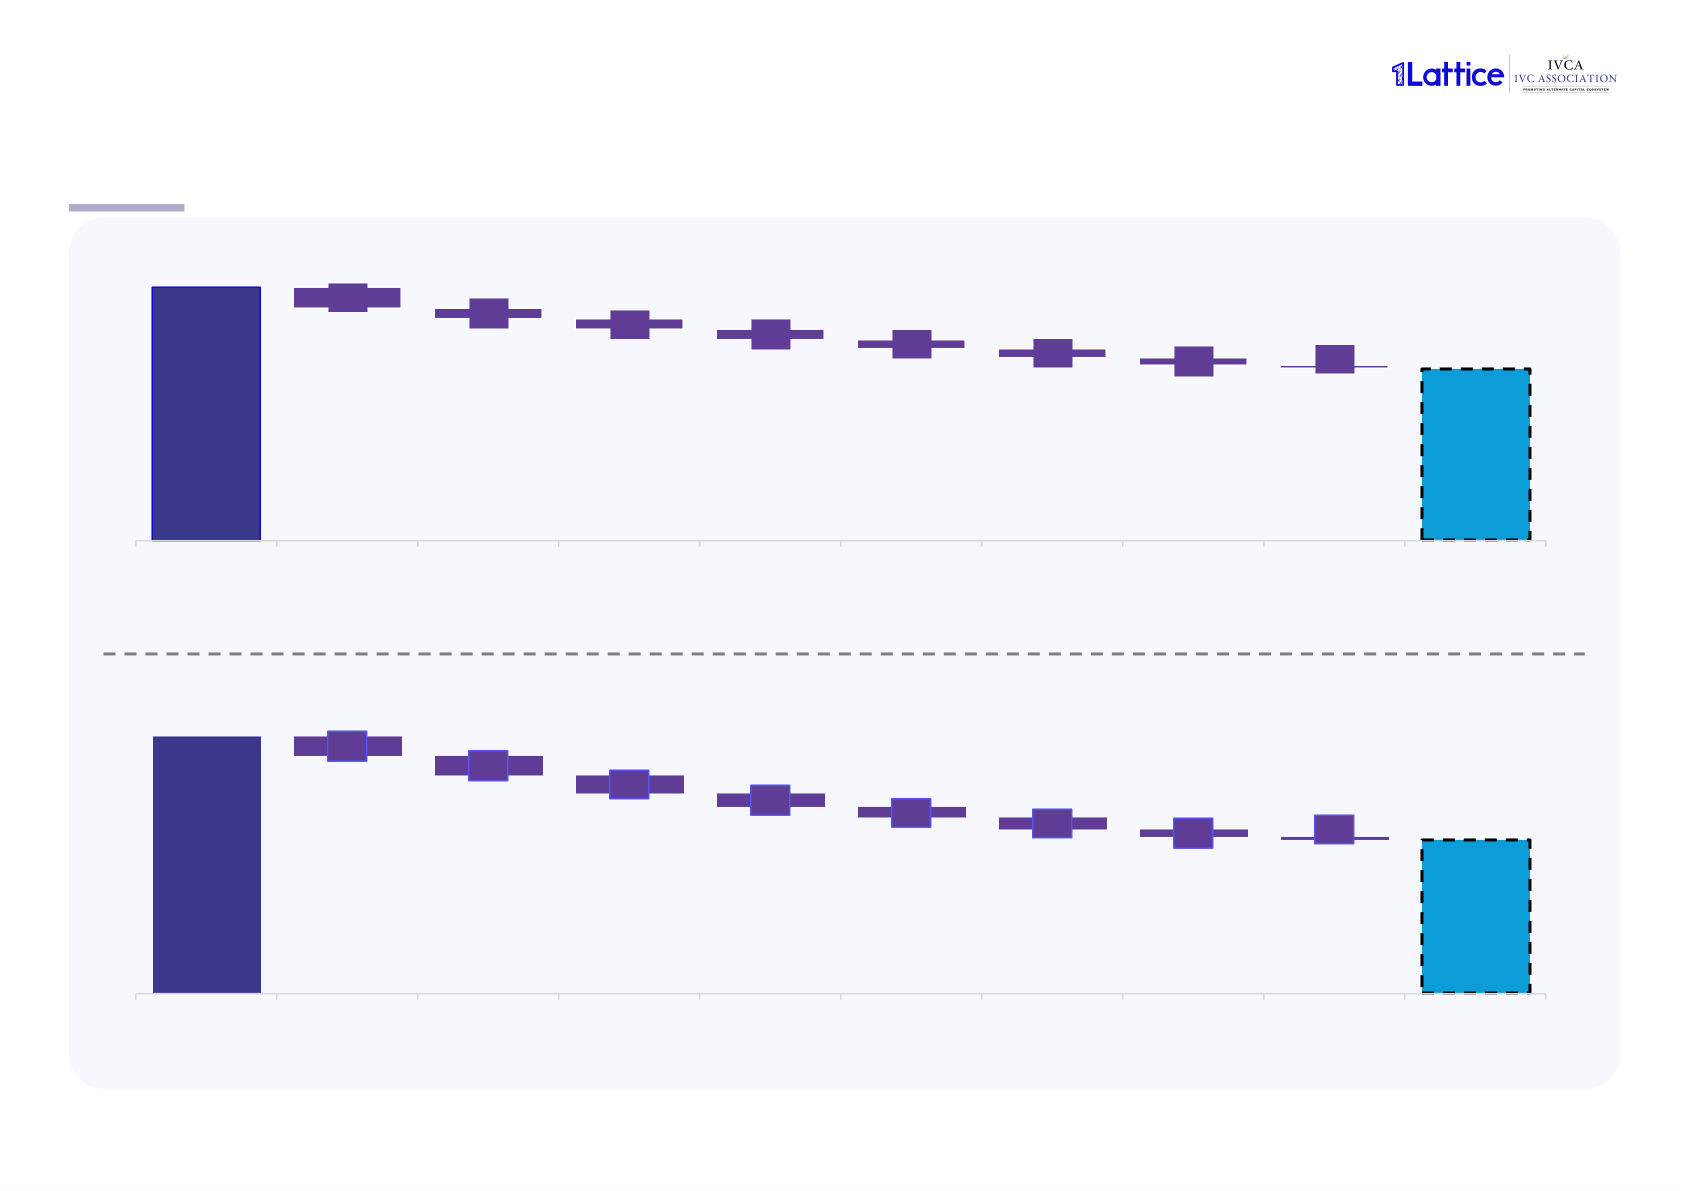
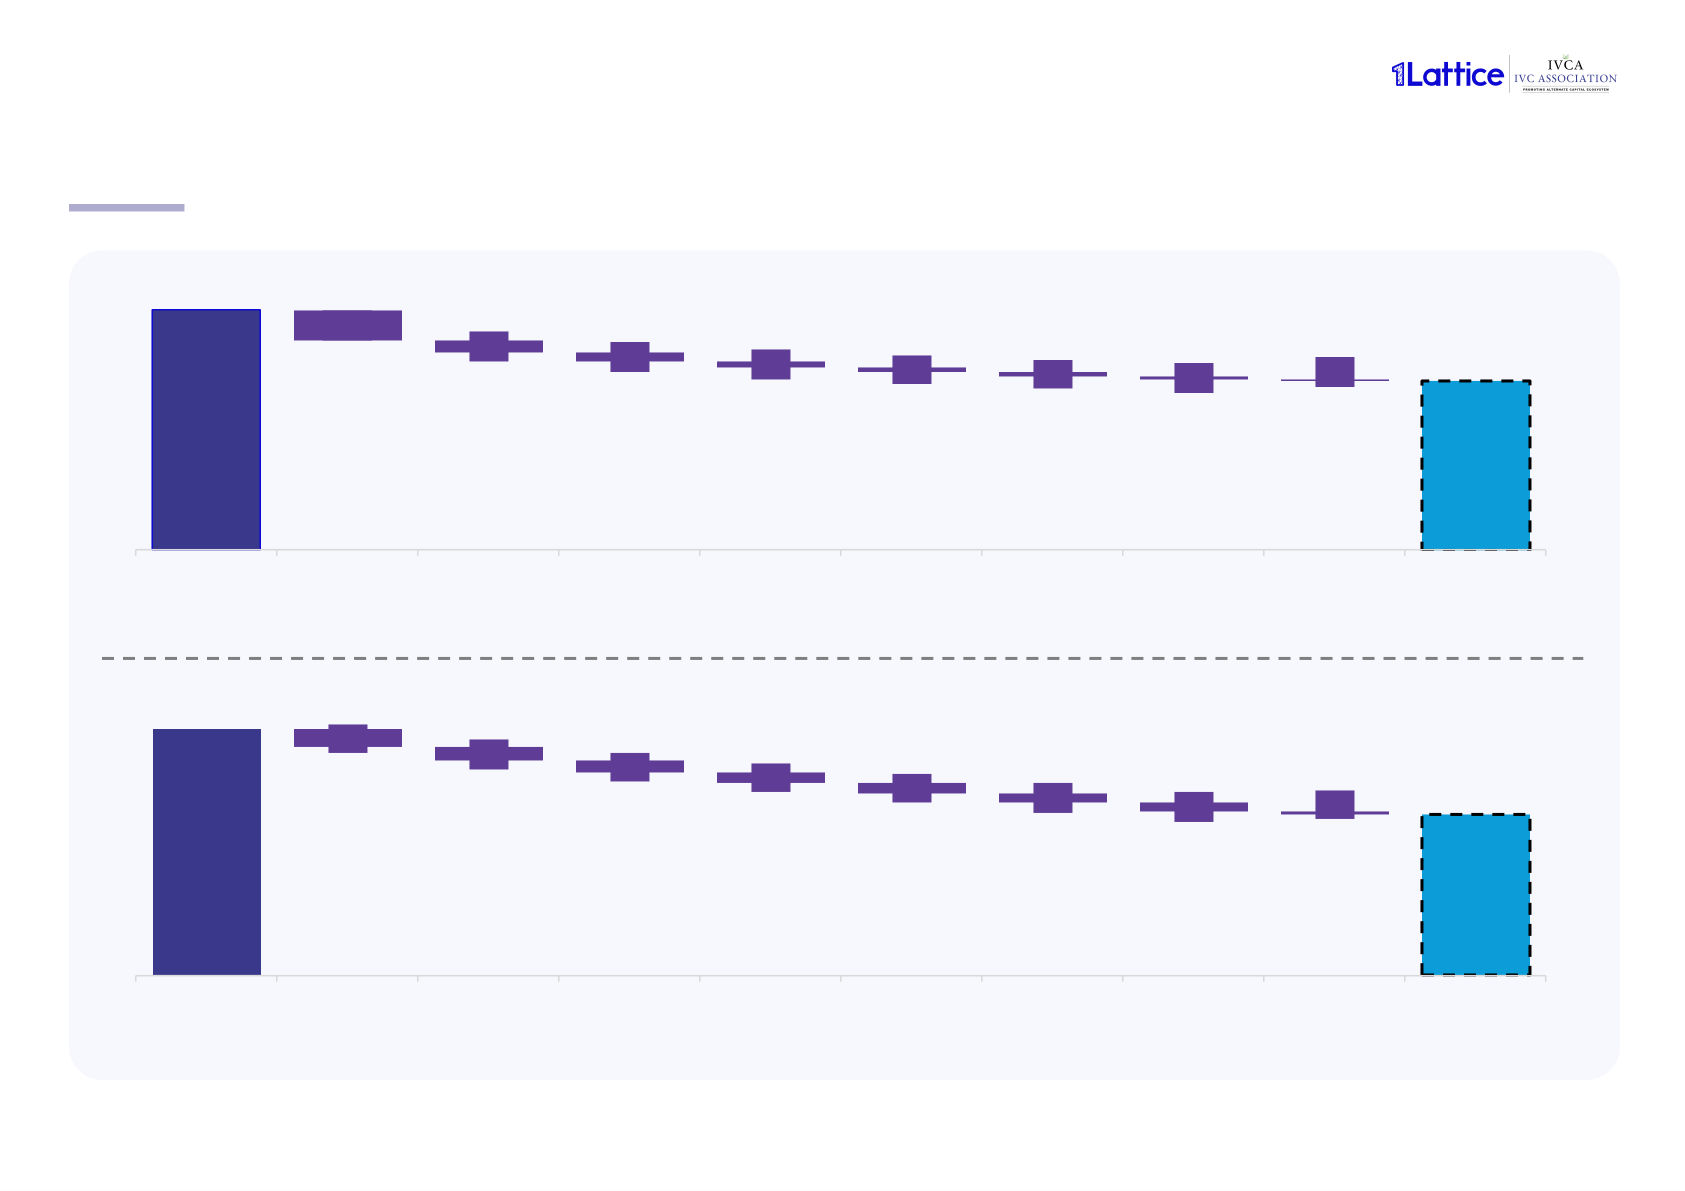
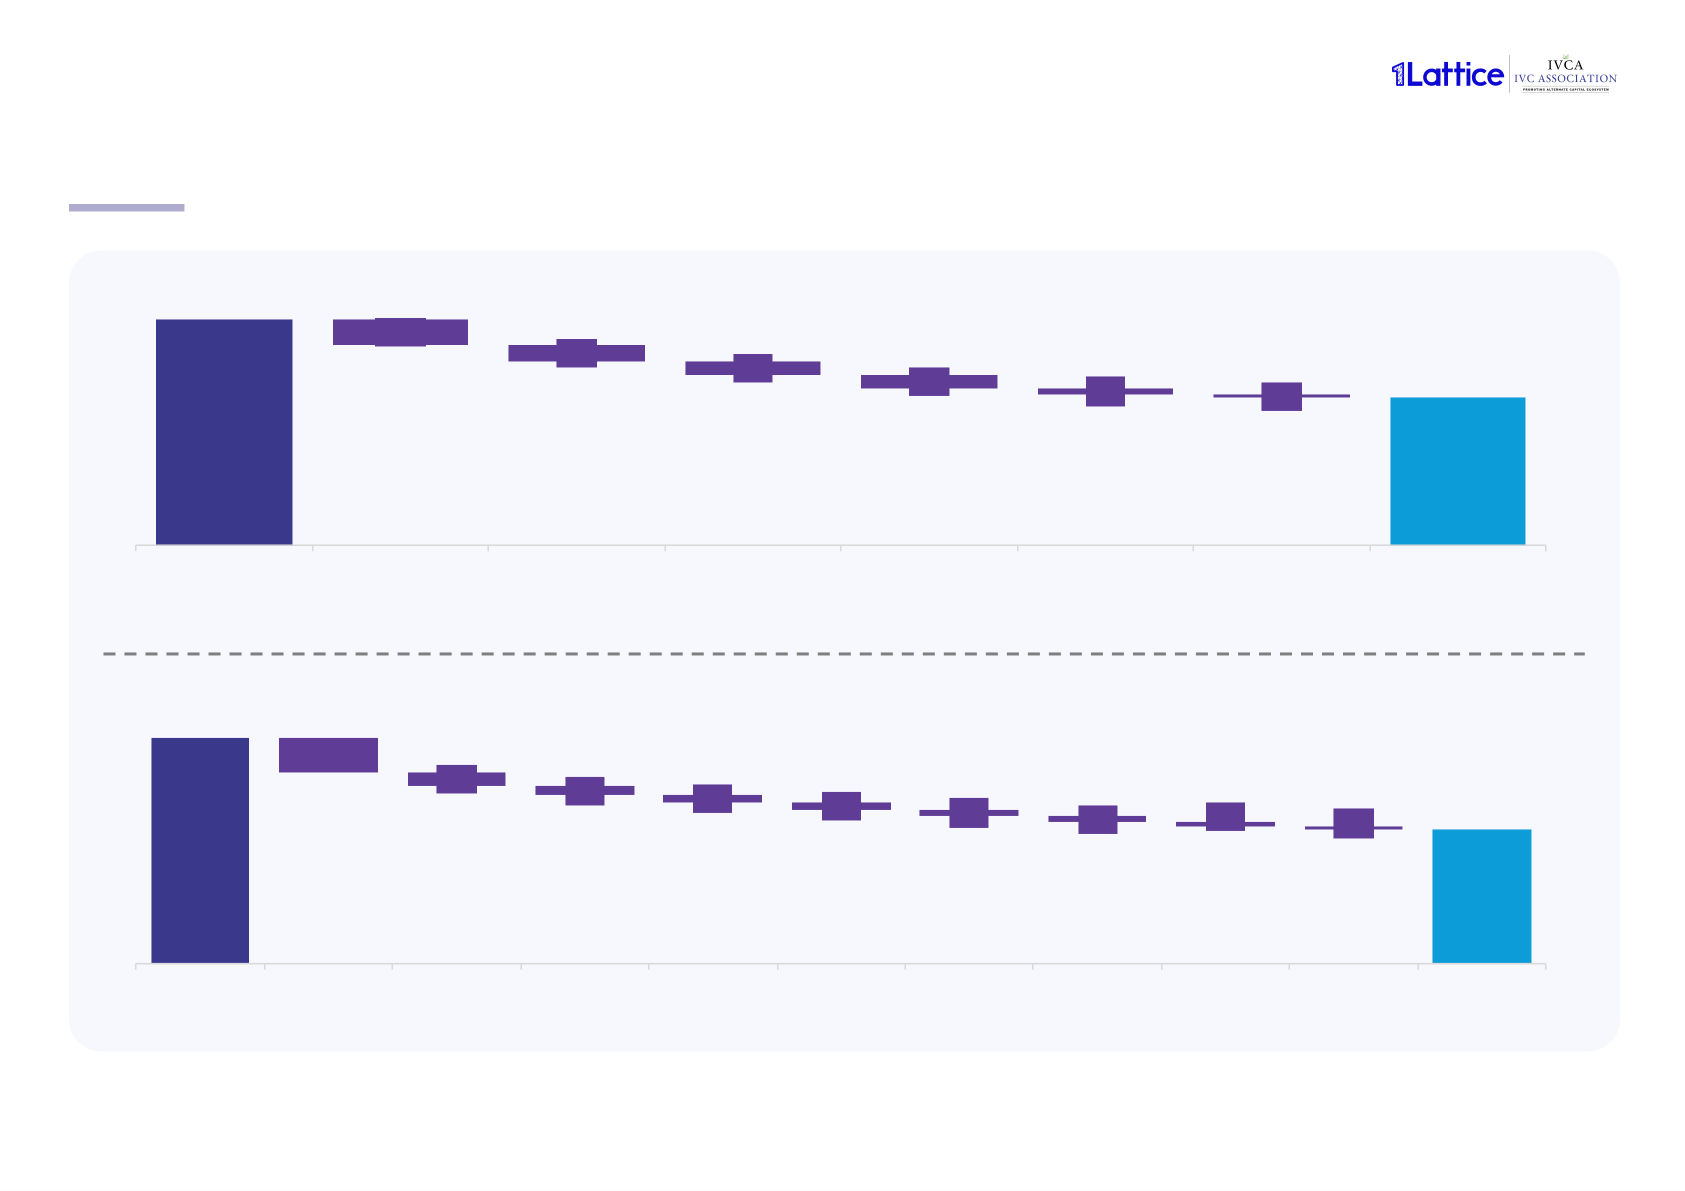
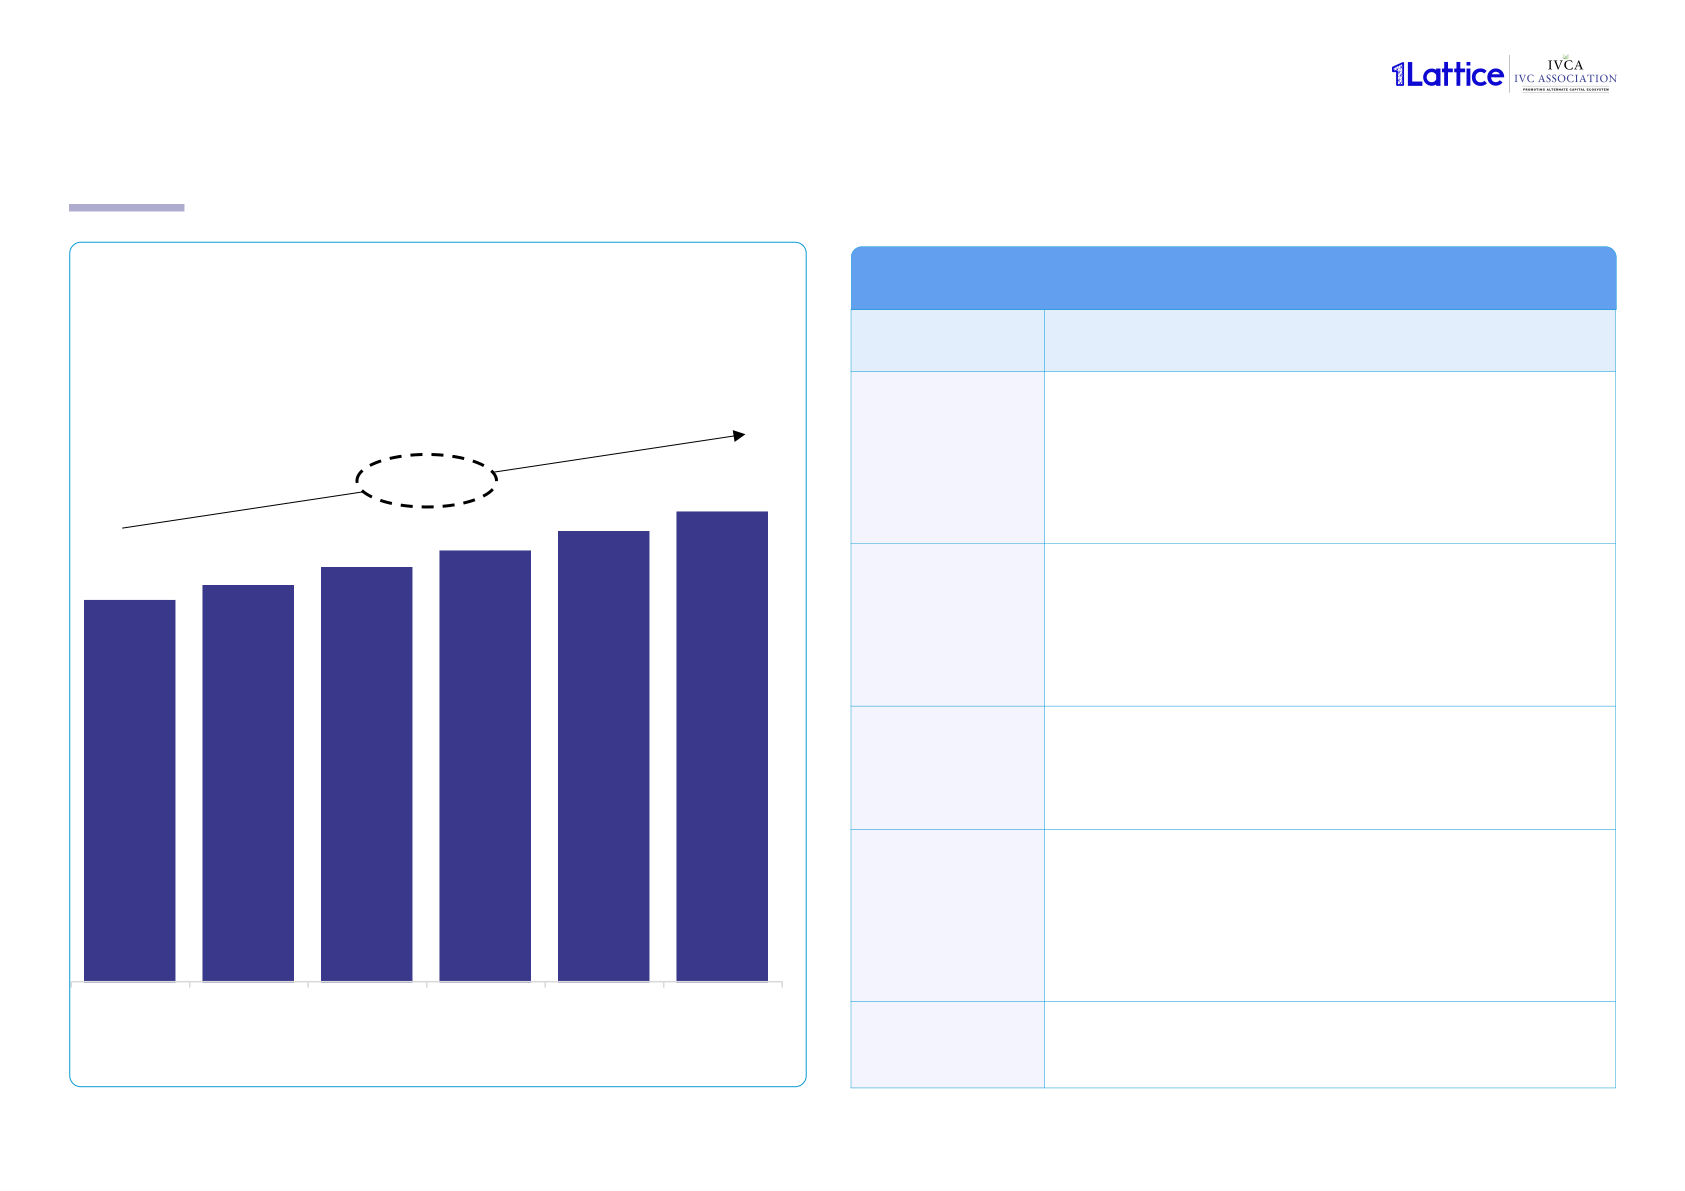
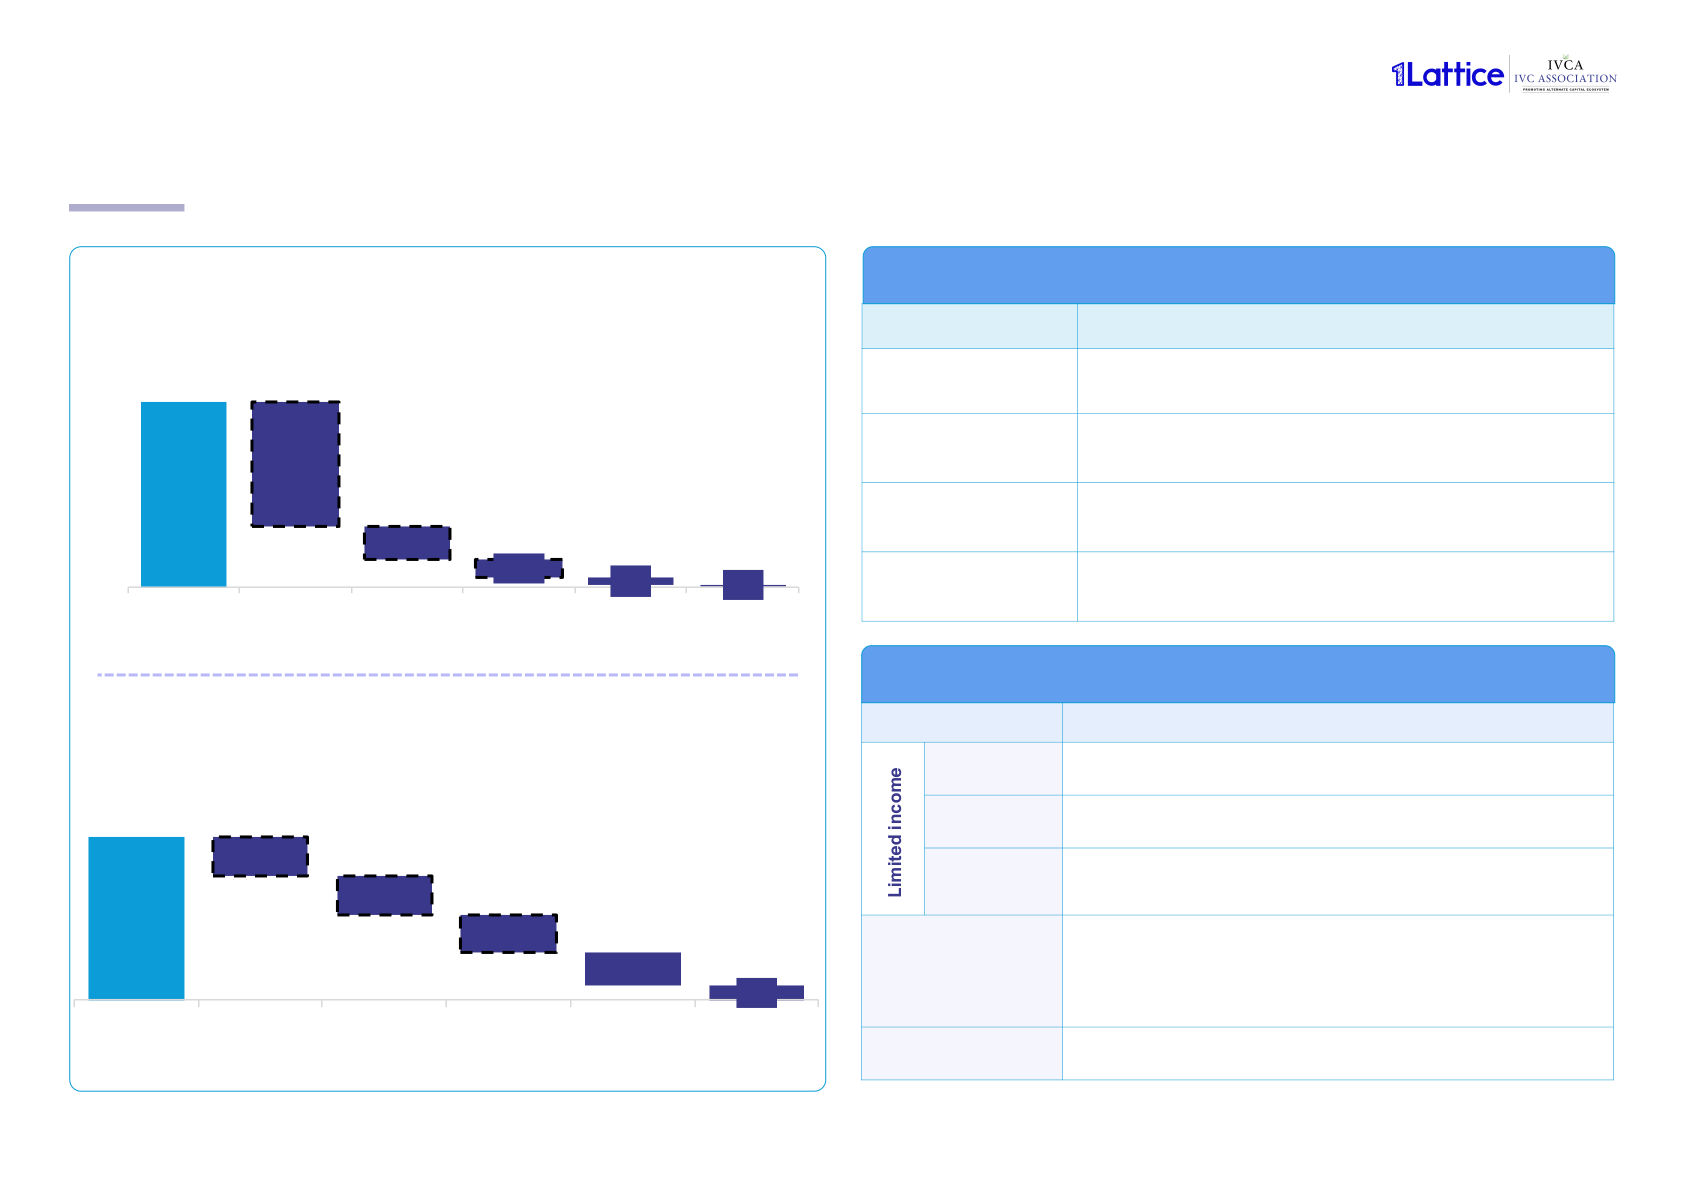
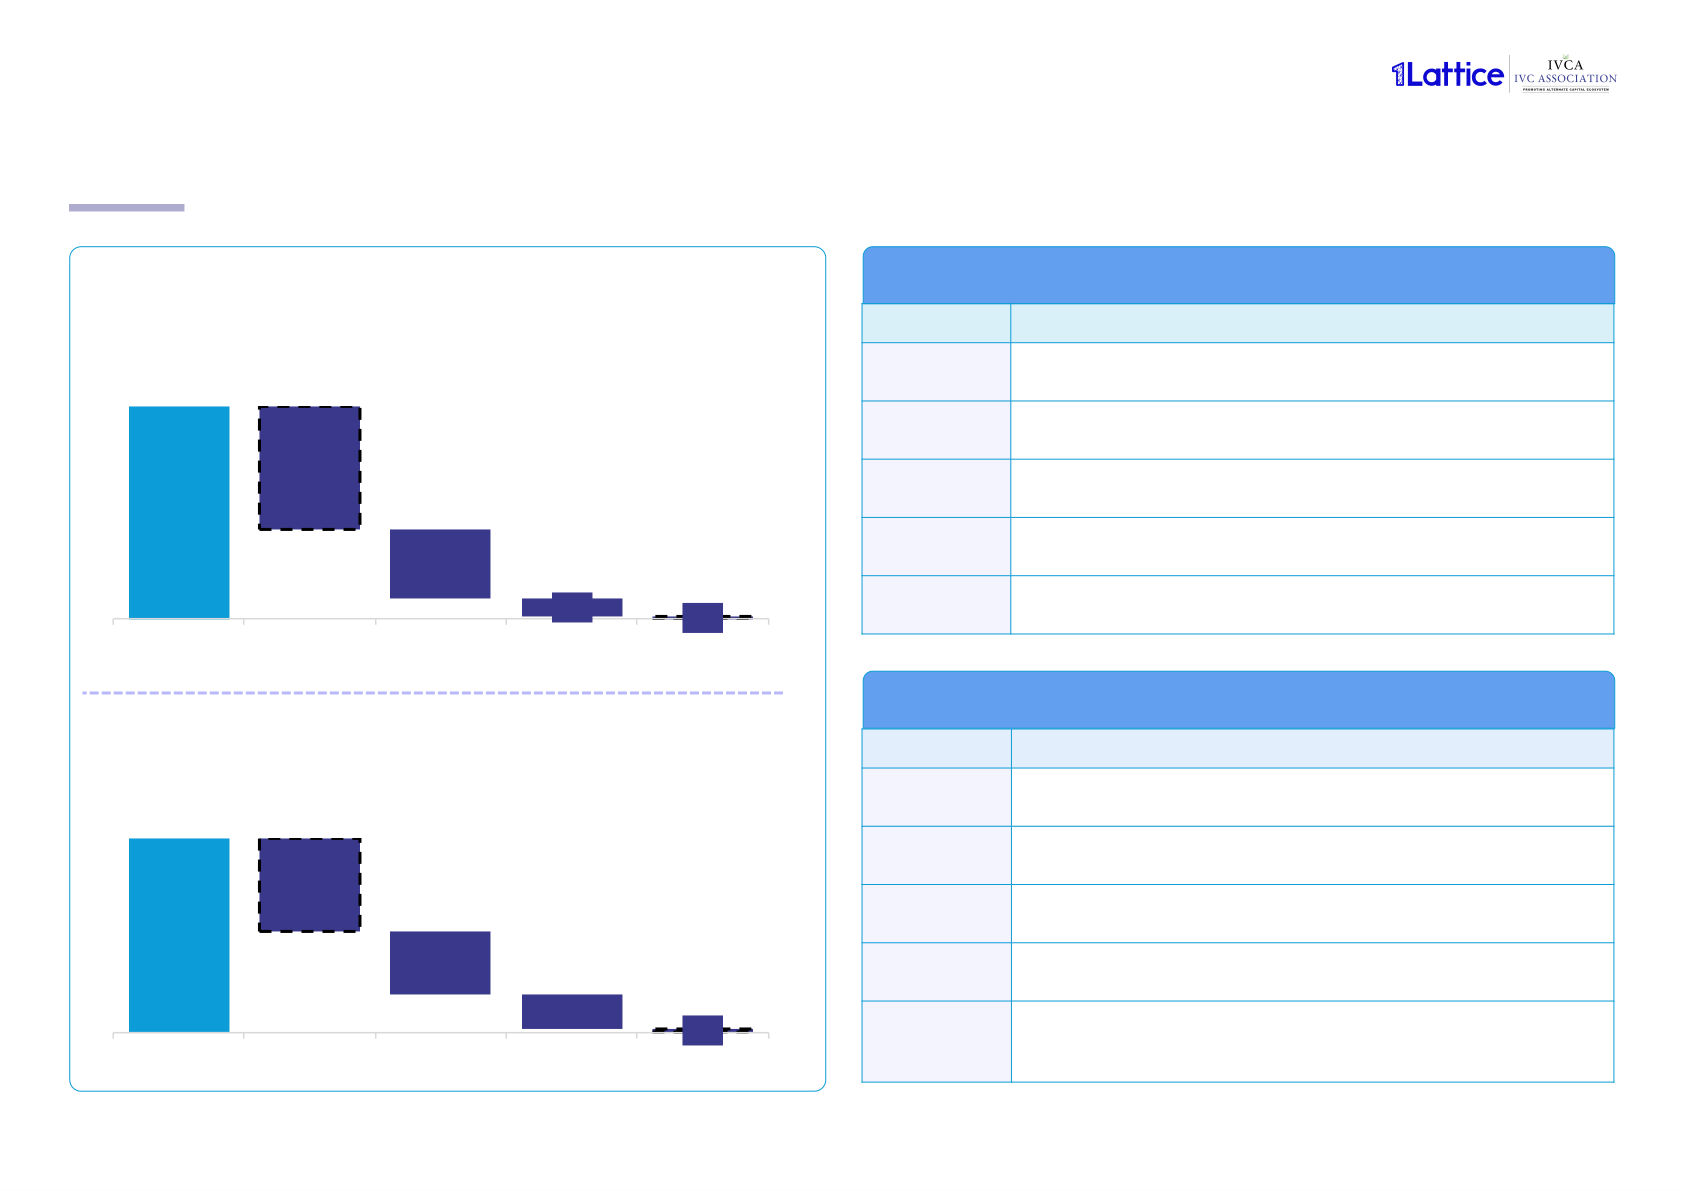
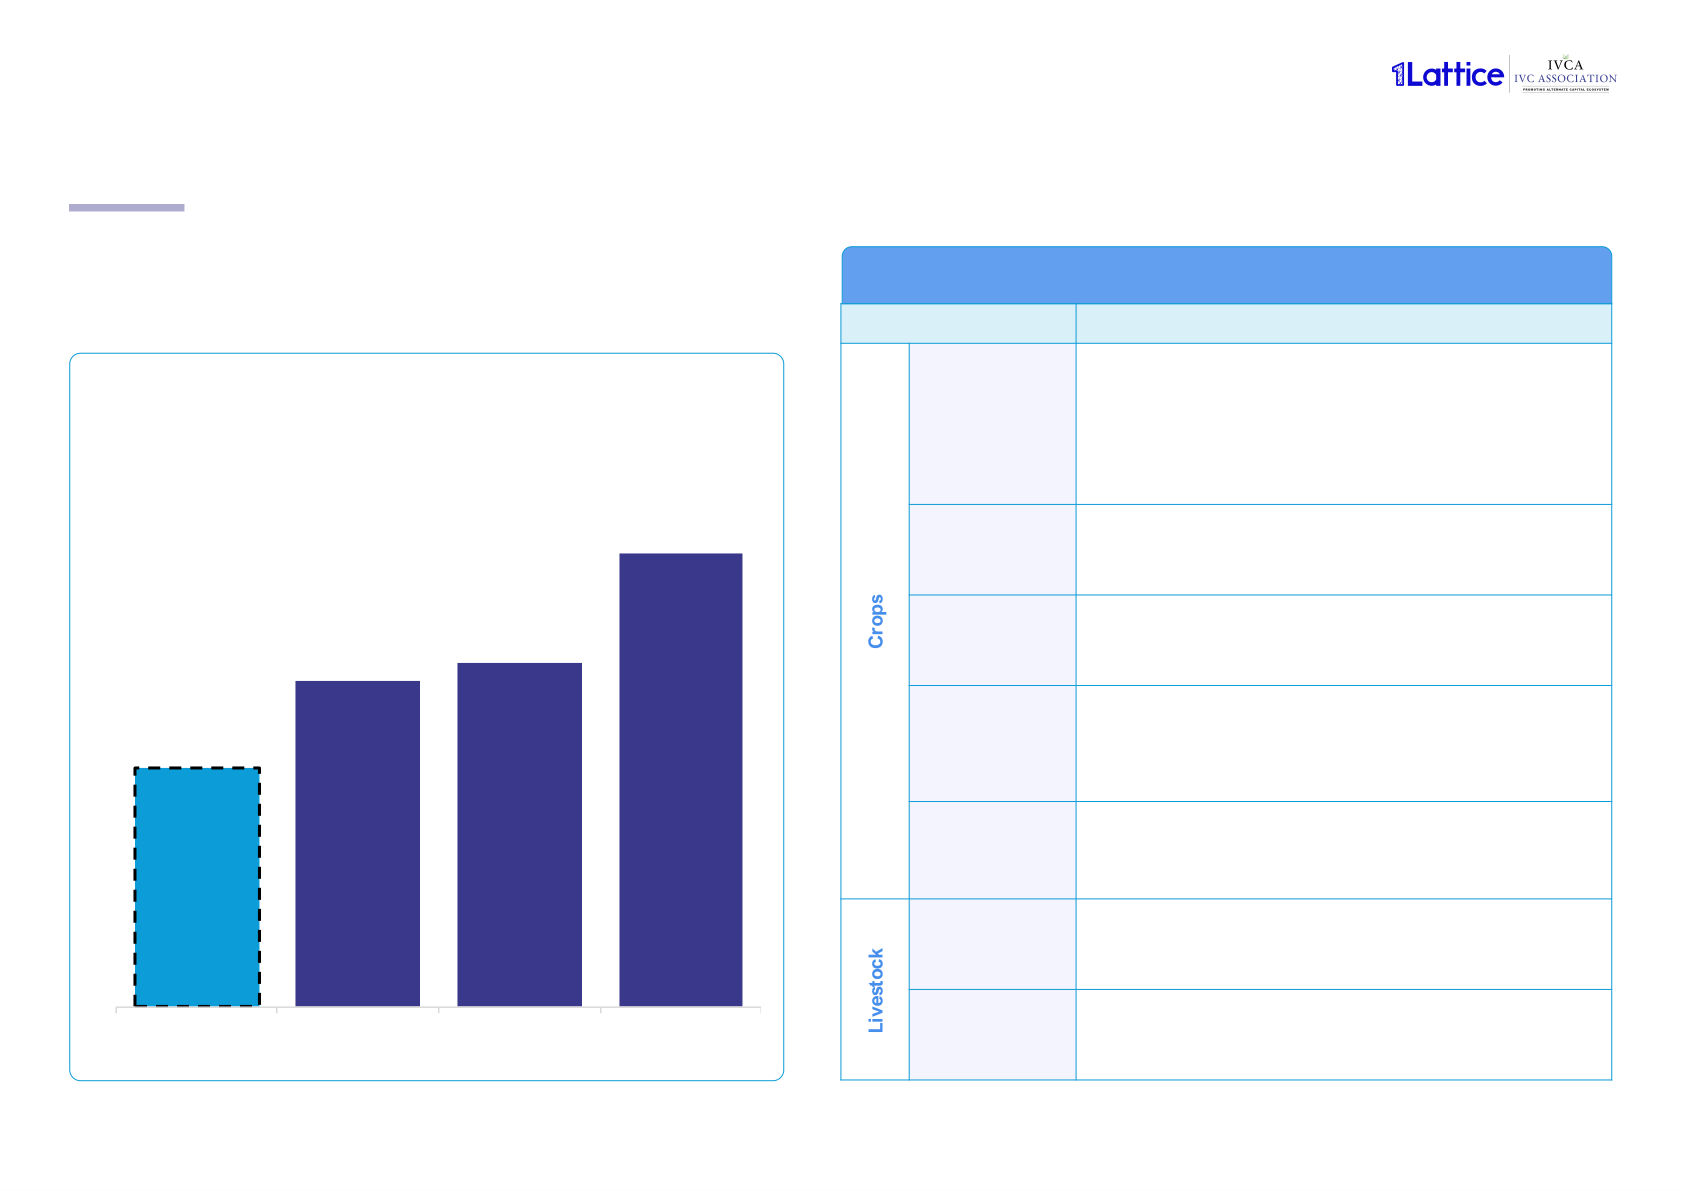
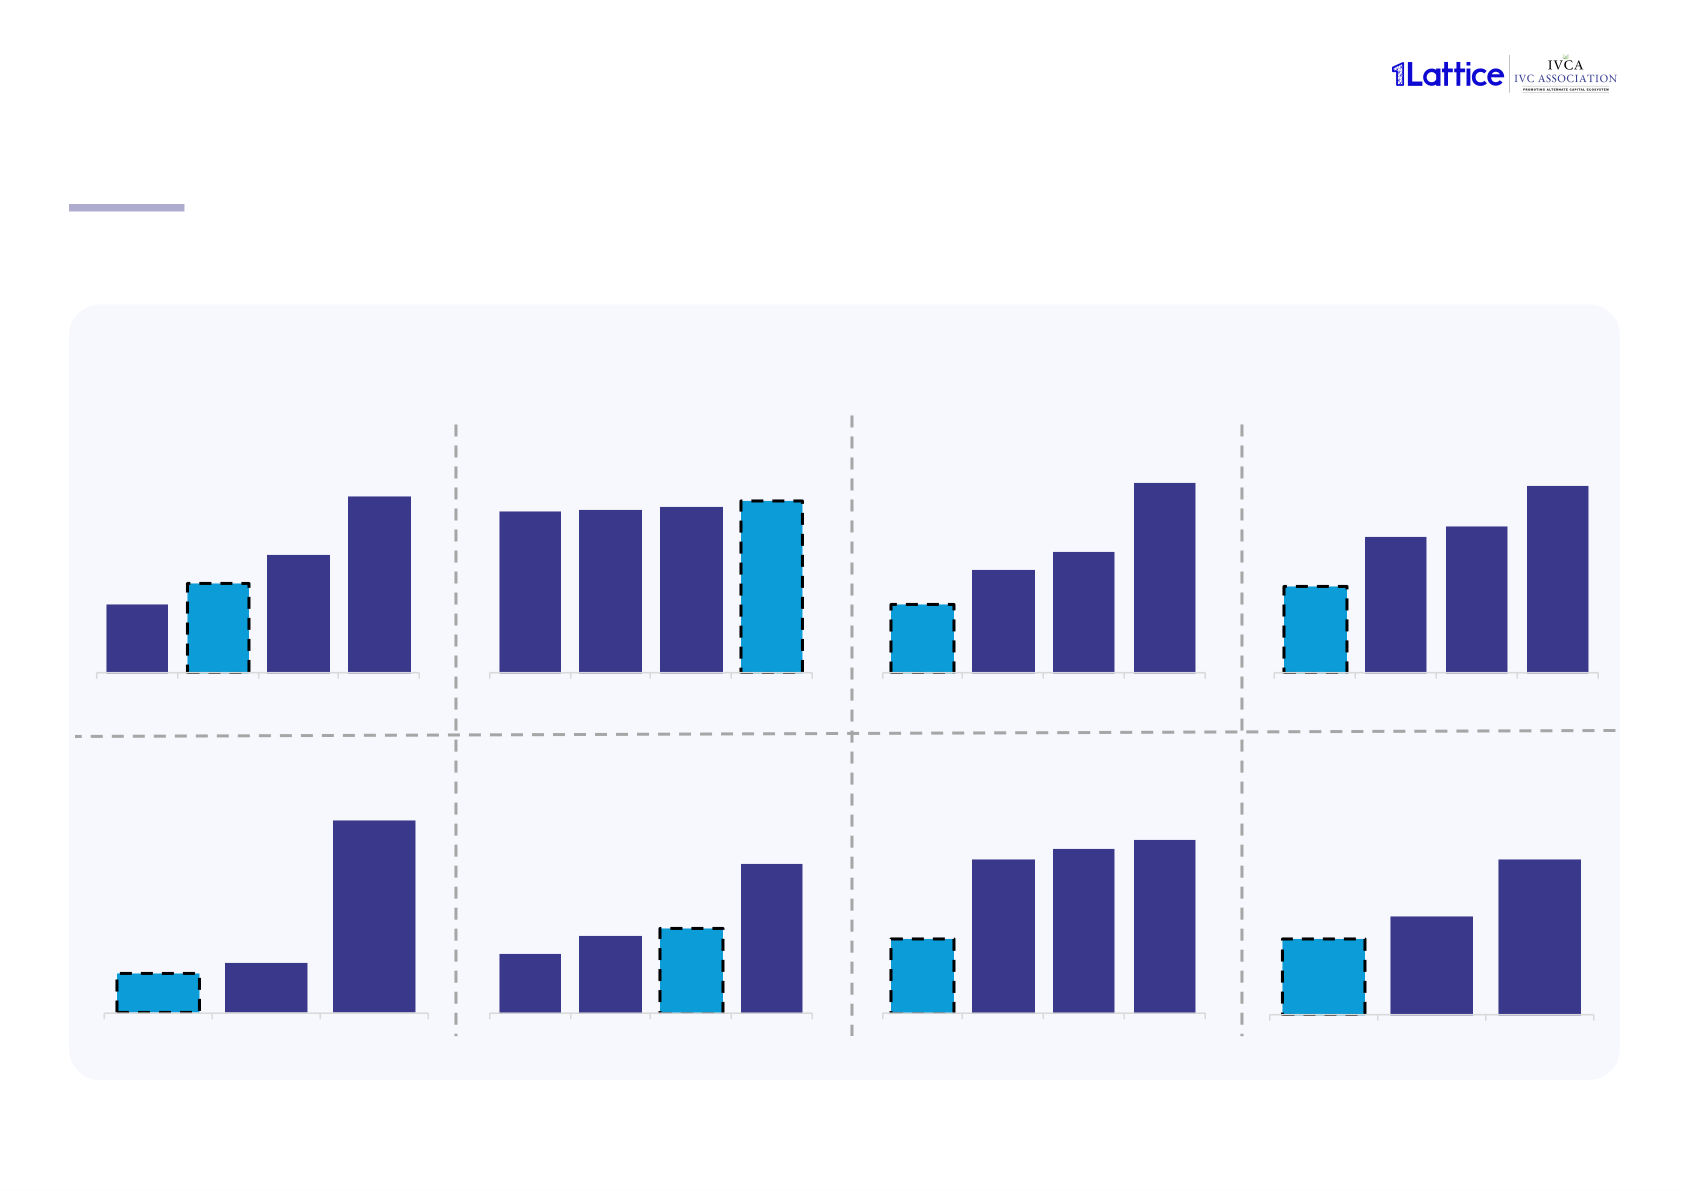
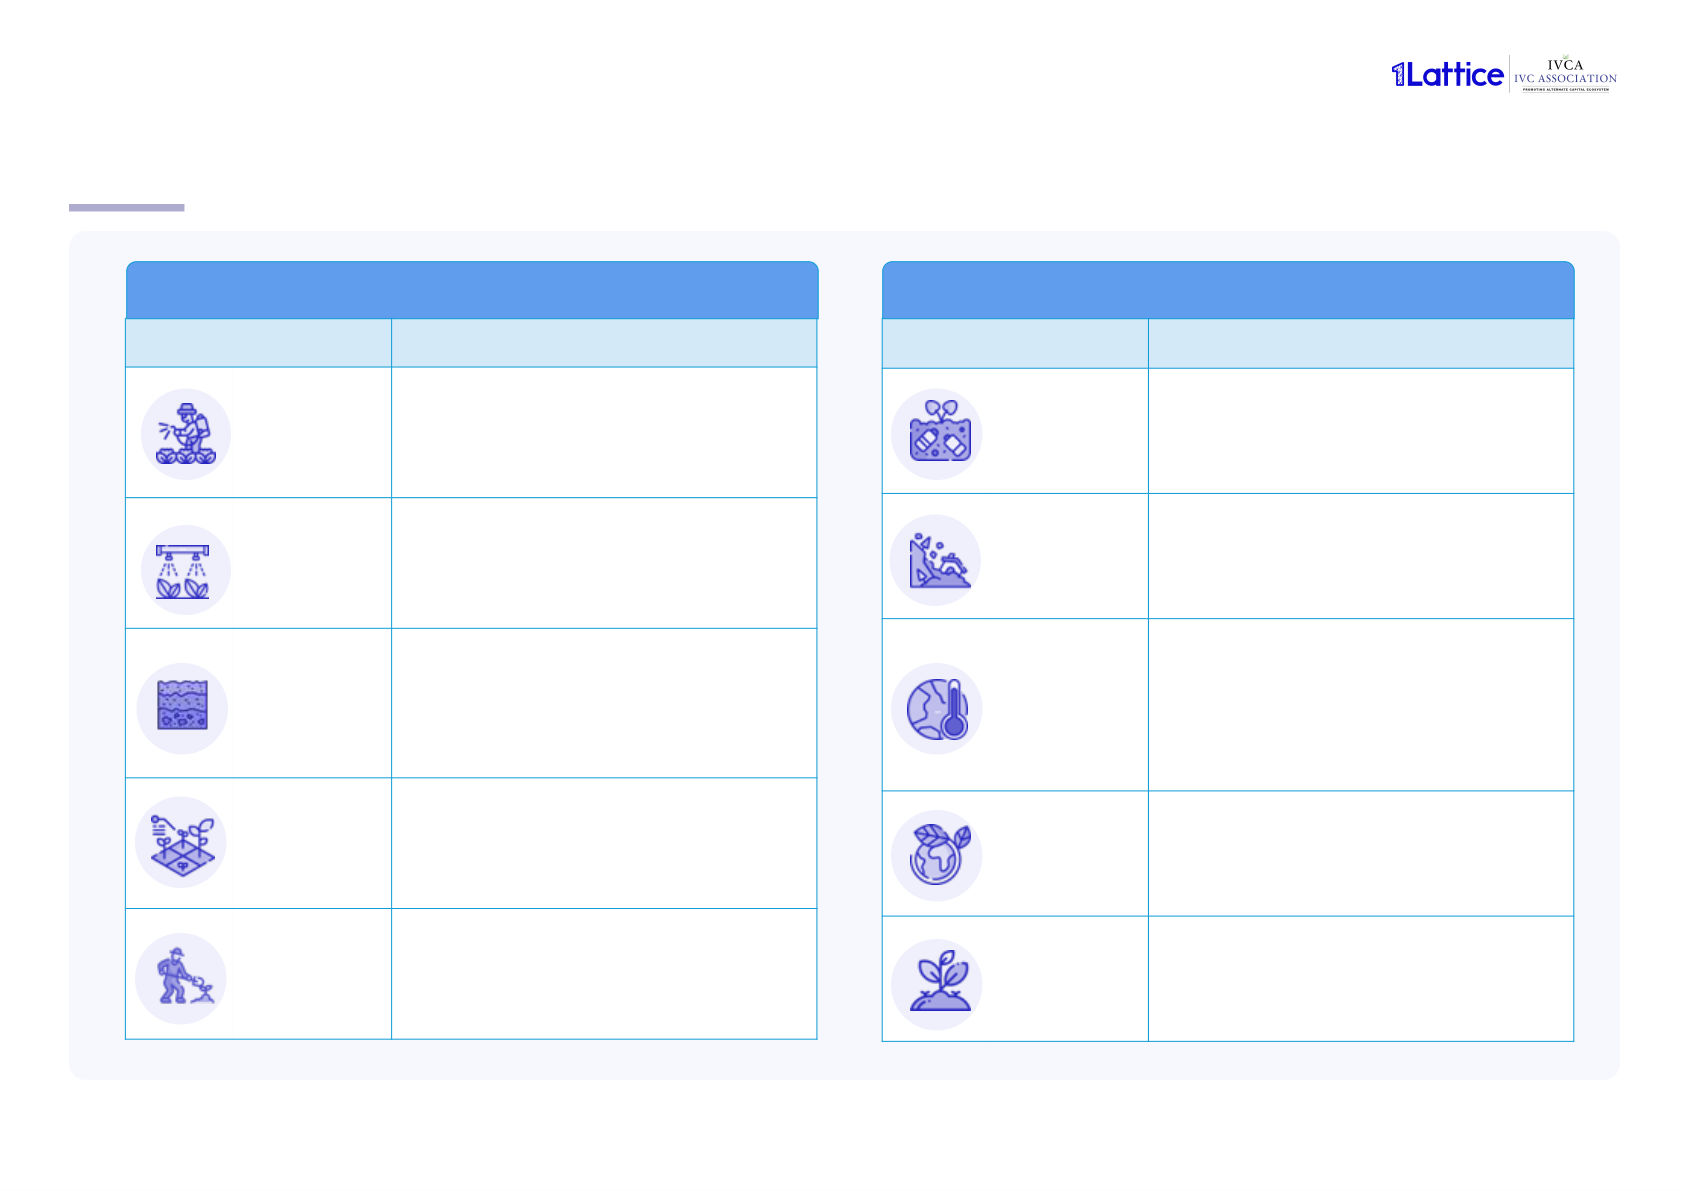
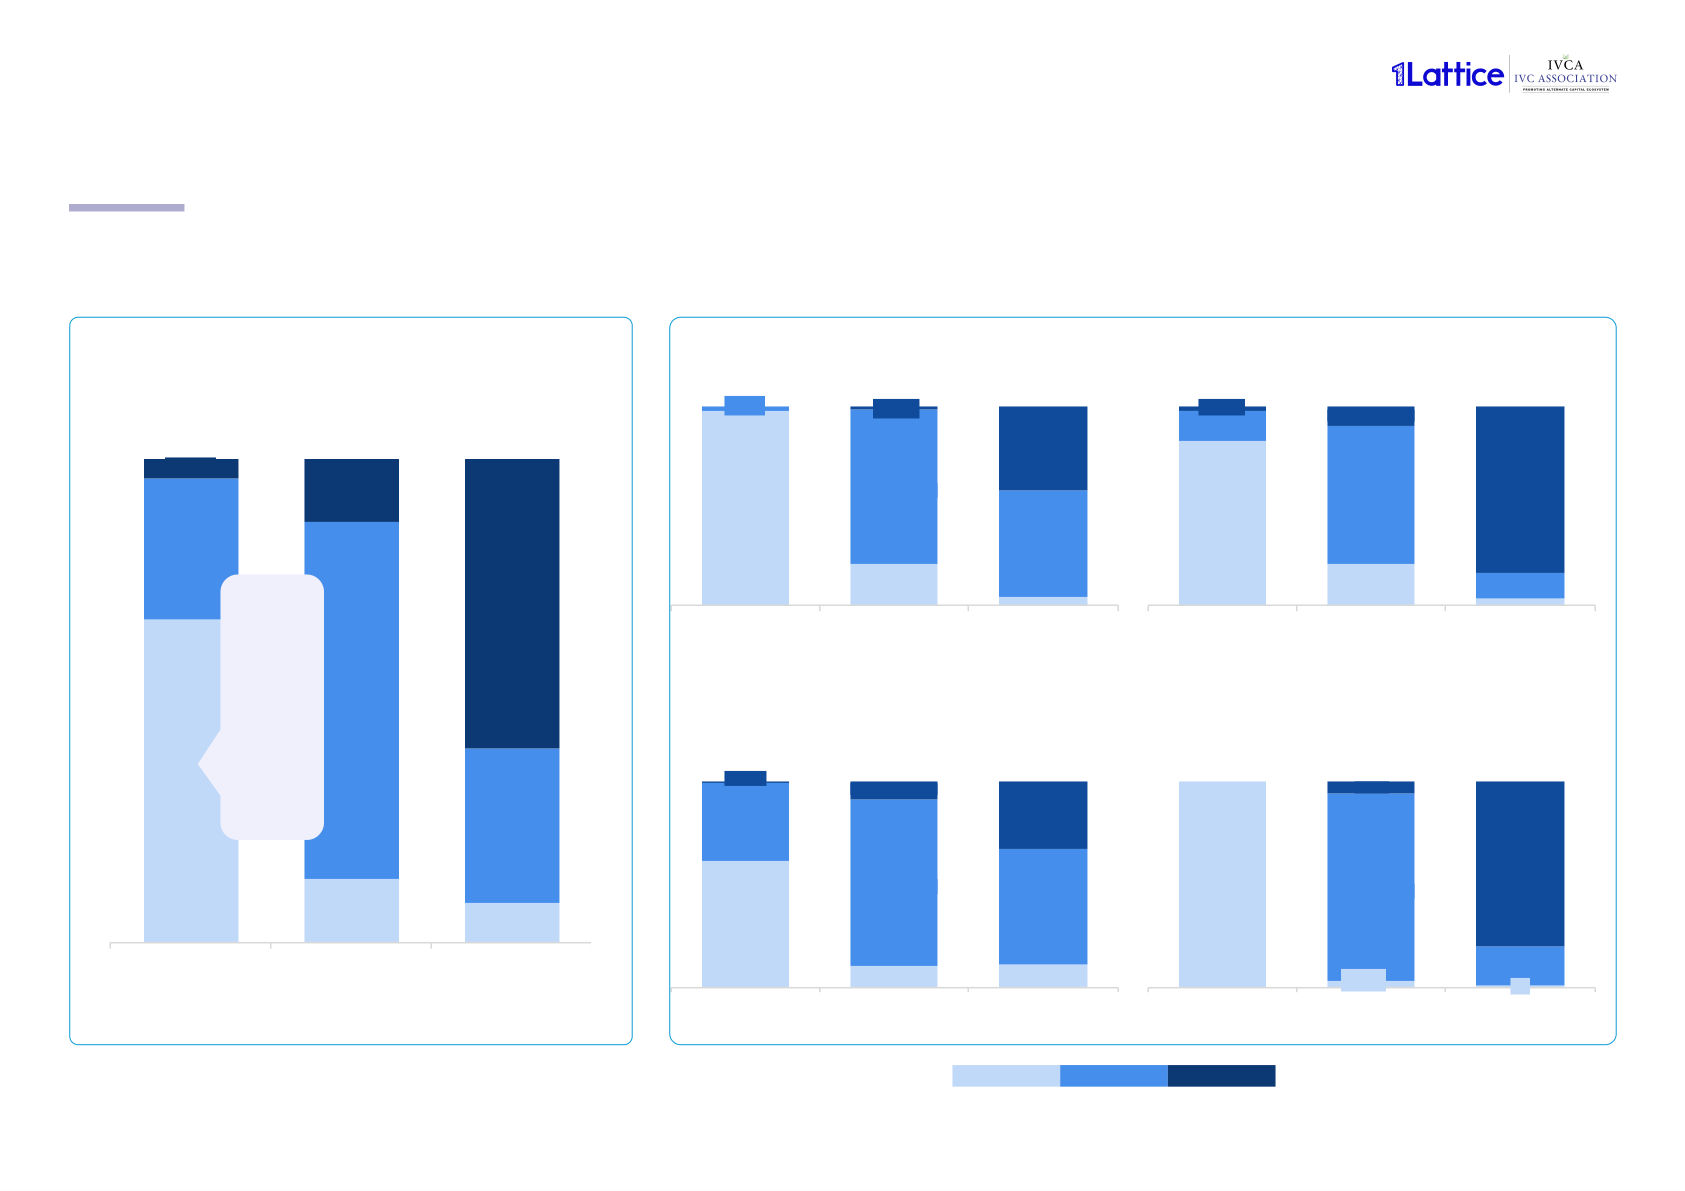
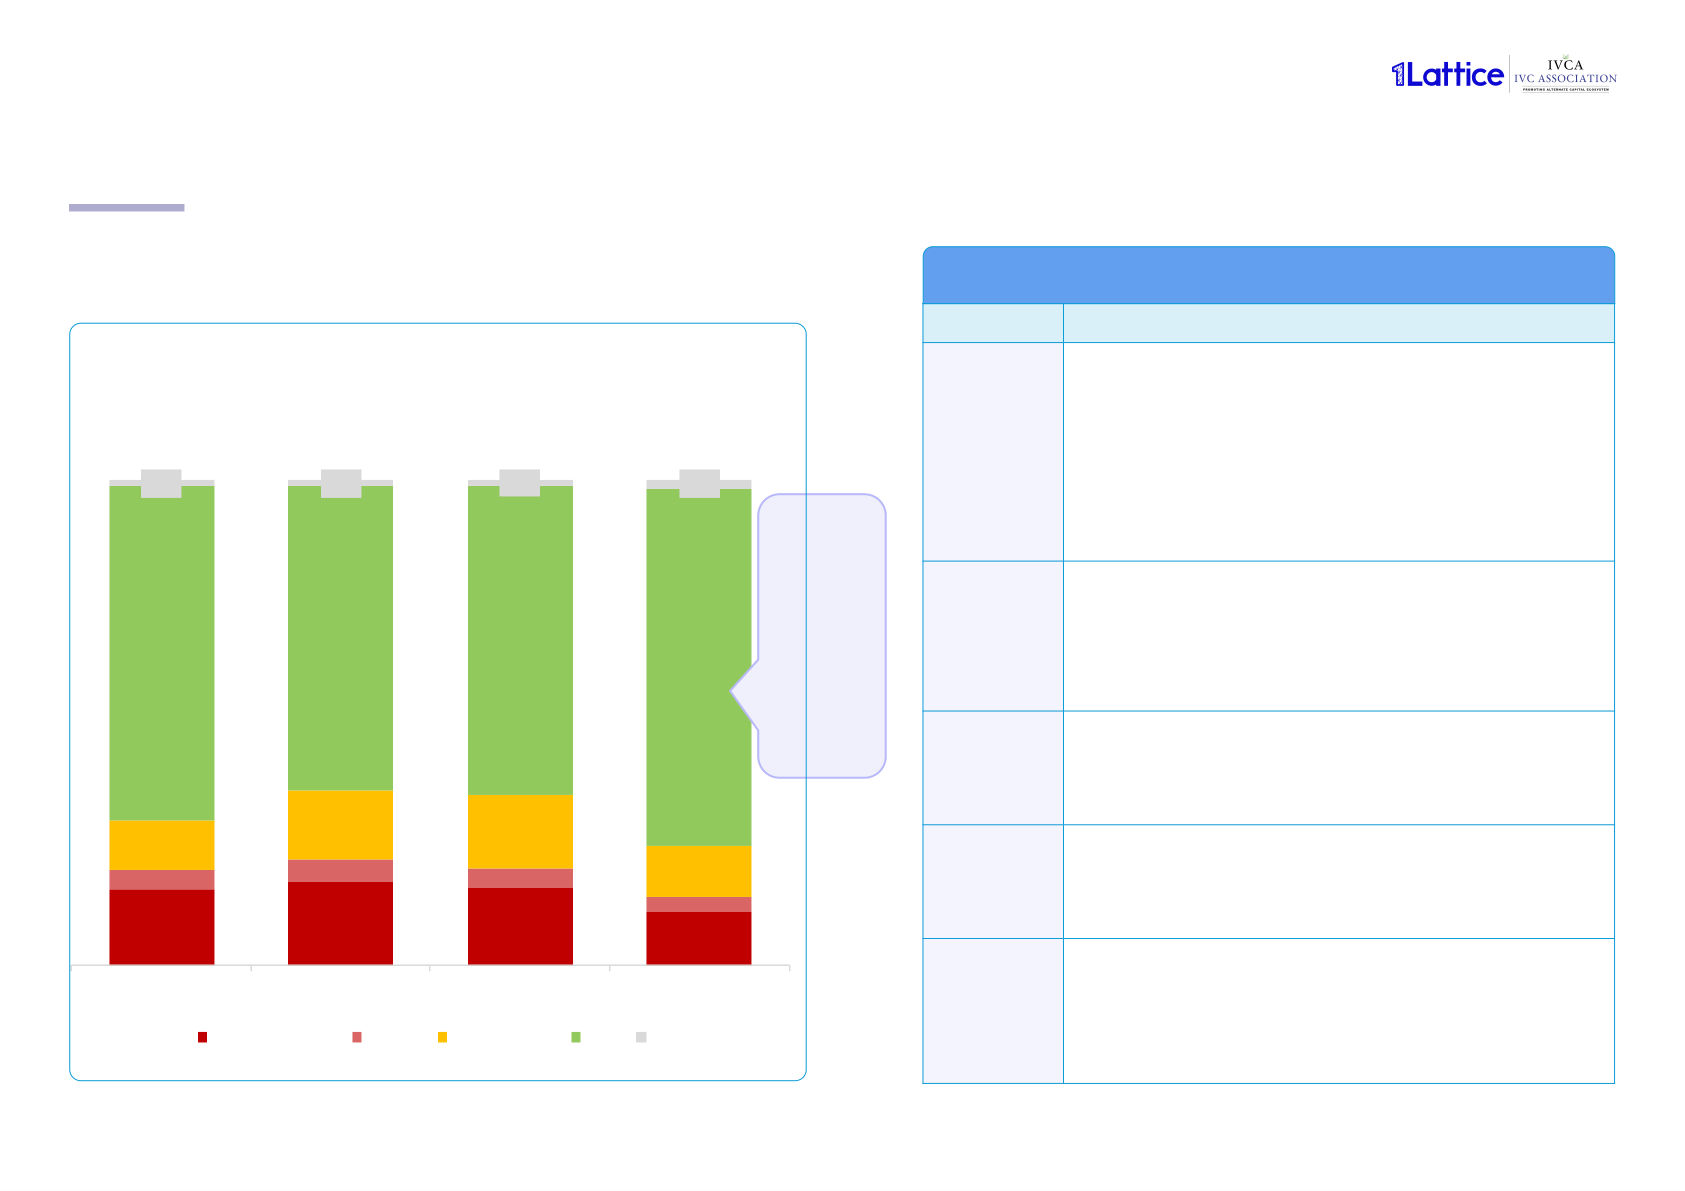
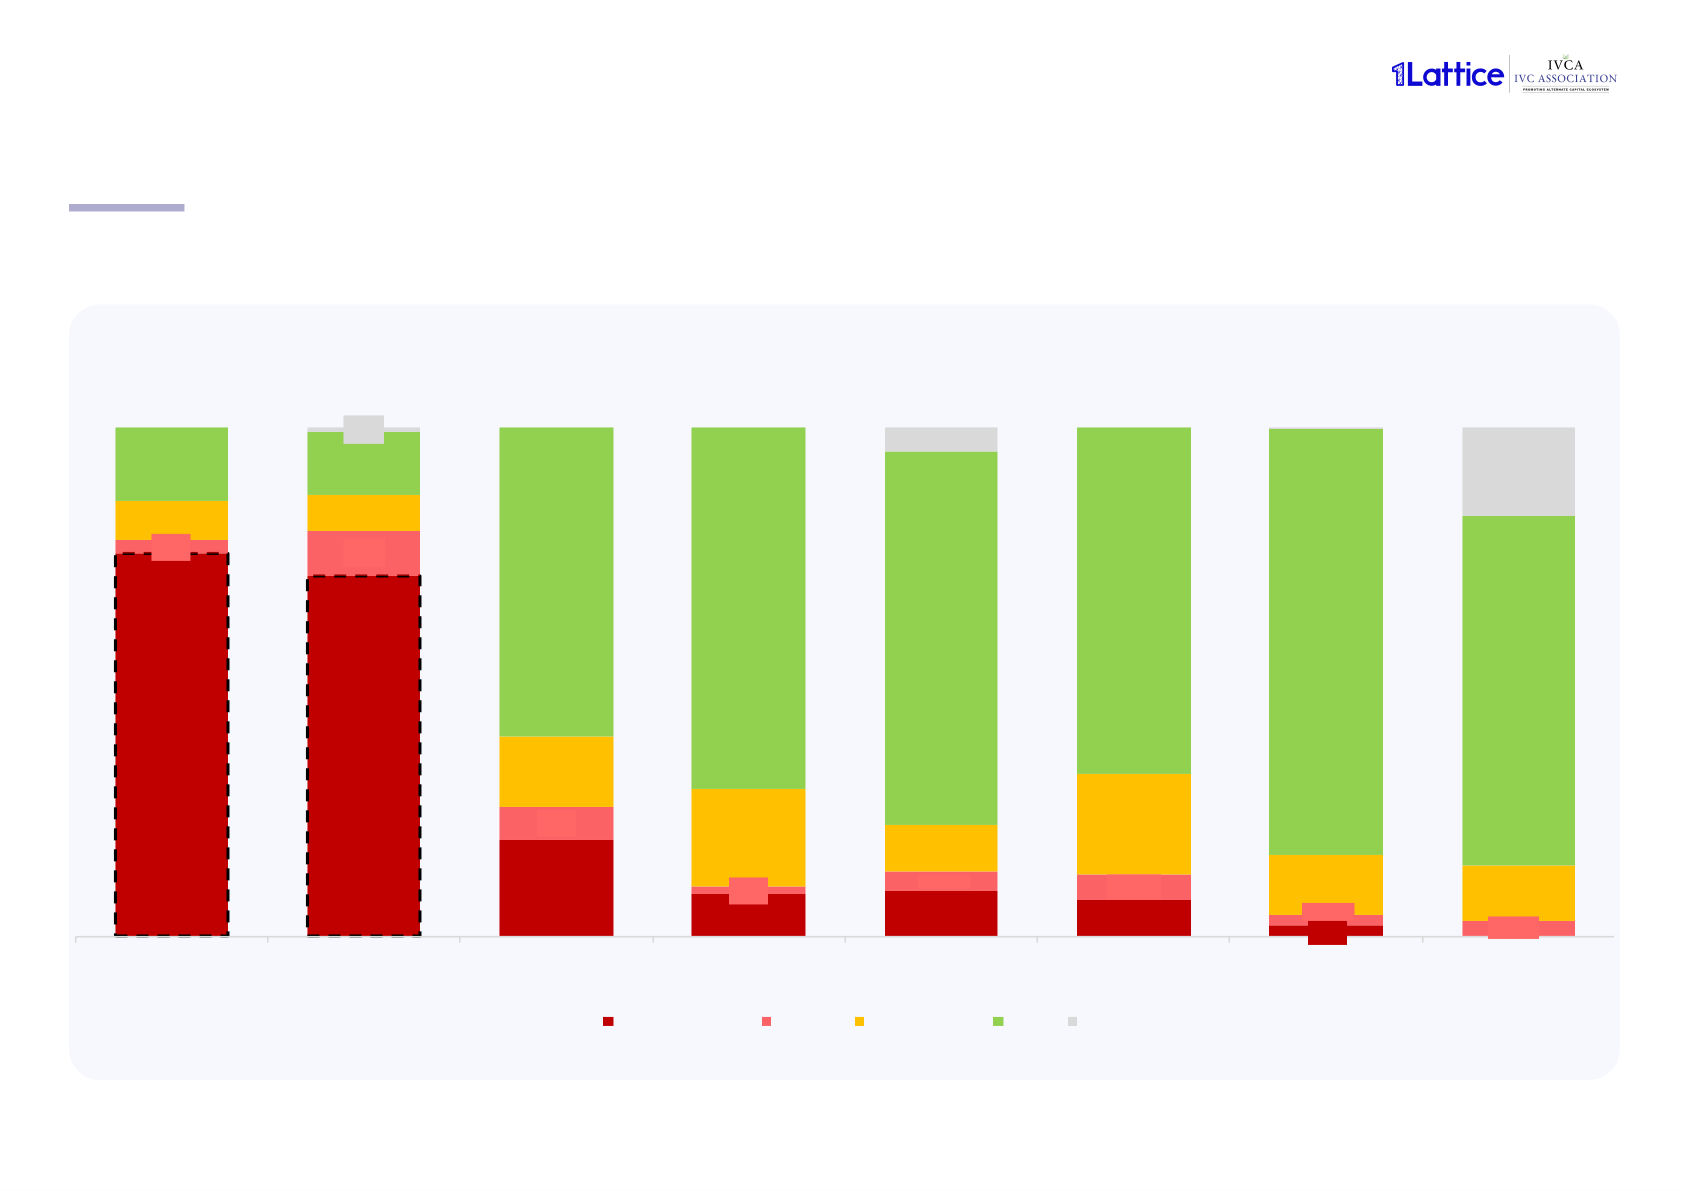
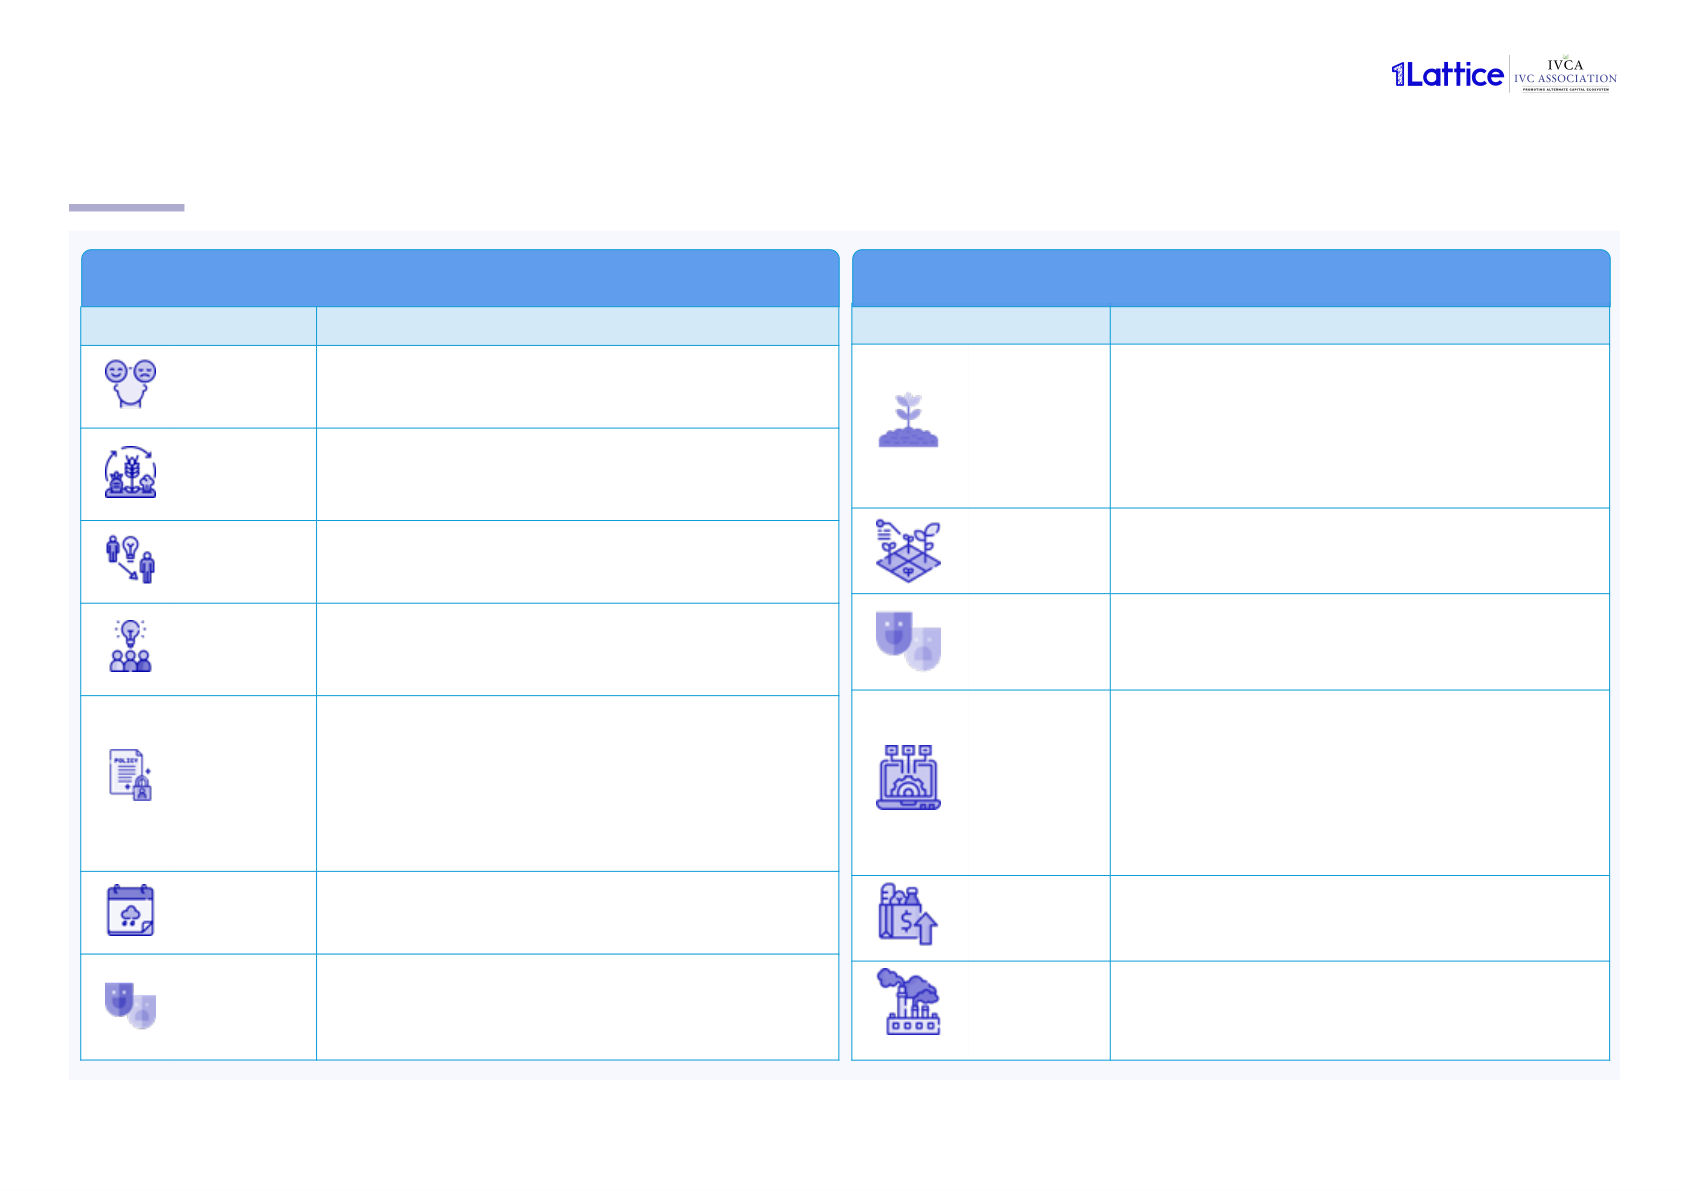
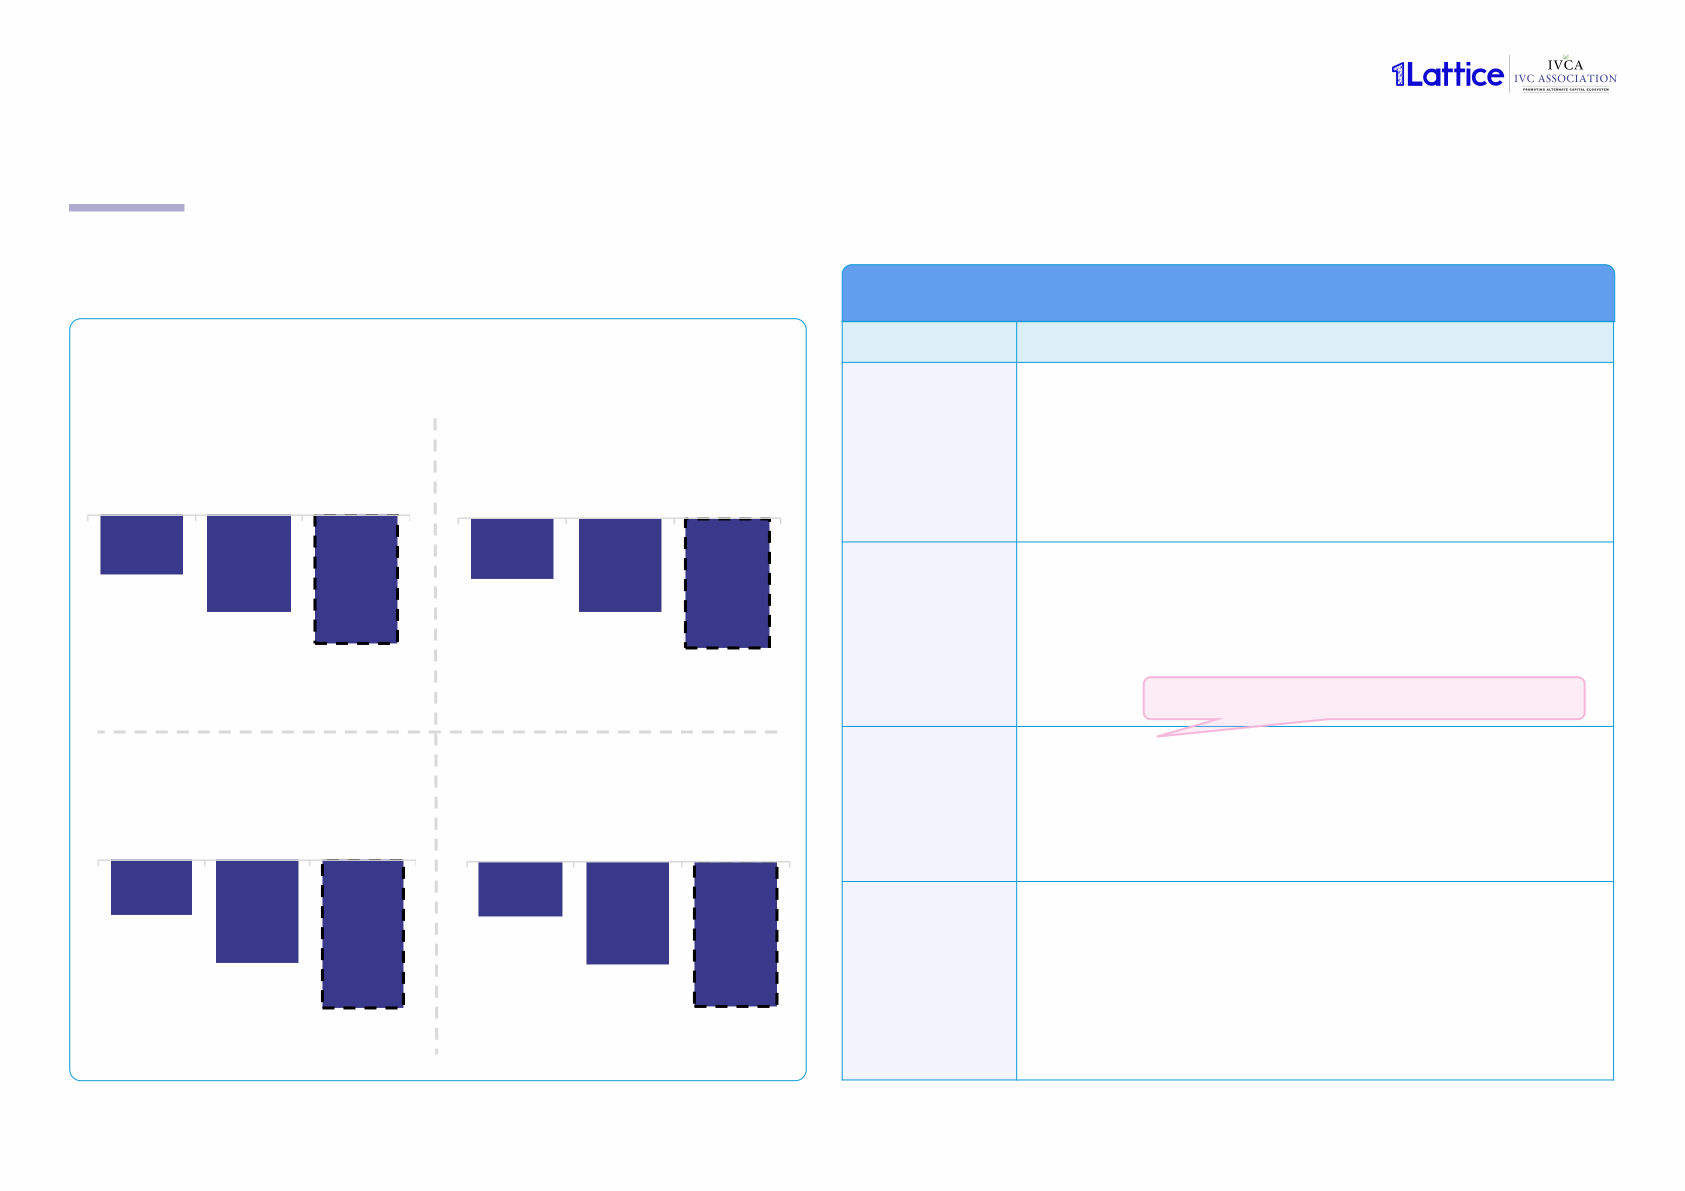
Table of contents [1/2] Executive summary 01 Current agri - market scenario 02 2.1 Current market production by value 2.1.1 Agri - market production by product category 2.2 Agri - market landscape by companies 2.3 Agri - market input and output pricing per acre 2.4 Agri - market production 5 - year forecast, 2024 - 2029 2.5 Agri - market challenges Agri - market investment scenario 03 3.1 Global investment scenario 3.2 Indian investment scenario 3.3 Private equity and venture capital current funding scenario 3.4 Private equity and venture capital funding 5 - year forecast, 2024 - 2029 Table of contents [2/2] Current agri - market 04 opportunities 4.1 Value chains by major type of agricultural output 4.2 Value chain analysis and innovations by stage 4.3 Case studies on innovations by companies 4.4 Learnings and recommendations from global markets Government and regulatory 05 environment 5.1 Regulatory evolution 5.2 Role of NABARD 5.3 Government backed thematic funds for agriculture 5.4 Government infrastructure development Foreword Indian agriculture, encompassing ground agriculture, livestock, and fisheries, is at the edge of a transformative era . This report presents a thorough analysis of innovations that are redefining the agricultural landscape in India . The sectors covered in this report include ground agriculture, livestock, and fisheries, each vital to the nation's economic and food security . The report explores the current agricultural market scenario, highlighting the challenges of fragmented land holdings, low yields, and water scarcity, which continue to hinder growth . This section sets the stage for understanding the urgent need for innovative solutions to boost productivity and sustainability . The report then delves into the investment landscape, detailing investment trends, along with insights into private equity and venture capital flows into the sector . This section underscores the increasing interest and opportunities for innovation - driven growth in agriculture . We also delve to a comprehensive examination of major agricultural value chains across different types . Here, we showcase innovations at various stages of the value chains, supported by case studies of pioneering Indian companies and learnings from global markets . These Abhishek Maiti examples illustrate how cutting - edge technologies and practices are enhancing efficiency, sustainability, and profitability . Director, Agri & Industrials, Additionally, the report provides an overview of the Indian policy and regulatory landscape, outlining key policies that support or challenge innovation in agriculture . This section aims to Technology & Internet offer a clear understanding of the regulatory environment and its impact on the sector’s development . This comprehensive report aims to equip stakeholders with actionable insights and strategies to foster a resilient and innovative agricultural sector in India . We trust that the findings and recommendations herein will inspire collaborative efforts towards sustainable agricultural growth and food security . Foreword The Indian agricultural landscape is on the cusp of a transformative era . The Union Budget for FY 2024 - 25 has ignited a beacon of hope for the entire ecosystem, with a strong emphasis on digital transformation . Productivity, resilience, research and self - reliance in agriculture are key priorities for ‘ Viksit Bharat’ . This report, in collaboration with Lattice 1 , couldn’t have come at a more opportune time . It delves deep into the intricate interplay of technology and tradition, showcasing the immense potential of digitization in propelling India’s agriculture to new heights . Following the successes of Aadhaar and UPI, the government’s plan to implement Agri Stack over the next three Rajat Tandon years as the next Digital Public Infrastructure is a testament to its commitment to revolutionizing the sector . The President, IVCA challenges of smallholder farmers, the need for sustainable practices, and the pursuit of food security have long been intertwined . Technology, particularly AI, ML, and IoT, offers a powerful toolkit to address these challenges head - on . By providing data - driven insights, optimizing resource utilization, and connecting farmers to better markets, these technologies can significantly enhance agricultural productivity and resilience . The role of institutions like NABARD in driving rural and agricultural development cannot be overstated . Their thematic funds focused on irrigation, infrastructure, innovation, and climate action have been instrumental in supporting the sector . NABARD’s comprehensive approach, encompassing financing, monitoring, capacity building, and policy advocacy, has been a cornerstone of India's agricultural progress . The government's initiatives to create a climate finance taxonomy are commendable . By directing capital towards climate - friendly projects, we are not only mitigating the impacts of climate change but also fostering a sustainable and resilient agricultural sector . The road ahead is undoubtedly filled with opportunities and challenges . However, with the right blend of government support, private investment, and innovation, India can emerge as a global leader in sustainable agriculture . This report is a valuable resource for understanding the current landscape and charting the course for the future . © 1Lattice | IVCA 5 Executive summary E xecutive summary: Agri - innovations [1/2] Findings Current agricultural market scenario • Overall Indian agriculture market comprising of ground agriculture (~60%), livestock (~30%) & fishing & aquaculture (~10%) is growing at ~5% per annum with an output value of ~INR 30 Lakh Cr ; Uttar Pradesh (~10% share) is the largest contributing state & Karnataka is the key emerging state growing at ~8% per annum – Indian ground agriculture market is growing at ~4% per annum with an output value of ~INR 18 Lakh Cr; Cereals (~25%) & fruits & vegetables (~25%) are the largest product categories; Uttar Pradesh (~15% share) is the largest contributing state & Telangana is the key emerg ing state growing at ~8% per annum – Indian livestock market is growing at ~5% per annum with an output value of ~INR 9 Lakh Cr; Milk (~70%) is the largest product category; Rajasthan (~15% share) is the largest contributing state & Goa is the key emerging state growing at ~13% per annum – Indian fisheries market is growing at ~7% per annum with an output value of ~INR 2 Lakh Cr; Market is evenly split between inland & marine fish; & Andhra Pradesh (~40% share) is the largest contributing state & Madhya Pradesh is the key emerging state growing at ~14% per ann um • Indian agriculture landscape is evolving from traditional players which focus on specific segments of the value chain to new - age players providing end to end solutions • Operating profit for ground agriculture across the top selling cereals, pulses, oilseeds, sugars & vegetables ranges between 60 - 70% • Overall Indian agricultural market is forecasted to grow from ~INR 31 Lakh Cr (FY25) to ~INR 38 Lakh Cr (FY30) at a rate of ~4% per annum; Growth driven by factors such as changing consumer demand, new farming methods, etc. Indian agricultural challenges • Key issues being faced by the Indian agricultural sector are: fragmented landholdings, marked productivity gap with competing nations, soil health, pot ential recession of water table, sowing behavior of farmers, climate change, lower processing outputs & rising labor prices – ~95% of farmers are semi - medium, small or marginal farmers who account for ~70% of farmland holdings in India while small farms (<10 ha) make up <2% of farmland in competing agricultural producing nations such as USA & Brazil – India’s crop average yield stands at ~9 ton / ha , notably lower than nations such as Brazil (~12 ton / ha) , USA (~13 ton / ha) & China (~17 ton / ha) ; Yield for major crops is on an average 2 - 3 times greater in Brazil, China & USA when compared to India – Deterioration of soil health is caused by excessive use of fertilizers, poor irrigation, malnutrition of soil, extractive agriculture & shifting cultivati on; Causing a host of serious issues such as soil pollution, landslides, climate change, ecosystem damage & malnutrition in plant s – 60 - 70% of Indian ground water resources can be classified as having a safe level of extraction , however 70 - 75% of ground water resources in key ground agriculture states such as Punjab & Rajasthan are over exploited – Sowing behaviour of Indian farmers is influenced by sentiment, traditional beliefs / superstitions, unscientific methods, limited access to te chn ology, & government schemes, resulting in issues such as soil degradation, reduced crop diversity, poor management of resources, infla tio n & pollution – Climate change is expected to decrease the yield of major crops in India by 11 - 26% by 2100 due to extreme weather conditions, herbicide effectiveness, land atmosphere interactions & erratic rainfall © 1Lattice | IVCA 6 Source(s): 1Lattice analysis Executive summary E xecutive summary: Agri - innovations [2/2] Findings Agri - market investment scenario • Highest value (~US $ 1 , 080 M) of investments and highest # companies (~ 89 ) receiving investments noted in CY 21 from PE / VC funds • PE / VC investments growing at a rate of ~ 40 % CAGR between CY 19 - 22 • Investments primarily focused on ground agriculture (~ 80 % ) and companies focused on up - stream stage of value chain (~ 50 % ) Current agri - market opportunities • The key innovations in agricultural procurement and production stage are seed management, the advent of biological agri - inputs & advanced machinery, and agronomy & IoT based solutions , solving issues such as poor crop resilience, low yields, and soil degradation • The key innovations in agricultural distribution are the emergence of tech - driven supply chains, end - to - end logistics services, and innovations in storage & warehousing, solving issues such as limited supply chain traceability, product loss, and low shelf life of various produce • The key innovations in agricultural post - processing are farm gate processing, the emergence of micro - processing units, and AI - based quality assessments, solving issues such as post - harvest losses, excessive middlemen, poor food quality, etc • The key innovations in retailing and selling are the emergence of online marketplaces, increased proliferation of credit & fintech financing solutions, and integrated supply chains, solving issues such as poor inventory management, lack of price transparency, credit availability, and lack of quality assurance • The key innovations in livestock & fisheries are transparent & diverse sourcing at scale and tech - enabled supply chains & quality checks , solving challenges such as adulteration, farmer remuneration, wastage, poor traceability, etc © 1Lattice | IVCA 7 Source(s): 1Lattice analysis Agenda Current agri - market scenario Agri - market production Agri - market landscape by companies Agri - market input & output pricing by category Agri - market 5 - year production forecast Agri - market challenges Agri - market investment scenario Current agri - market opportunities Government and regulatory environment Market definition The Indian agricultural market can be classified as ground agriculture, livestock, and fishing & aquaculture Agriculture market Ground agriculture Livestock Fishing & Aquaculture Cereals Rice, wheat, jowar, etc. Inland fishing Fresh water fish Milk and milk by - Milk products Pulses Gram, moong, masoor, etc. Marine fishing Sea water fish Castor, sunflower, coconut, Eggs from poultry Oilseeds etc. Poultry farming and poultry meat Sugars Sugarcane, gur palmyra, etc. Fibers Jute, mesta , kapas , etc. Sheep wool, goat hair, Wool & hair Indigo, dyes, and tanning etc. Colouring agents materials Tea, coffee, opium, saffron, Dung Manure and methane Drugs & narcotics isabgol , etc. Cardamon, chilli, pepper, Condiments & spices Silk and honey ginger, etc. Silk & honey production Fruits & vegetables Banana, tomato, potato, etc. By - products Straw, stocks, etc. Increment in Sale increase in number Industrial wood, firewood, livestock of livestock Forestry & logging non - timber forest products Crops grown in home Kitchen garden Cattle, buffalo, goat, gardens Meat group sheep, and pig Rubber, grass, mushroom, Other crops etc. Source(s): National Statistical Office, Media reports, 1Lattice analysis © 1Lattice | IVCA 9 Indian agriculture market Indian agriculture market has grown to ~INR 30 Lakh Cr at ~5% during FY19 - 24, ground agriculture contributing the major share (~60%) Largest share is contributed by ground agriculture (~60%); Indian agriculture market witnessed growth Largest contributing state is Uttar Pradesh (~12%) at a CAGR of ~5% between FY19 - 24 Fishing & Aquaculture 7% Others 14% Haryana , 4% Output value of India agriculture market Telangana , 4% Livestock , 32% Bihar , 4% (INR Lakh Cr, FY19 - 24, FY12 prices) Punjab 4% Karnatak … Tamil Nadu 6% West Bengal , 7% Gujurat 7% CAGR Madhya Pradesh 8% ~5% 29.7 Andra Pradesh 8% Ground Agriculture 61% 28.4 Rajasthan 9% 27.2 Maharasthra 9% 26.1 25.1 Uttar Pradesh 12% 23.8 Share of agriculture, forestry & fishing, State-wise contribution, FY24E* FY24E* Emerging states like Karnataka, Telangana, and Maharashtra have shown 7 - 8% CAGR between FY19 - 24 Output value (INR Emerging states CAGR (FY19 - 24E*) Lakh Cr, FY24E*) Karnataka 1.7 8% Telangana 1.1 7% Maharashtra 2.8 7% Arunachal Pradesh 0.1 6% FY19 FY20 FY21 FY22 FY23 FY24E* Rajasthan 2.8 6% Note(s): *Estimated Source(s): As per data released by National Statistical Office in state - wise and item - wise value of output from agriculture, for estry and fishing report 2024; 1Lattice analysis © 1Lattice | IVCA 10 Ground agriculture Indian ground agriculture market has grown to ~INR 18 Lakh Cr at ~4% during FY19 - 24 with cereals (~25%), fruits & vegetables (~25%) playing a key role Largest share is contributed by cereals, & fruits & vegetables (~25%); Largest contributing state is Uttar Pradesh (~15%) Indian ground agriculture market witnessed growth at a CAGR of ~4% between FY19 - 24 Others 19% Others , 20% Sugar , 5% Haryana 3% Output value of Indian ground agriculture Bihar , 3% Condiments & spices , 6% Tamil Nadu , 4% Andhra … (INR Lakh Cr, FY19 - 24, FY12 prices) Oil seeds 8% Punjab 5% West Bengal 6% Forestry & logging 14% Karnataka 7% CAGR Gujrat , 7% ~4% Fruits & vegetables 18.4 Rajasthan 8% 24% 17.7 Madhya Pradesh 9% 17.0 16.5 Maharashtra 11% 15.9 Cereals , 24% 15.1 Uttar Pradesh 13% Types of crops, FY24E* States, FY24E* Telangana is a key emerging state with a CAGR of 8% between FY19 - 24 Output value CAGR Emerging states (INR Lakh Cr, FY24E*) (FY19 - 24E*) Telangana 0.6 8% 1.2 Karnataka 7% 0.1 Arunachal Pradesh 7% FY19 FY20 FY21 FY22 FY23 FY24E* Maharashtra 2.1 7% Note(s): *estimated Source(s): As per data released by National Statistical Office in state - wise and item - wise value of output from agriculture, for estry and fishing report 2024; 1Lattice analysis © 1Lattice | IVCA 11 Livestock Indian livestock market has grown to ~INR 9 Lakh Cr at ~5% during FY19 - 24 with milk (~70%) and meat (~25%) playing a key role Largest share is contributed by milk (~70%); Indian livestock market witnessed growth Largest contributing state is Rajasthan (~15%) at a CAGR of ~5% between FY19 - 24 Others , 6% Others, 19% Eggs , 4% Output value of Indian livestock Meat , 23% Karnataka 5% Haryana 5% (INR Lakh Cr, FY19 - 24, FY12 prices) West Bengal , 5% Telangana , 6% Gujrat , 6% Madhya Pradesh 6% CAGR Maharastra 7% ~5% 9.2 Andhra Pradesh 8% Milk 67% 8.8 Tamil Nadu 9% 8.4 Uttar Pradesh , 11% 8.0 7.6 Rajasthan 13% 7.2 Types of livestock, FY24E* States, FY24E* Emerging states like Goa, Karnataka, and Rajasthan have shown 9 - 13% CAGR between FY19 - 24 Output value CAGR Emerging states (INR Lakh Cr, FY24E*) (FY19 - 24E*) Goa 0.004 13% Karnataka 0.464 12% Rajasthan 1.248 9% FY19 FY20 FY21 FY22 FY23 FY24E* Bihar 0.462 7% Note(s): *estimated Source(s): As per data released by National Statistical Office in state - wise and item - wise value of output from agriculture, for estry and fishing report 2024; 1Lattice analysis © 1Lattice | IVCA 12 Fishing and aquaculture Indian fishing & aquaculture market has grown to ~INR 2 Lakh Cr at ~7% between FY19 - 24, with inland fish (~55%) playing a key role Largest share is contributed by inland fish (~55%); Indian fishing & aquaculture market witnessed growth Largest contributing state is Andhra Pradesh (~40%) at a CAGR of ~7% between FY19 - 24 Others , 14% Gujarat , 3% Output value of Indian fishing & aquaculture Kerala 3% Uttar … Marine fish , 47% Chattisgarh 4% (INR Lakh Cr, FY19 - 24, FY12 prices) Tamil Nadu , 4% Bihar , 4% Assam 4% Odisha 5% West Bengal 15% CAGR ~7% 2.1 Inland fish 53% 2.0 Andhra Pradesh , 41% 1.8 1.6 Types of fish, FY24E* States, FY24E* 1.5 1.5 Madhya Pradesh is an emerging state having 14% CAGR between FY19 - 24 Output value CAGR Emerging states (INR Lakh Cr, FY24E*) (FY19 - 24E*) Madhya Pradesh 0.028 14% Meghalaya 0.002 10% FY19 FY20 FY21 FY22 FY23 FY24E* Punjab 0.013 9% Telangana 0.035 9% Note(s): *estimated Source(s): As per data released by National Statistical Office in state - wise and item - wise value of output from agriculture, for estry and fishing report 2024; 1Lattice analysis © 1Lattice | IVCA 13 Agenda Current agri - market scenario Agri - market production Agri - market landscape by companies Agri - market input & output pricing by category Agri - market 5 - year production forecast Agri - market challenges Agri - market investment scenario Current agri - market opportunities Government and regulatory environment Traditional agriculture players Traditional agriculture players are specialized in specific segments of value chain focusing on providing efficient solutions in that respective segment Financing Production Logistics Storage Wholesale / retailing Loan / finance / pre - payment Seed providers Non - temperature controlled Non - temperature controlled Retailing enablers Crop nutrition & protection Farming equipment Cold logistics provides Cold storage provides Wholesale / distribution providers Traditional insurance companies Multi - services / offerings companies* Government Note(s): *present in two or more segments Source(s): Company websites, Media reports, 1Lattice analysis © 1Lattice | IVCA 15 New - age agriculture players New - age agricultural companies are focusing more on providing end - to - end agricultural solutions with key focus on logistics and distribution Financing Production Equipment / storage Logistics / distribution / retailing Loan / finance / pre - payment Input providers Equipment leasing Distribution and retail enablers Smart farm equipment Advisory IoT + drone Meat distribution and retail New - age insurance companies Hydroponics Storage management Logistics providers AgricxLab Crop quality assessment Skyware Automation Multi - services / offerings companies* Government Note(s): *present in two or more stages Source(s): Company websites, Media reports, 1Lattice analysis © 1Lattice | IVCA 16 Agenda Current agri - market scenario Agri - market production Agri - market landscape by companies Agri - market input & output pricing by category Agri - market 5 - year production forecast Agri - market challenges Agri - market investment scenario Current agri - market opportunities Government and regulatory environment Basmati rice and wheat Operating profit for ground agriculture across the top selling cereals, pulses, oilseeds, sugars, and vegetables ranges between 60 - 70% [1/3] Cost and margin structure per acre: Basmati rice (% of income) 8% 4% 4% 4% 4% 4% 1% 3% 100% 68% Income per acre Cost of fertilizer Cost of Cost of plant Cost of Cost of seed & Cost of Cost of land Tranportation Operating profit miscellaneous protection intercultural sowing harvesting & preperation cost activities operations threshing Cost and margin structure per acre: Wheat (% of income) 8% 7% 7% 5% 4% 4% 1% 3% 100% 60% Income per Cost of fertilizer Cost of seed & Cost of Cost of plant Cost of land Cost of Cost of Tranportation Operating profit acre sowing miscellaneous protection preperation harvesting & intercultural cost activities threshing operations Source(s): Agri Farming, Media reports, 1Lattice analysis © 1Lattice | IVCA 18 Groundnut and black gram Operating profit for ground agriculture across the top selling cereals, pulses, oilseeds, sugars, and vegetables ranges between 60 - 70% [2/3] Cost and margin structure per acre: Groundnut (% of income) 13% 5% 4% 3% 2% 1% 2% 1% 100% 70% Income per acre Cost of seed & Cost of fertilizer Cost of Cost of land Cost of Cost of plant Cost of Tranportation Operating profit sowing miscellaneous preperation intercultural protection harvesting & cost activities operations threshing Cost and margin structure per acre: Black gram (% of income) 7% 5% 5% 4% 4% 4% 1% 4% 100% 66% Income per acre Cost of fertilizer Cost of plant Cost of land Cost of Cost of Cost of Cost of seed & Tranportation Operating profit protection preperation intercultural miscellaneous harvesting & sowing cost operations activities threshing Source(s): Agri Farming, Media reports, 1Lattice analysis © 1Lattice | IVCA 19 Sugarcane and French beans Operating profit for ground agriculture across the top selling cereals, pulses, oilseeds, sugars, and vegetables ranges between 60 - 70% [3/3] Cost and margin structure per acre: Sugarcane (% of income) 11% 7% 6% 6% 3% 1% 100% 65% Income per acre Cost of harvesting & Cost of seed & Cost of fertilizer Cost of intercultural Cost of land Cost of plant Operating profit threshing sowing operations preperation protection Cost and margin structure per acre: French beans (% of income) 16% 6% 4% 3% 3% 3% 2% 3% 1% 100% 60% Income per Cost of Cost of seed & Cost of land Cost of Cost of plant Staking cost* Cost of Cost of Tranportation Operating acre fertilizer sowing preperation miscellaneous protection harvesting & intercultural cost profit activities threshing operations Note(s): *process of setting up upright stakes to support crops Source(s): Agri Farming, Media reports, 1Lattice analysis © 1Lattice | IVCA 20 Agenda Current agri - market scenario Agri - market production Agri - market landscape by companies Agri - market input & output pricing by category Agri - market 5 - year production forecast Agri - market challenges Agri - market investment scenario Current agri - market opportunities Government and regulatory environment 5 - year production forecast Indian agriculture market is expected to reach ~INR 38 Lakh Cr at a CAGR of ~4% during FY25 - 30 Indian agriculture market is expected to grow Growth drivers for agriculture, forestry, and fishing at a CAGR of ~4% during FY25 - 30 Driver Rationale 5 - year forecast of output value of Indian agriculture market • Transformation of agricultural sector towards higher quality (INR Lakh Cr, FY25 - 30, FY12 prices) and niche products resulting in improved processing and increased demand for organic produce Changing CAGR consumer demand • Supported by changes in technology, consumer demand, ~4% 38.1 policy, transportation, and infrastructure development 36.5 35.0 33.6 • Production transition from specific grain crops (such as 32.2 30.9 wheat, rice, etc.) in rural areas to development in areas such as horticulture, floriculture, animal husbandry, etc. New farming methods • Introducing dryland farming in areas where irrigation & resources are scarce • Adoption of innovative technologies such as sensors and Technological other IoT devices to collect and analyze data advancement in • Use of aerial and drone - based technologies for crop agriculture health assessment, irrigation, etc. • Creation of architecture for database and applicable schemes through the Indian Digital Ecosystem of Agriculture (IDEA) framework Government initiatives • Support through other initiatives like providing financial assistance through funds, infrastructure development, and farmer supportive policies FY25E FY26P* FY27P* FY28P* FY29P* FY30P* • Availability of diverse physiographic, climatic, and soil Increase in conditions enabling growth of various horticulture crops horticulture production Note(s): *Projected Source(s): National Statistical Office, Industry interviews (N=15), 1Lattice analysis © 1Lattice | IVCA 22 Agenda Current agri - market scenario Agri - market production Agri - market landscape by companies Agri - market input & output pricing by category Agri - market 5 - year production forecast Agri - market challenges Agri - market investment scenario Current agri - market opportunities Government and regulatory environment Key challenges: Overview Fragmented land holdings, deteriorating soil health, lower processing of output, and productivity gap are some of the key challenges faced in Indian agriculture Key challenges faced by the Indian agricultural market Fragmented land Deteriorating soil Sowing Lower processing holdings health behavior of output Agricultural Receding water Climate Rising productivity gap table change labor prices Source(s): Industry interviews (N=15), Media reports, 1Lattice analysis © 1Lattice | IVCA 24 Fragmented land holding ~95% farmers are semi - medium, small, or marginal farmers and account for ~70% of farmland holdings in India Reasons for fragmented holdings Indian farmers primarily consist of marginal farmers (~70%), followed by small farmers (~20%) Reason Description Distribution of number of farmers in India • Short duration leasing, leading to lack of long - term (% of farmland farmers*) Land tenancy investments in infrastructure development • Land splitting among various offspring due to Inheritance laws generational inheritance, resulted in unviable agricultural 67% land due to low area 100% • Prohibition on non - farmers buying farmland , resulted low Decreased land price land prices, thus farmers fragment land while selling to prevent loss 18% • Insufficient documentation creates ambiguity and 10% Lack of 4% 1% confusion in land ownership resulting in land documentation Total number of farmers Small farmers** Medium farmers** fragmentation Issues caused by fragmented holdings ~50% farmlands in India are marginal farms (< 1 ha) or Issue Description semi - medium farms (2 - 4 ha) • Fragmented lands leading to economically non - viable land Low income holdings that fail to generate sufficient income Distribution of farmland in India • Diminished earnings resulting in inability to reinvest in Infrastructure (% of farmland area*) requirements to increase yield 24% • Resulting in reduced productivity leading to inability to Reduced reinvest in increasing land holding productivity 24% 100% • Practices like inter - cropping are challenging to implement in 23% small holdings, restricting range of cultivable crops Limitation on variety 20% • Farmland does not have sufficient time to recover between of crops 9% crop seasons to grow multiple types of crops Total farms Marginal Semi-medium Small farm** Medium Large farm** • Inability of securing credit due to banks not accepting farm** farm** farm** Lack of credit fragmented small land holdings as collateral Note(s): *As per the latest agricultural census (India: FY16), **Marginal farms: <1 ha, small farms: 1 2 ha, semi medium farms: 2 - 4 ha, medium farms: 4 10 ha, large farms: >10 ha Source(s): Ministry of Agriculture & Farmers Welfare, FAO, Businessworld, 1Lattice analysis © 1Lattice | IVCA 25 Fragmented land holding Farms with area <10 ha contribute less than ~2% of total farmland area in USA and Brazil, while farms with area >1,000 ha contribute ~50% Reasons behind existing landholding structure in USA ~55% of the farmlands in USA are estate farms (>1,000 ha), ~1% farmlands are smallholders (<10 ha) Reason Description Distribution of farmland in USA Historical • Laws like Homestead Act gave away large tracts of land to 1 (% of farmland area*) factors settlers through preemptions or purchases • Increased urban shift (between 1934 - 75) resulting in # farmers Urban shift shrinking by ~70%, causing consolidation of remaining farms 58% Technological • Innovations in agriculture allowing single farmer or farm family to advancements manage more acres or more animals 100% Shift in • Operators of large farms purchased land from retiring mid - size ownership farmers or rented from retired farmers and absentee investors 32% Economic • Land is viewed as a valuable investment, investors and 9% factors speculators acquired agricultural land over time 1% Total farms >1,000 ha 100-1,000 ha 10-100 ha <10 ha Reasons behind existing landholding structure in Brazil ~50% of the farmlands in Brazil are estate farms (>1,000 ha), Reason Description ~2% farmlands are smallholders (<10 ha) • Historical practice of latifundio , or large estates , concentrated in Distribution of farmland in Brazil Latifundios hands of a few (individuals, corporations or holding entities) (% of farmland area*) • Legal mechanisms like “ enfiteuse ” grant perpetual land rights to Enfiteuse owners, thus, preventing land redistribution 48% Colonial land • Land distribution was highly unequal in the colonial rule with Distribution indigenous population being dispossessed of their lands 100% 32% Economic • Speculation & rising importance of agriculture drive businesses factors and individuals to consolidate landholding for economic gains 18% Social and • Unequal land distribution perpetuates inequality as people with 2% economic large landholdings have more resources and opportunities Total farms >1,000 ha 100-1,000 ha 10-100 ha <10 ha inequality 1 Note(s): *As per the most recent agricultural census of respective country (US: CY22 & Brazil: CY17), right to purchase in future Source(s): USDA, IBGE, FAO, Springer, CRS reports, 1Lattice analysis © 1Lattice | IVCA 26 Agricultural productivity gap Factors like lack of farming knowledge, fragmented land, limited infrastructure, and low market & credit access have resulted in productivity gap in Indian agriculture India’s average crop yield (~9 tonnes / ha) is the lowest Reasons for productivity gap among Brazil, China, and USA Reason Description • Lack of up - to - date information and education regarding modern farming techniques like using hybrid seeds • Low awareness of best practices in crop management Inadequate Average yield of crops* • Low awareness about benefits of government knowledge ( tonne / ha, CY23) schemes and policies • Farmers unable to attain required economies of scale 17.4 Fragmented for mechanization and optimal productivity due to small land holdings land holdings • Insufficient cold storage, warehousing, and Lack of post - transportation facilities result in significant post - harvest 13.2 harvest losses 12.5 infrastructure • Small and marginal farmers often struggle to access credit at reasonable interest rates Access to 9.2 • High - interest loans lead to debt traps, limiting credit investments in productivity - enhancing measures • Difficulties for farmers to access markets and Market access receive fair prices for produce due to price and price fluctuations, middlemen, and lack of market linkage volatility • Lack of access to high quality cattle feed at affordable Poor quality of prices is an issue for small farmers, resulting in reduced cattle feed productivity • Lack of traceability of breed of livestock resulting in lack Lack of India Brazil China USA of information regarding genetic characteristics traceability of livestock Note(s): *basis average yield of all crops cultivated Source(s): FAO, Industry interviews (N=15), Media reports 1Lattice analysis © 1Lattice | IVCA 27 Agricultural productivity gap India’s crop yield is among the lowest across major crops among the top agricultural economies, except for sugarcane The yield for major crops in other major agricultural countries is 2 - 3 times more than the average yield in India Average yield of key crops (tonne / ha, CY23) Potatoes Sugarcane Rice Maize 11 9 51 83 80 79 78 7 7 7 34 6 26 4 20 4 China India Brazil USA Brazil China USA India India Brazil China USA India Brazil China USA Chickpeas* Wheat Groundnut Millet* 6 4 4 4 3 6 2 3 3 2 1 2 1 1 USA Brazil India China India Brazil China USA India USA China India USA China Note(s): *not cultivated in Brazil Source(s): FAO, 1Lattice analysis © 1Lattice | IVCA 28 Soil health Deterioration of soil health caused by excessive use of fertilizers, poor irrigation, and other similar reasons, causing a host of serious issues such as soil pollution Reasons for adverse soil health Issues caused by adverse soil health Reason Description Reason Description • Farmers compensate for low nutrient • Application of excessive fertilizers content in soil and lower yields by using Increase in soil Excessive use results in soil deterioration rendering chemical fertilizers which toxify the soil pollution of fertilizers land increasingly unsuitable for agricultural and ground water purposes • Shifting cultivation and deforestation • Utilization of sub - par water consisting of enables water to seep into sub - surface various dissolved salts for irrigation Cause of Poor irrigation making topsoil vulnerable resulting in purposes is resulting in saline or sodic soil landslides management landslide significantly hampering crop growth and diminishing overall productivity • Change in the amount of carbon stored in • Cropping intensity, lack of technical soil is influencing the carbon cycle knowledge or inputs is leading to resulting in carbon dioxide level Malnutrition of deficiency in elements like copper, modification Climate change manganese, zinc, iron, boron, soil • Reductions in soil carbon is contributing to molybdenum, and sulfur in the soil increased greenhouse gas levels , a resulting in malnutrition in plants major cause for global warming • Burning of crop residues in fields, • Contamination of ground water due to Extractive excessive tillage and flood - based polluted soil Ecosystem • This then spreads across the ecosystem agriculture irrigation results in extraction of nutrients damage and minerals from soil through plants, grazing animals, etc. • Deficiency in micronutrients present in • Burning forests for cultivation leads to soil leading to malnutrition in plants as soil Shifting Malnutrition of quality degradation of topsoil resulting in no longer provides necessary nutrients for cultivation plants soil erosion plant growth Source(s): FAO, Media reports 1Lattice analysis © 1Lattice | IVCA 29 Soil health Non - optimal level of macro - nutrients in Indian soil with variation in nutrient levels across states ~65% of soil has low nitrogen levels, ~15%, Soil across Indian states have poor nitrogen levels, with 3 phosphorous levels, & ~10%, potassium levels significant deficiency in key macro nutrient levels Soil nutrition levels in Uttar Pradesh Soil nutrition levels in Maharashtra Soil nutrition level ( % of samples tested under SHC, FY24) ( % of samples tested under SHC, FY24) 1 2 (% of samples tested under SHC , FY24) 2% 3% 1% 10% 15% 42% 4% 84% 69% 13% 78% 98% 83% 53% 29% 13% 21% 21% 5% 3% 60% Deficiency in Nitrogen Phosphorous Potassium Nitrogen Phosphorous Potassium macro nutrients 3 (NPK ) cause crop 74% yields to Soil nutrition levels in Madhya Pradesh Soil nutrition levels in Rajasthan suffer & ( % of samples tested under SHC, FY24) ( % of samples tested under SHC, FY24) necessitates higher 1% 67% artificial 9% 6% fertilizer use 33% 38% 32% 80% 100% 81% 91% 57% 13% 8% 61% 19% Nitrogen Phosphorous Potassium 10% 11% 3% 1% Nitrogen Phosphorous Potassium Nitrogen Phosphorous Potassium Low High 1 2 3 Note(s): FY24, Soil Health Card scheme, Nitrogen (N), Potassium (P), Phosphorous (K) Source(s): Ministry of Agriculture and Farmers Welfare, media reports 1Lattice analysis © 1Lattice | IVCA 30 Water table 60 - 70% of Indian ground water resources can be classified as safe, without a notable change between CY13 - 24 Number of groundwater units classified as critical and semi Reasons for potential recession of water table critical have not seen a significant change from CY13 to CY24 Reason Description • Excessive groundwater extraction may cause aquifers to Stage of ground water extraction in India drop faster than they can replenish , causing water table to (% of assessed blocks / mandals / talukas, CY13 - 24) drop – Increasing population, rapid industrialization, and need Over - for increased agricultural output put burden on existing exploitation groundwater resources 1% 1% 1% 2% – Ground water contributes nearly ~ 60% in irrigation , Between CY13 - ~ 85% in rural water supply, and ~ 50% in urban water 20, ~65% of supply freshwater from renewable • Climate change and global warming have made rainfall freshwater patterns unpredictable , making groundwater important for resources is irrigation Climate withdrawn 63% 64% change – Increased variability in precipitation can extend Y - o - Y, with 69% 73% agriculture periods of draughts , thus, increasing dependability on utilizing ~35% of groundwater resources due to its buffer capacity all renewable water resources • Subsidized electricity reduces cost of pumping Y - o - Y groundwater resources , incentivizing its excessive Electricity extraction as users face low cost and incentives subsidies 14% 15% • As population grows , demand for water increases and 10% lack of adequate water supply infrastructure put burden 5% 11% Increasing 4% 4% on existing groundwater resources population 3% 17% 16% 16% 11% • Urban development majorly uses impermeable construction materials, which increases surface water run CY13 CY17 CY20 CY24 off and lowers the amount of water going back to the soil Urbanization • Lack of adequate rainwater management systems hinder Over-exploited Critical Semi-critical Safe Saline replenishment of water table Source(s): FAO, National Compilation on Dynamic Ground Water Resources, World bank, University of Michigan, 1Lattice analysis © 1Lattice | IVCA 31 Water table Punjab (~75%) and Rajasthan (~70%) have the most over - exploited groundwater resources amongst key ground agriculture producing states Punjab and Rajasthan’s ground water resources are critically over - exploited Stages of ground water extraction in key Indian ground agriculture states (% of assessed blocks / mandals / talukas, CY24) 1% 5% 14% 12% 17% 7% 8% 3% 9% 61% 68% 71% 73% 84% 69% 75% 71% 14% 6% 20% 19% 9% 4% 12% 5% 19% 2% 11% 2% 8% 9% 7% 3% 2% Punjab Rajasthan Karnataka Madhya Pradesh Gujrat Uttar Pradesh Maharashtra West Bengal Over-exploited Critical Semi-critical Safe Saline Source(s): National compilation on dynamic ground water resources, 1Lattice analysis © 1Lattice | IVCA 32 Sowing behaviour Demand for crops, farming knowledge, and government policies influence the sowing behaviour causing soil degradation, pollution, and reduced crop diversity Reasons for sowing behavior Issues caused by sowing behavior Issue Description Reason Description • Excessive cultivation of in - demand crops such as • Often influenced by market trends of previous years and Sentiment rice, especially in water - intensive and flood - prone crops sown by big farmers to identify choice of crop driven regions , may lead to waterlogging and soil Soil degradation degradation • Farmers in India follow traditional sowing behaviors and • Excessive cultivation of in - demand saline sensitive Unscientific tend to utilize same seeds repeatedly (same quality or crops in saline prone areas can lead to accumulation practices previous season’s produce) of salts in the soil over time • Focusing on crops aligning with farmer’s perceived • Utilization of traditional climate knowledge to anticipate Traditional Reduced crop weather patterns, reduces overall agricultural delayed or erratic weather patterns, resulting in higher diversity beliefs / resilience and limits income diversification margin of error superstitions • Farmers unsuccessful in mimicing larger farmers due • Lack of awareness and access to technology results in Inability to to lack of resources, smaller cultivation area, use of Lack of access farmers inability to take advantage of benefits like replicate large unsuitable methods, equipment, etc. to technology weather forecasting, soil nutrition readings, etc. farmers • Unplanned sowing schedules, leads to inefficient use • Sowing behavior is dictated by crops for which MSP of resources like water, fertilizer, and pesticides yields highest returns – For example, sowing during periods of water Influence of • In addition, it is also dictated by policies regulating the Poor government scarcity can result in excessive irrigation demand, use of resources such as water management wasting valuable water resources schemes & – For instance, Punjab government passed a Punjab of resources policies • Inefficient selection of seeds (traditional viz - a - viz hybrid Preservation of Subsoil Water Act 2009 which seeds) lead to poor yield due to effects of climate prohibits paddy transplantation before 15th June change • Sowing behavior is influenced by expected monsoon • Erratic monsoons can lead to crop failure, and hence Monsoon Inflation of conditions, particularly prevalent in regions with limited delayed sowing & harvesting , causing supply dependence food prices irrigation shortages and price hikes in the food market • Small to medium farmers attempt to mimic approaches • Delayed sowing often leads to crop residue burning, Improper of medium to larger farmers worsening air pollution and intensifies smog & health replication of Pollution • Often adopt unsuitable methods of agriculture or use risks practices unsuitable equipment Source(s): Industry interviews (N=15) , Media reports, 1Lattice analysis © 1Lattice | IVCA 33 Climate change Yield of major crops in India are projected to decrease by 11 - 26% by 2100 due to extreme weather conditions, unpredicted rainfall, and land atmosphere interactions Yield of major crops in India are projected to decrease by 11 - 26% by 2100 Effects of climate change resulting in reduction of crops Reason Description Projected decrease in yield of major crops* • Decreased rainfall and rising temperatures in India since 2002 (% decrease in crop yield) have created challenges for agriculture Extreme • Droughts: Heatwaves and extreme heat events significantly Groundnut Rice temperature harm crops, leading to potential losses during droughts – Climate change has intensified droughts, causing water conditions 2035 2065 2100 2035 2065 2100 stress, reducing soil moisture, and increasing the risk of crop failures • Climate change affects weed growth and herbicide effectiveness - 7.1 - 5.6 Impact on • Elevated C O levels and higher temperatures promote weed 2 - 11.5 - 8.6 herbicide proliferation & reduce the efficacy of herbicides , necessitating effectiveness higher doses for effective control - 15.4 - 11.8 Refers to the interaction and exchange of energy, moisture, and momentum between the earth's surface and the overlying atmosphere • Land - atmosphere coupling , influenced by global warming, has amplified temperatures and aridity Wheat Chickpea Land atmosphere – Closely tied to monsoon failures, which can reduce soil interactions moisture and increase atmospheric heating 2035 2065 2100 2035 2065 2100 – Causing adverse effects on crop growth, exacerbating drought conditions and posing challenges to agriculture • Floods: Unexpected heavy rainfall and resulting floods damage standing crops, displace farmers , and lead to substantial crop - 8.3 - 10.0 losses • Changes in rainfall patterns, even in non - drought - prone areas Erratic rainfall - 15.4 - 18.6 lead to crop water stress • Consistent and adequate water supply crucial for optimal crop - 26.2 - 22.0 growth; Irregular or insufficient rainfall strains plants, affecting development, flowering, and yields Note(s): *Maximum changes in temperature and rainfall are 1.3 ° C & 7% by 2035, 2.5 ° C & 26% by 2065 & 3.5 ° C & 27% respectively by 2100 Source(s): Pulitzer Centre; Indian Council of Agricultural Research; Media reports, Industry interviews (N=15), 1Lattice analysis © 1Lattice | IVCA 34