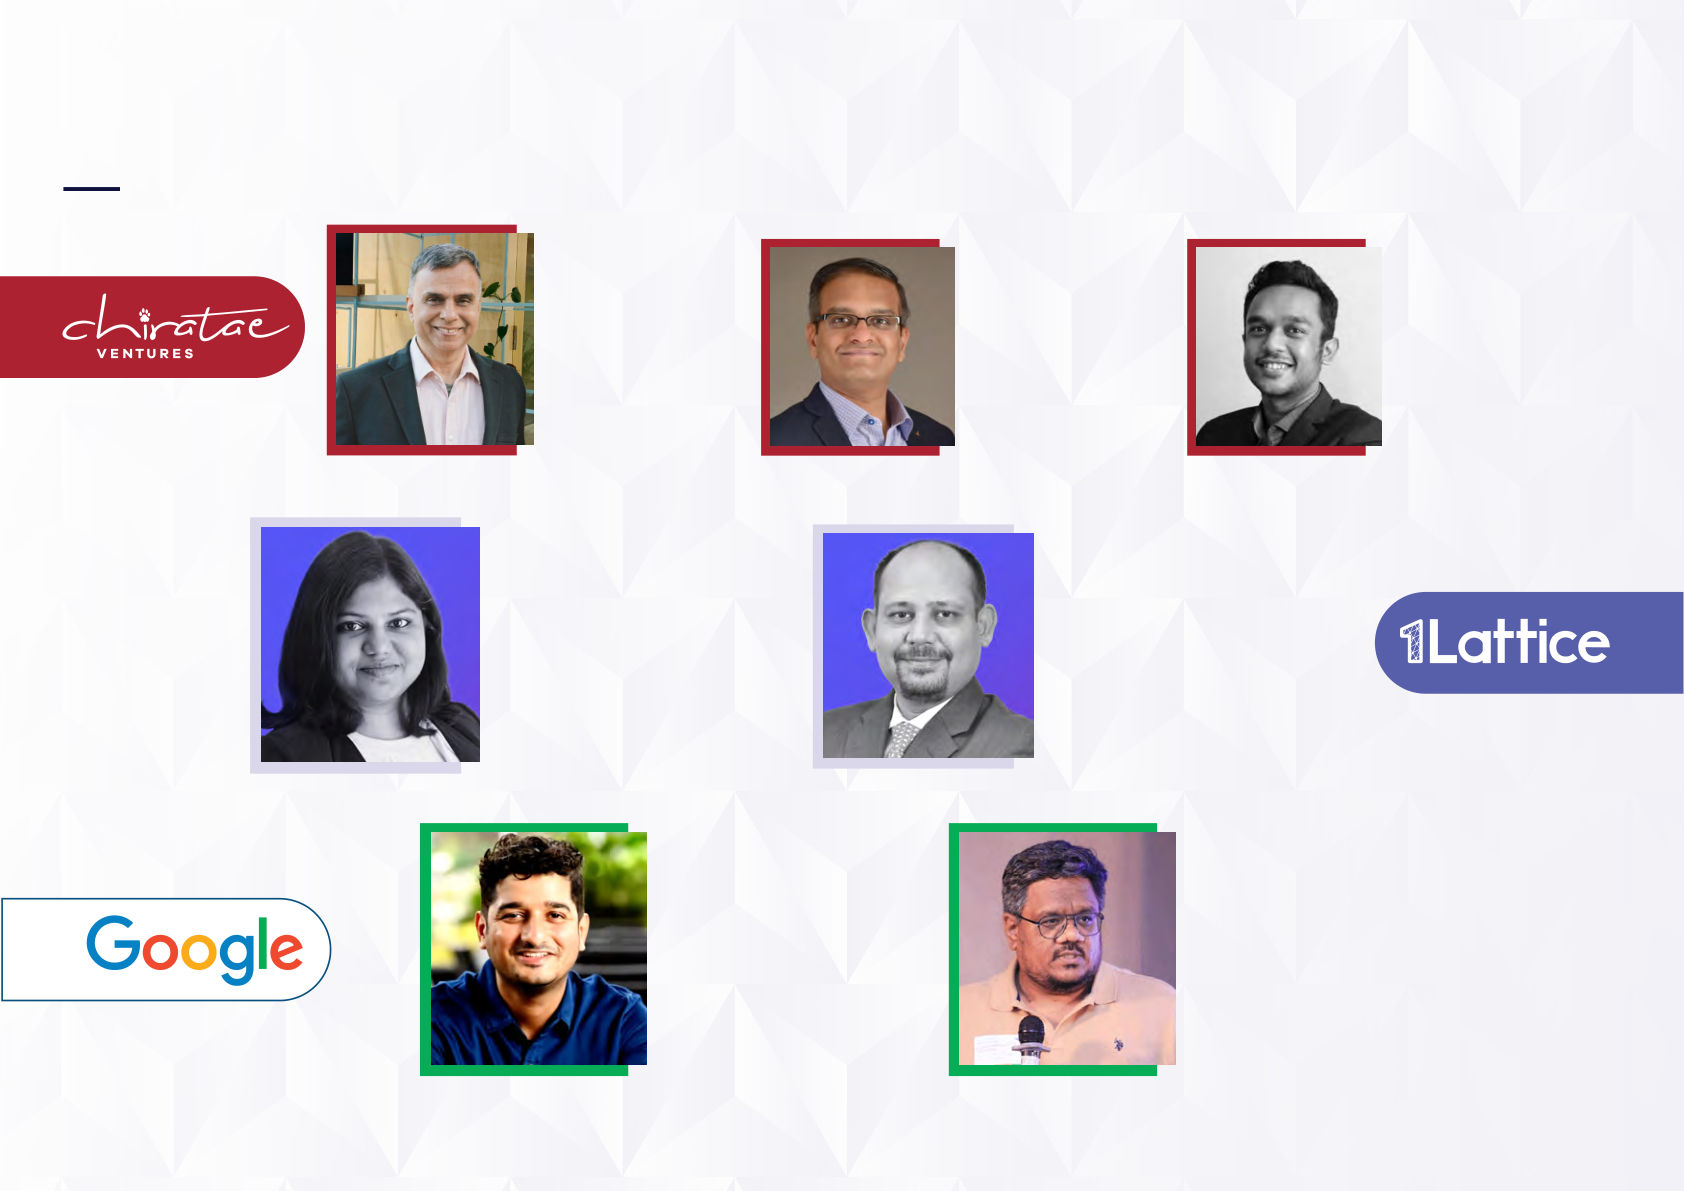
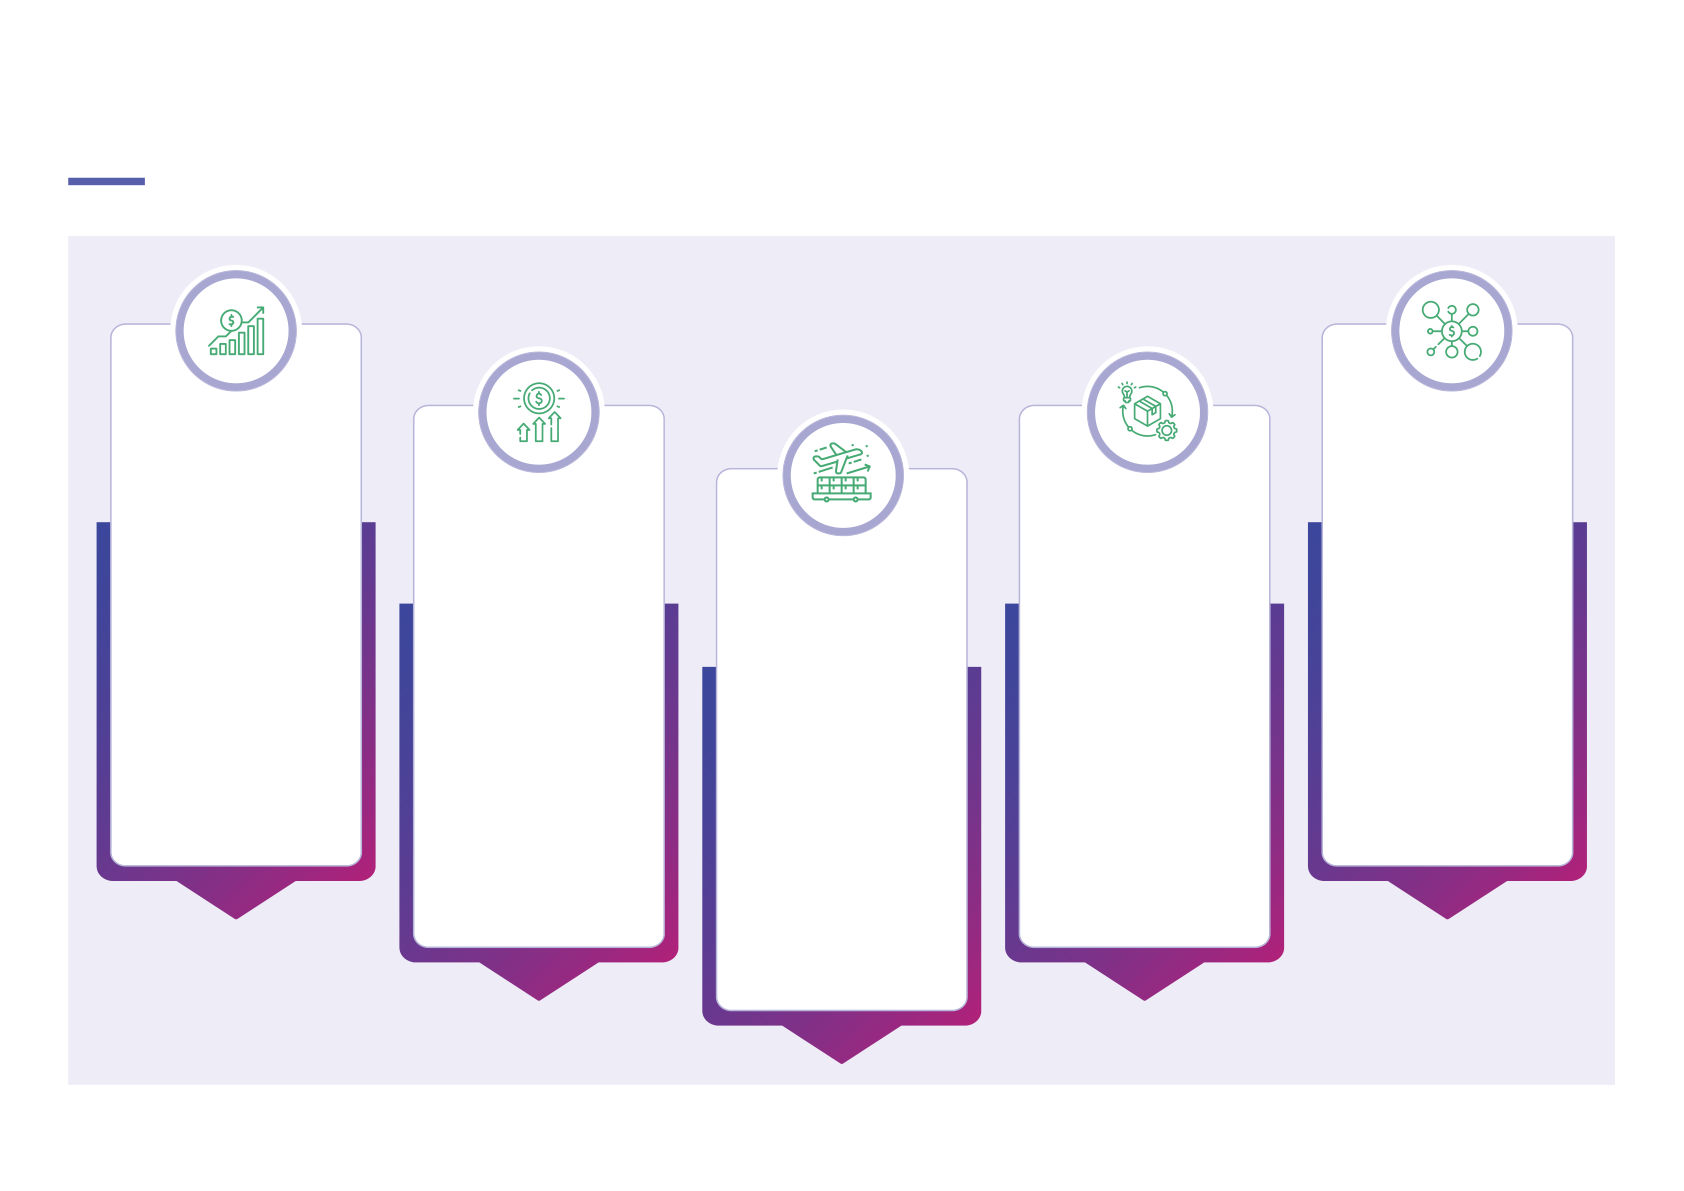
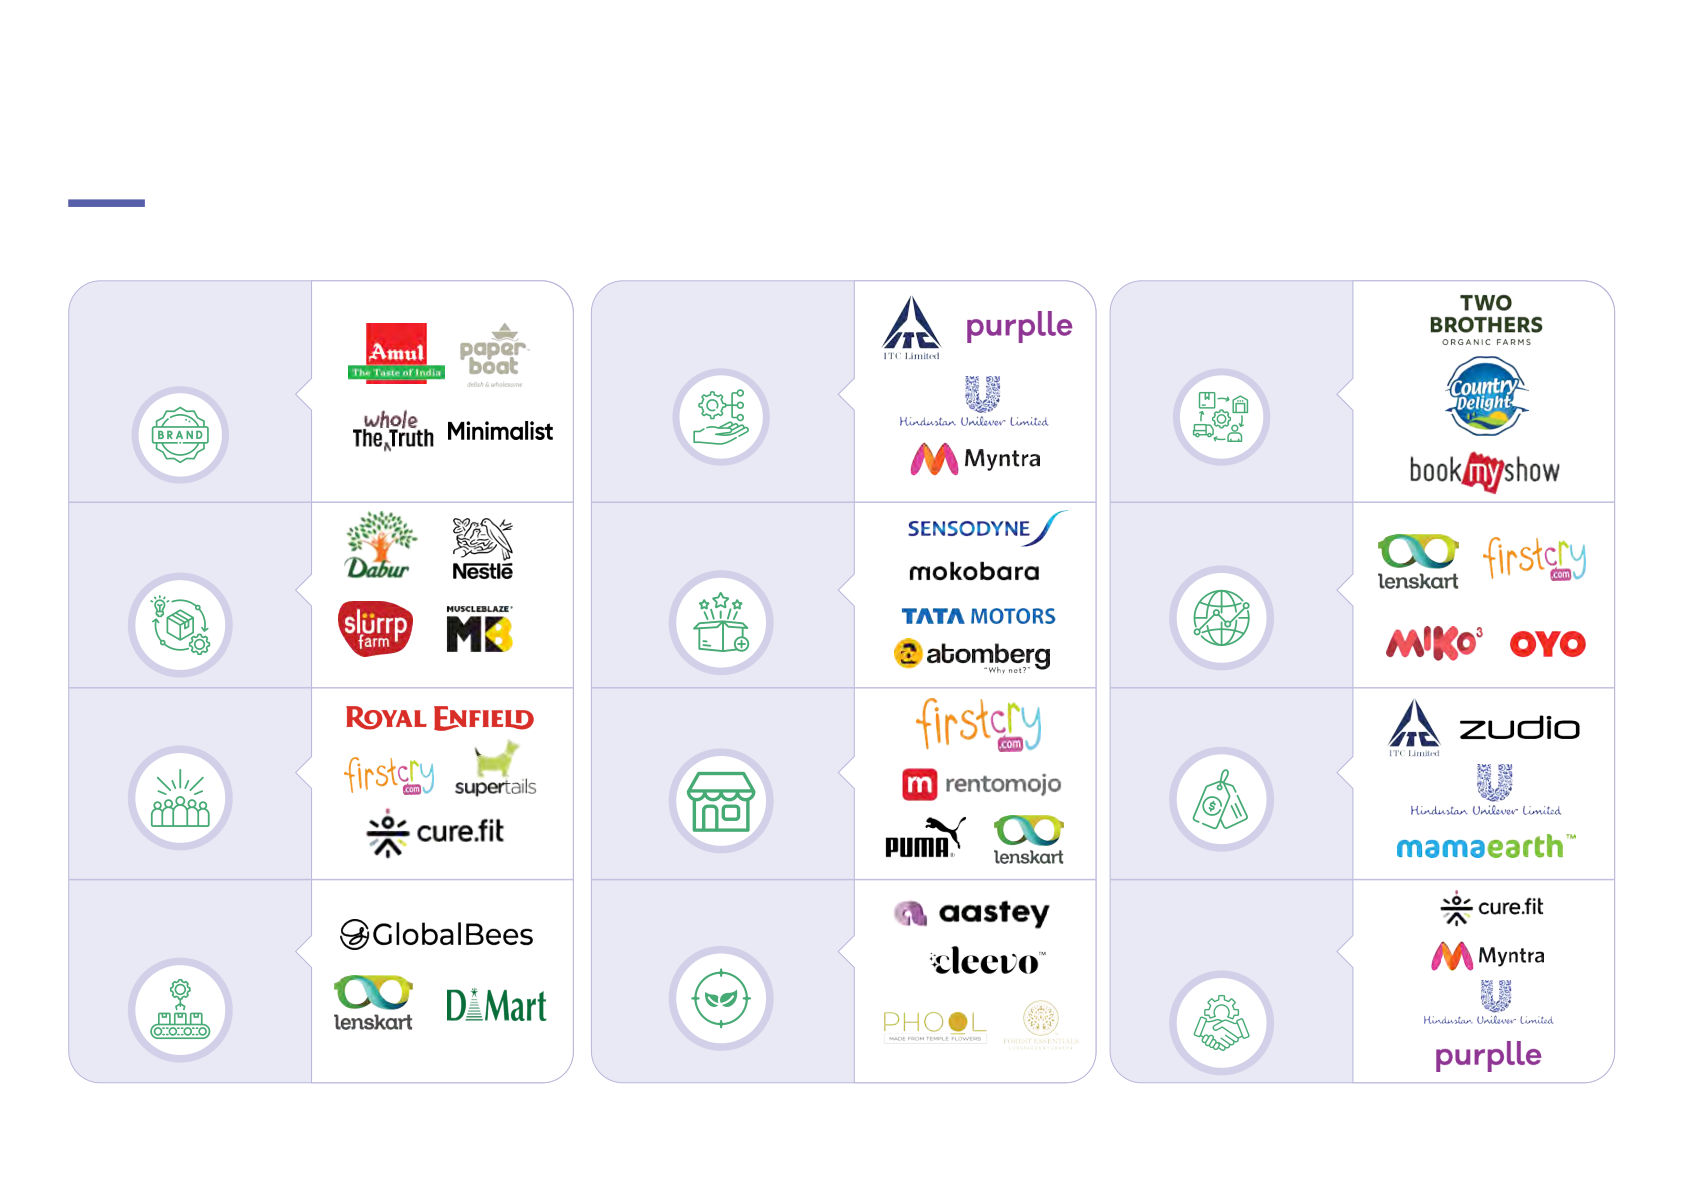
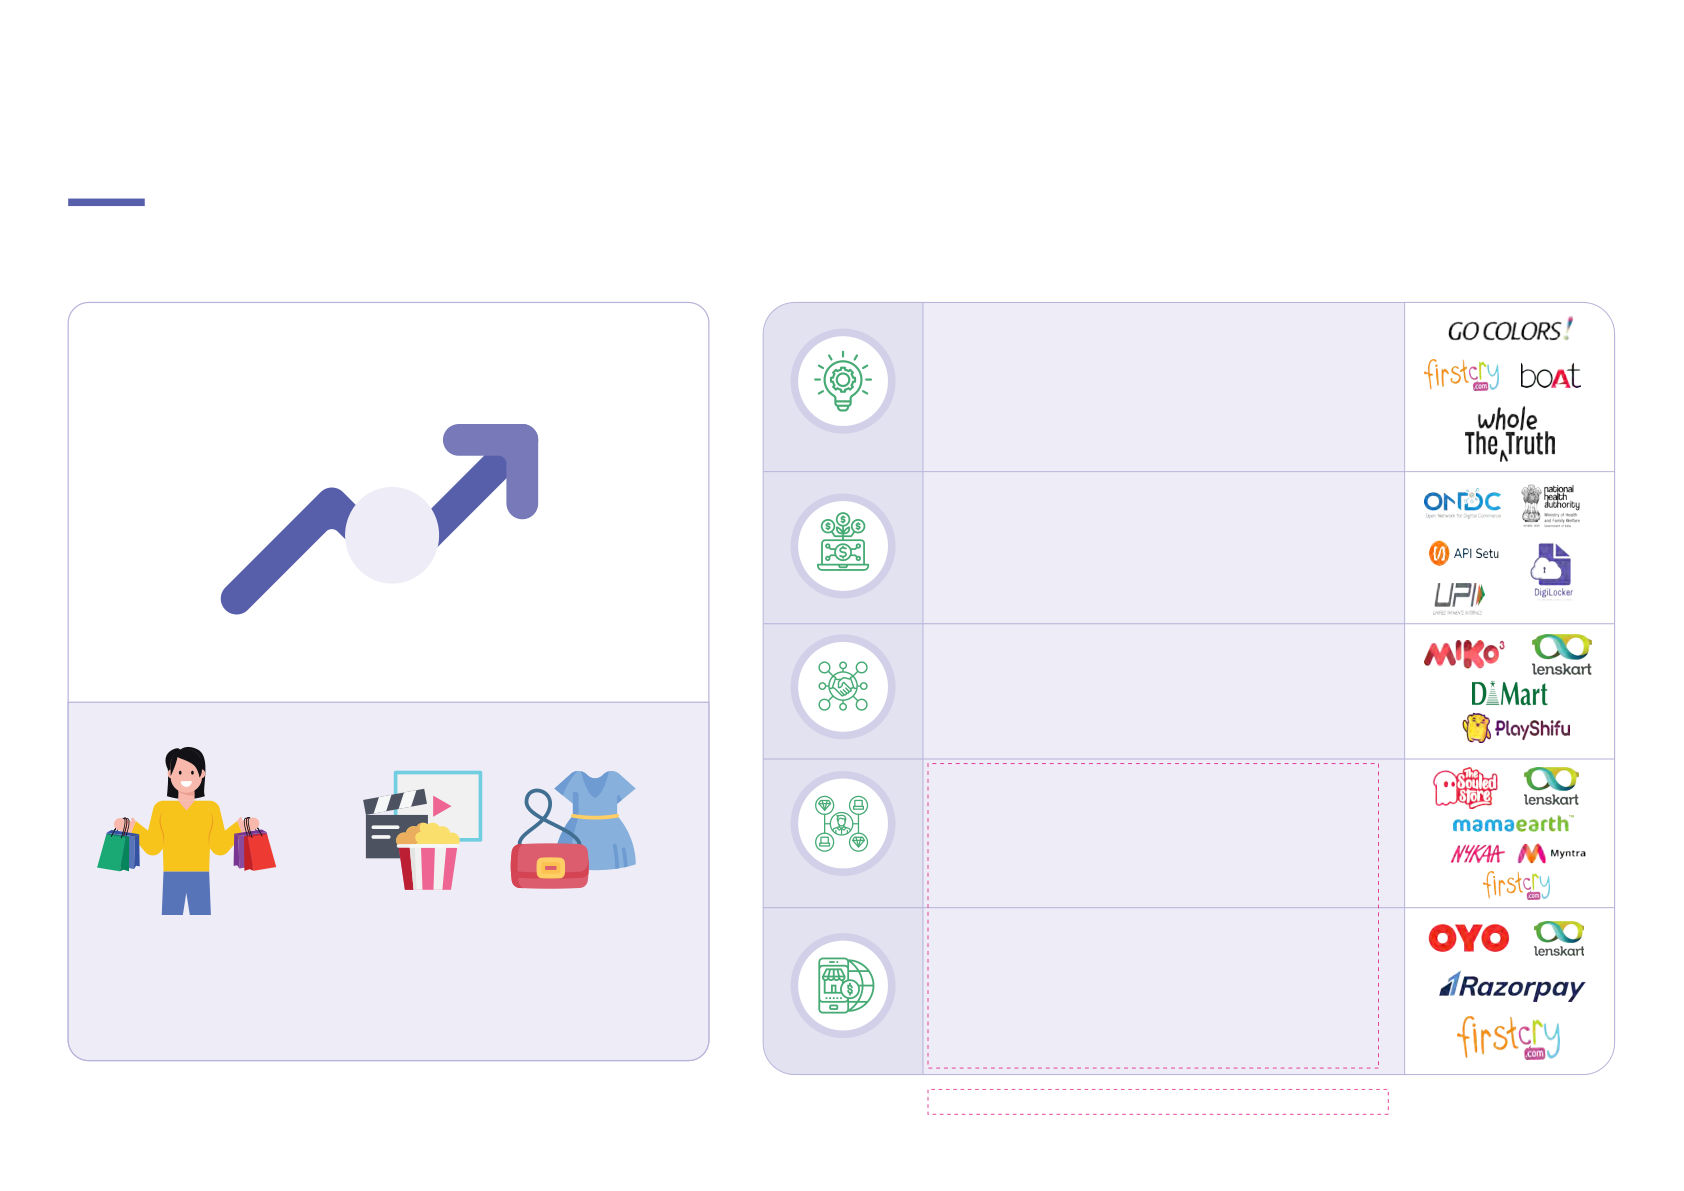
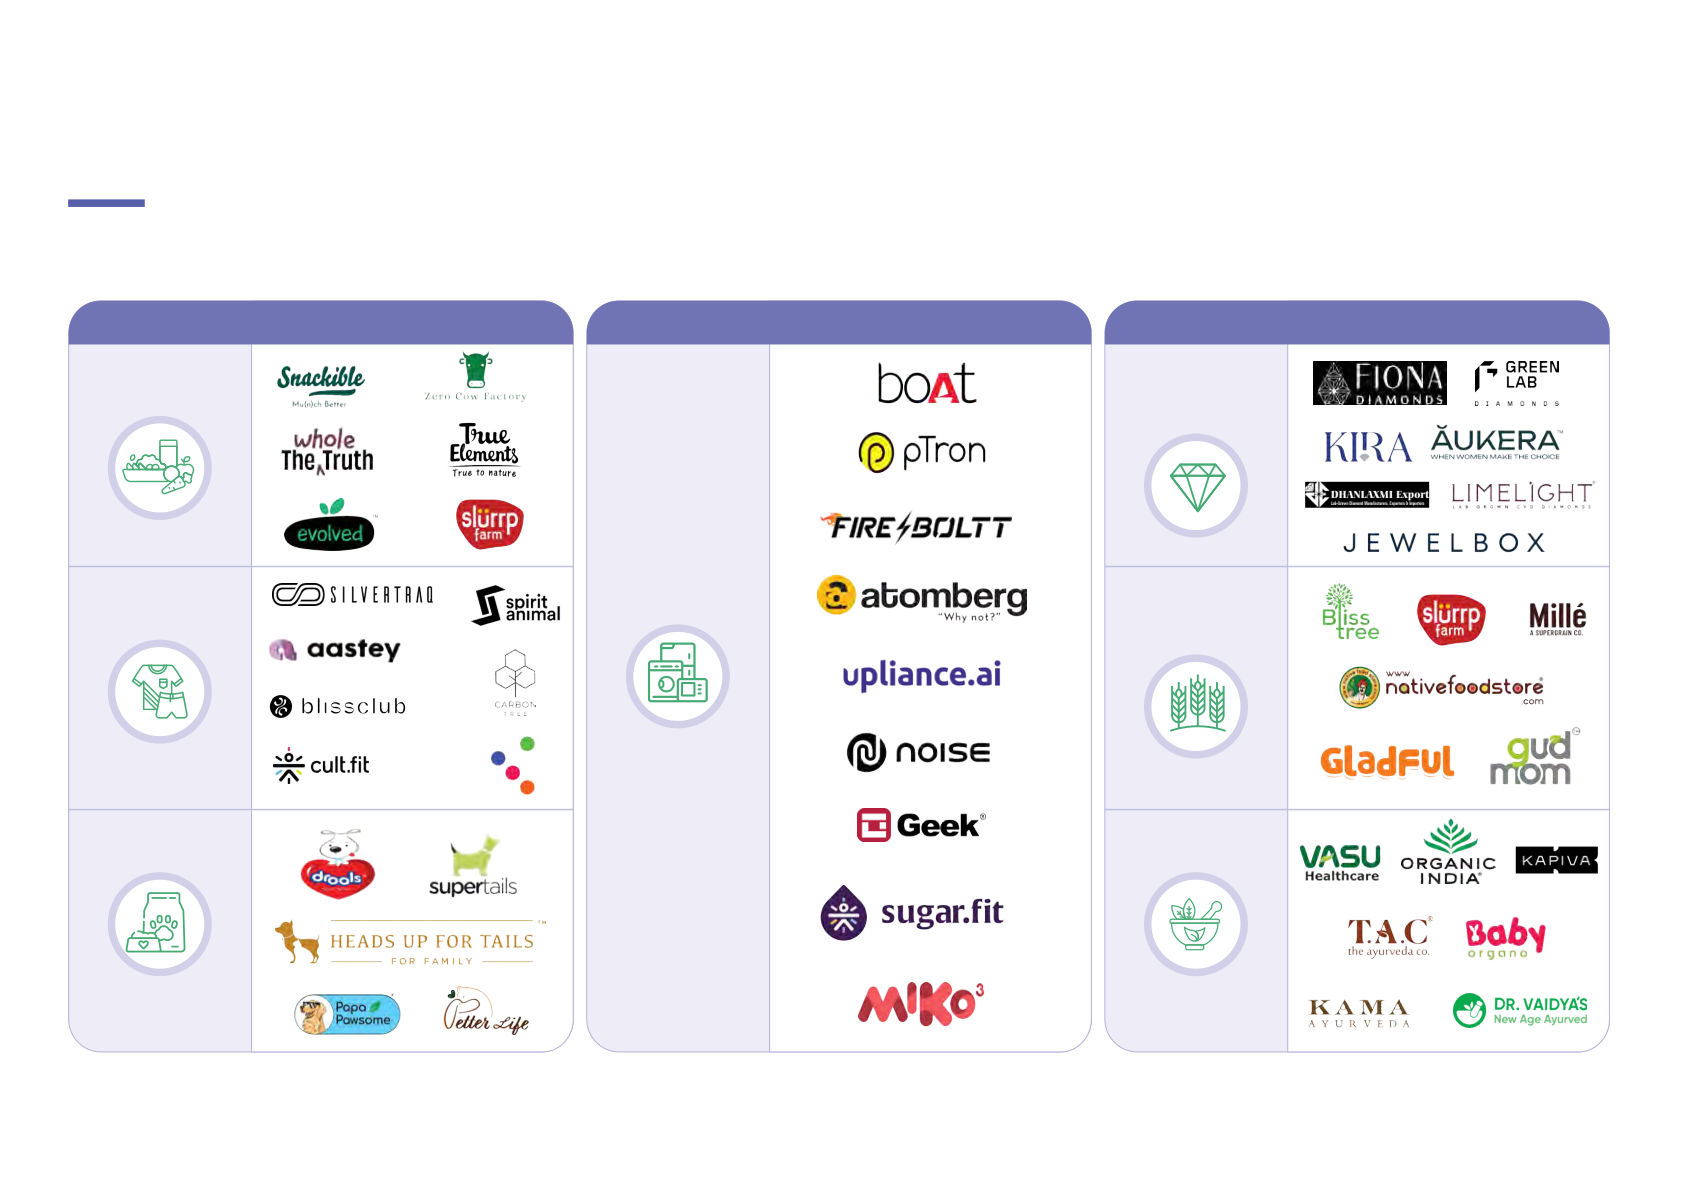
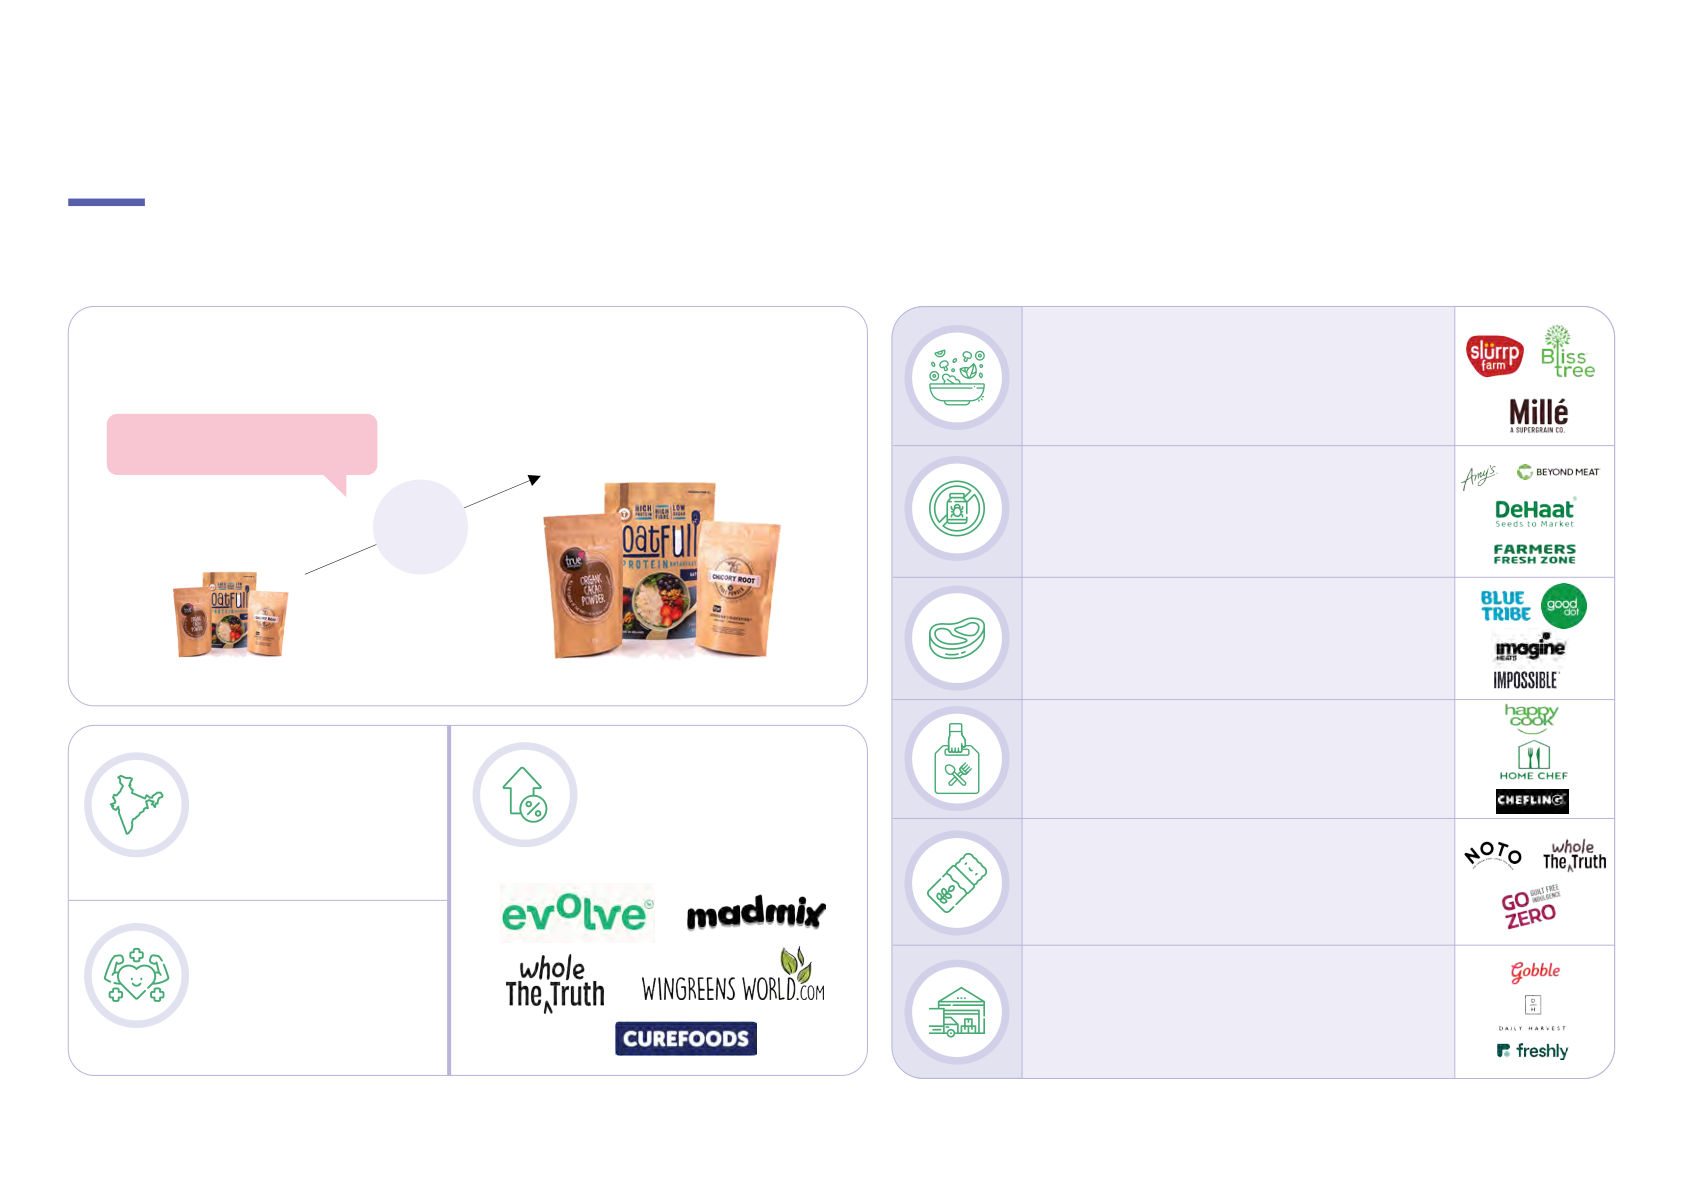
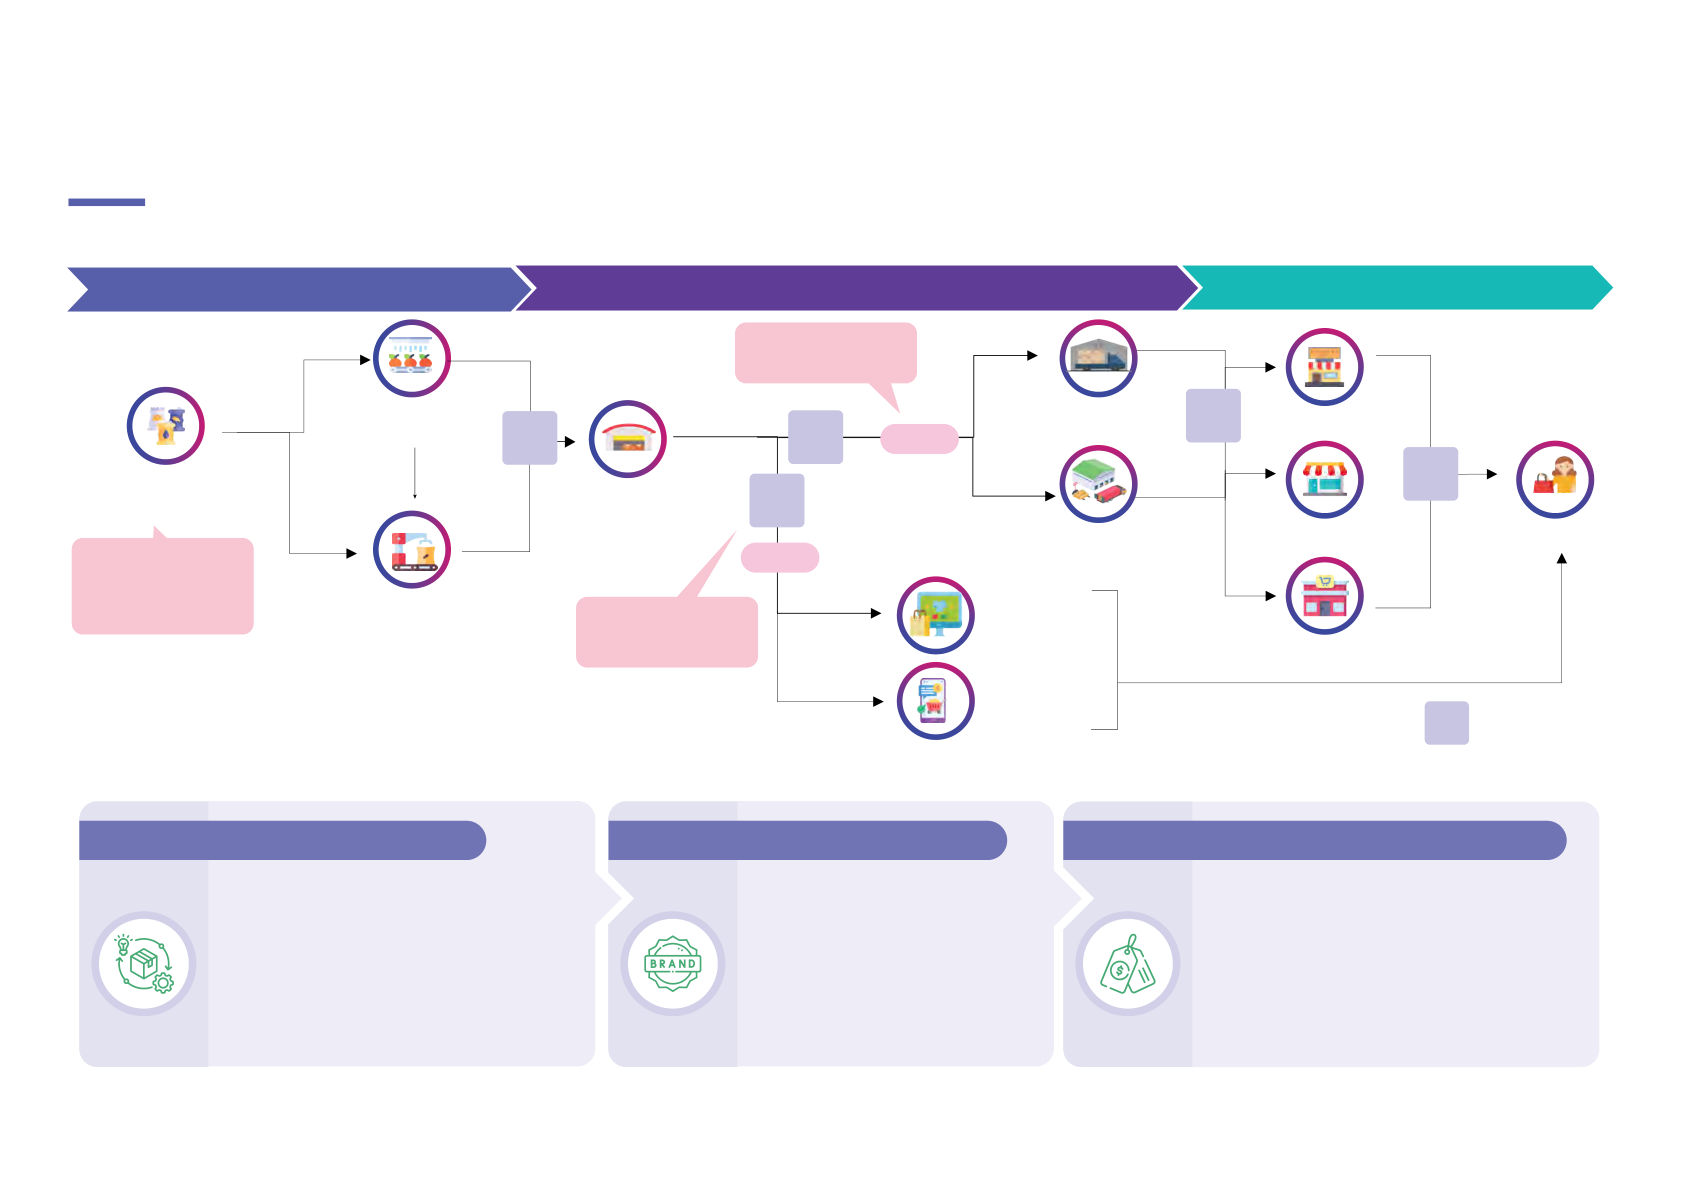
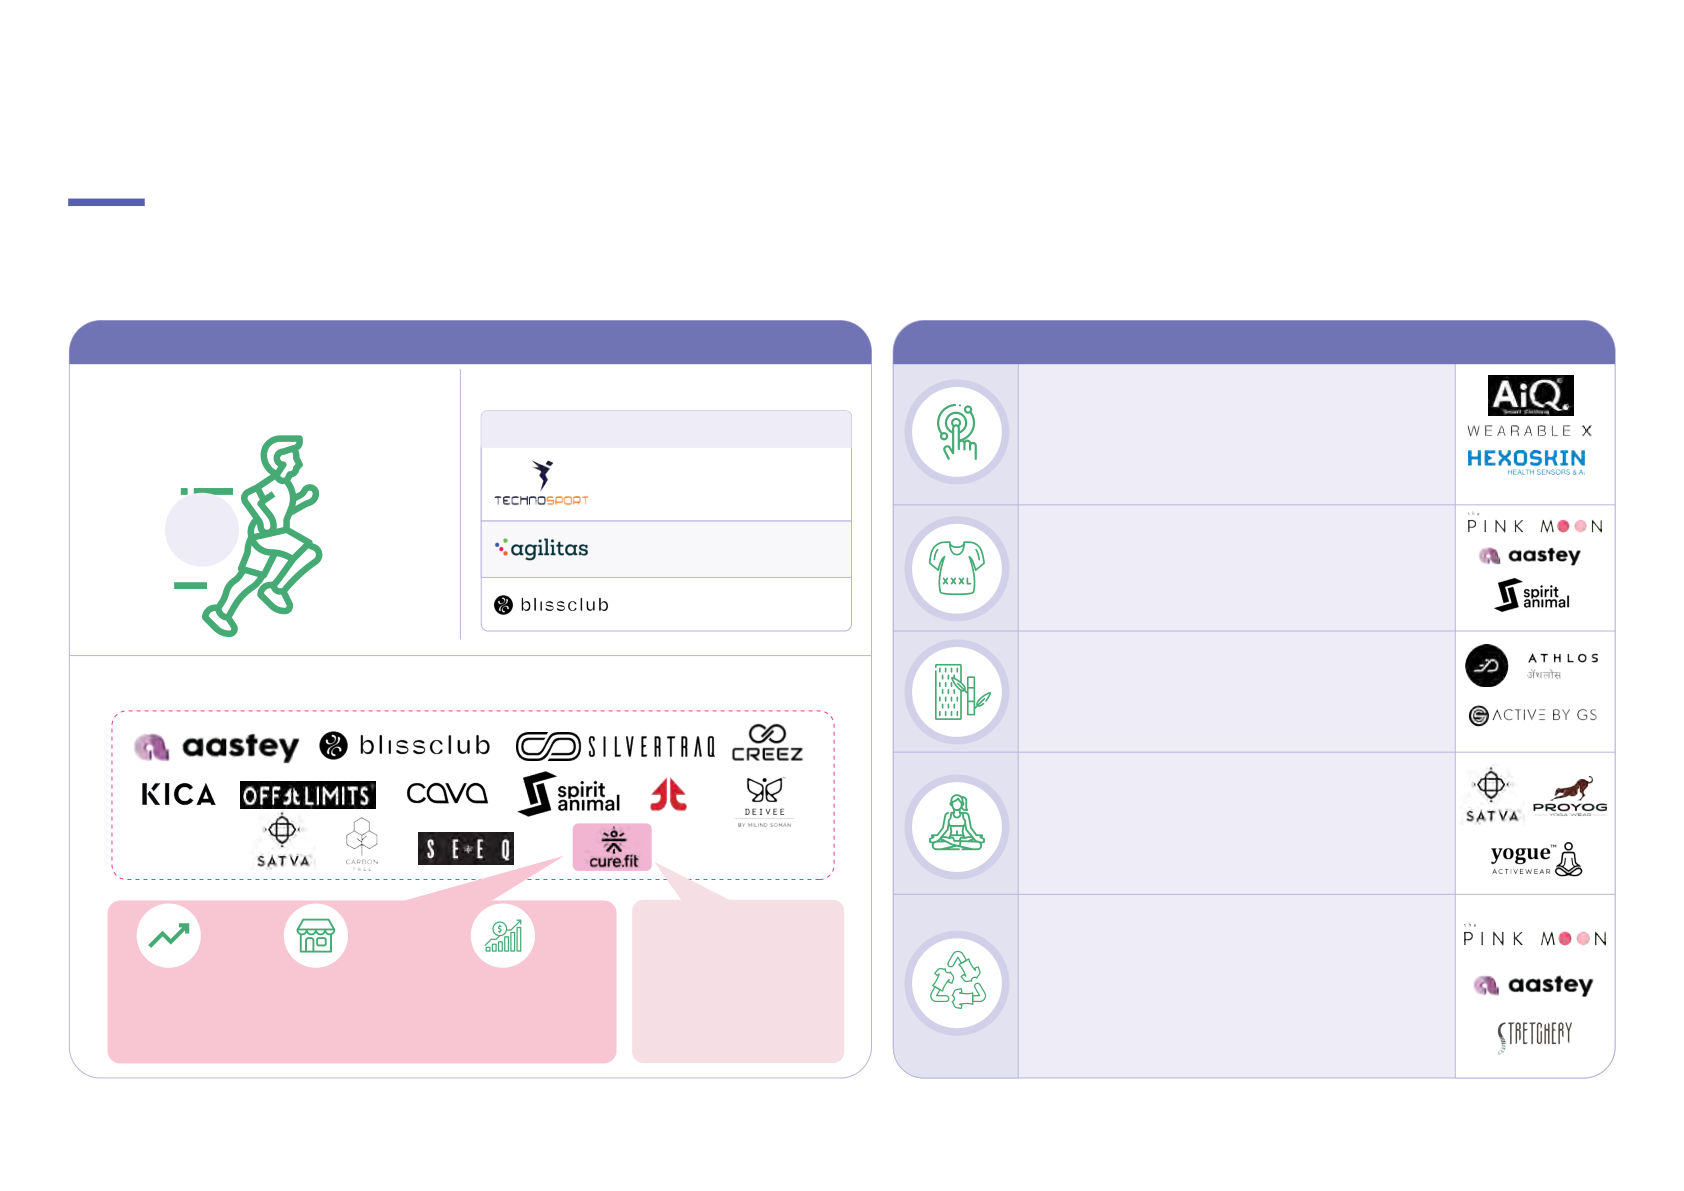
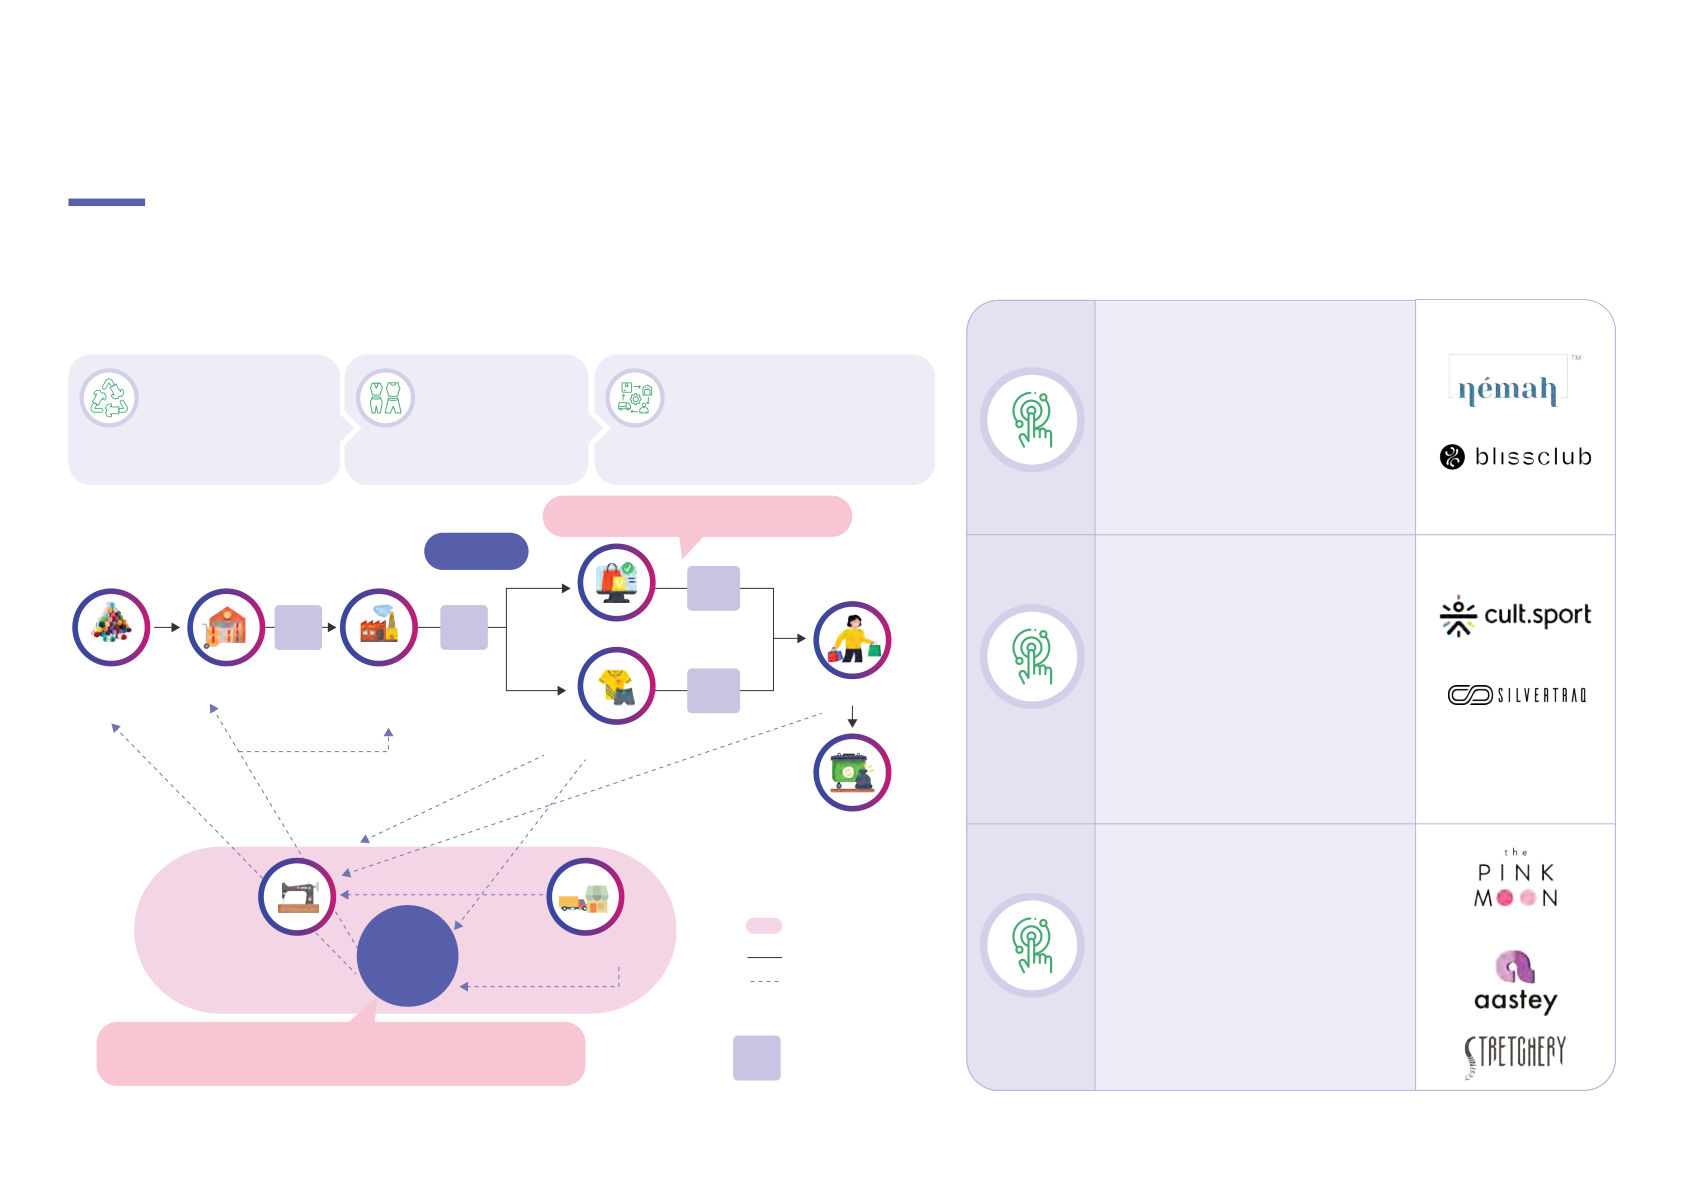
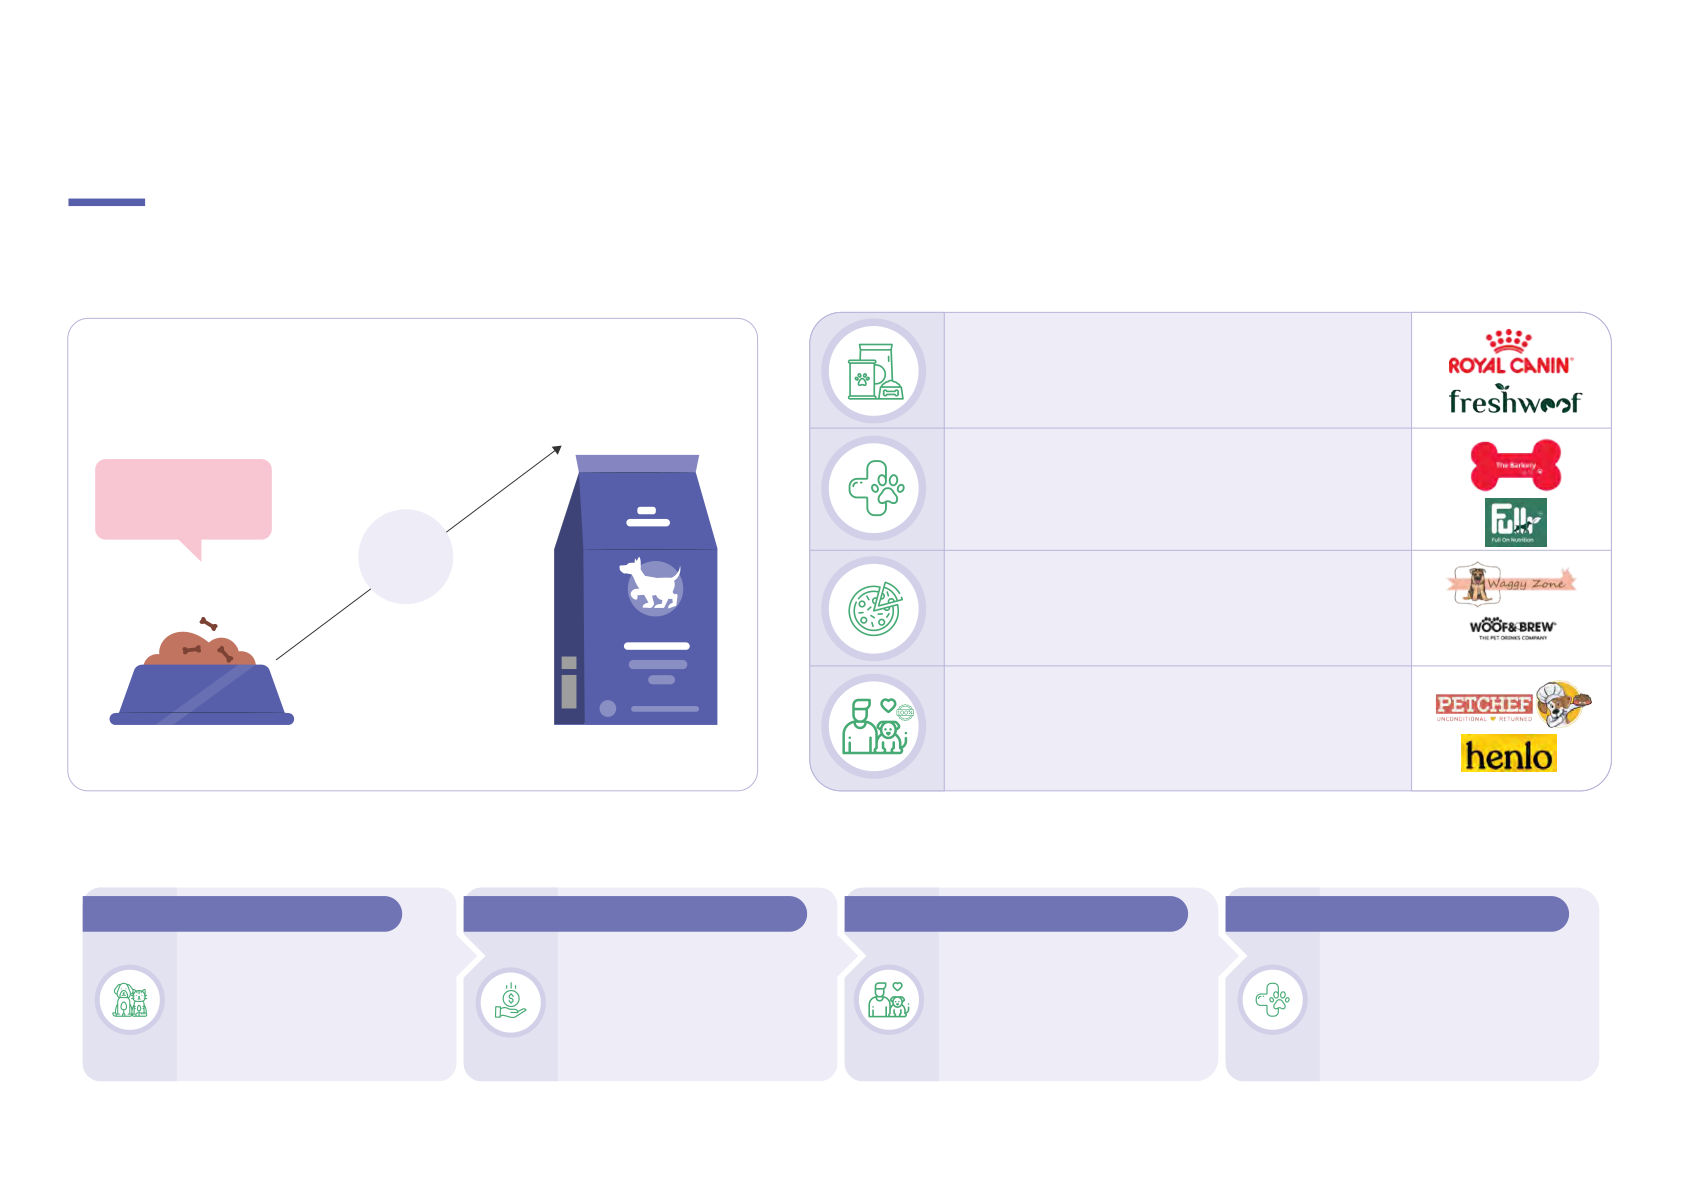
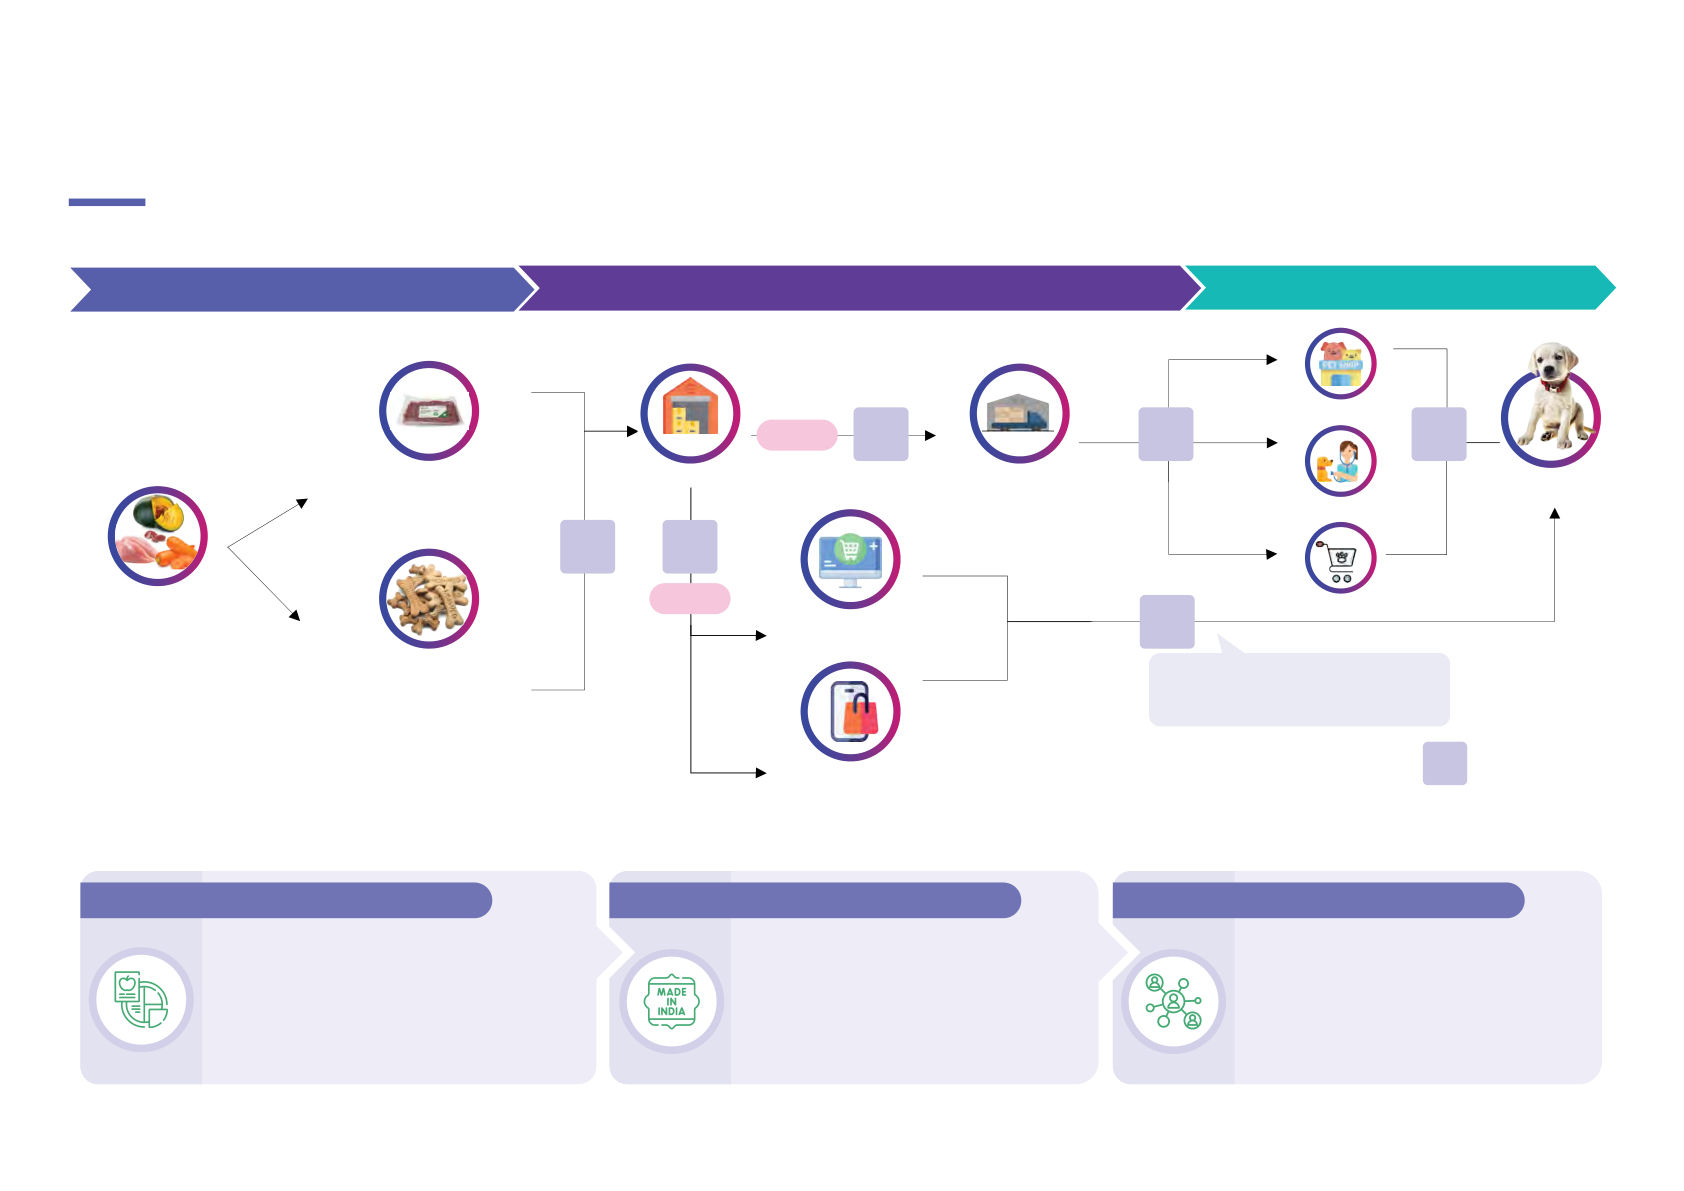
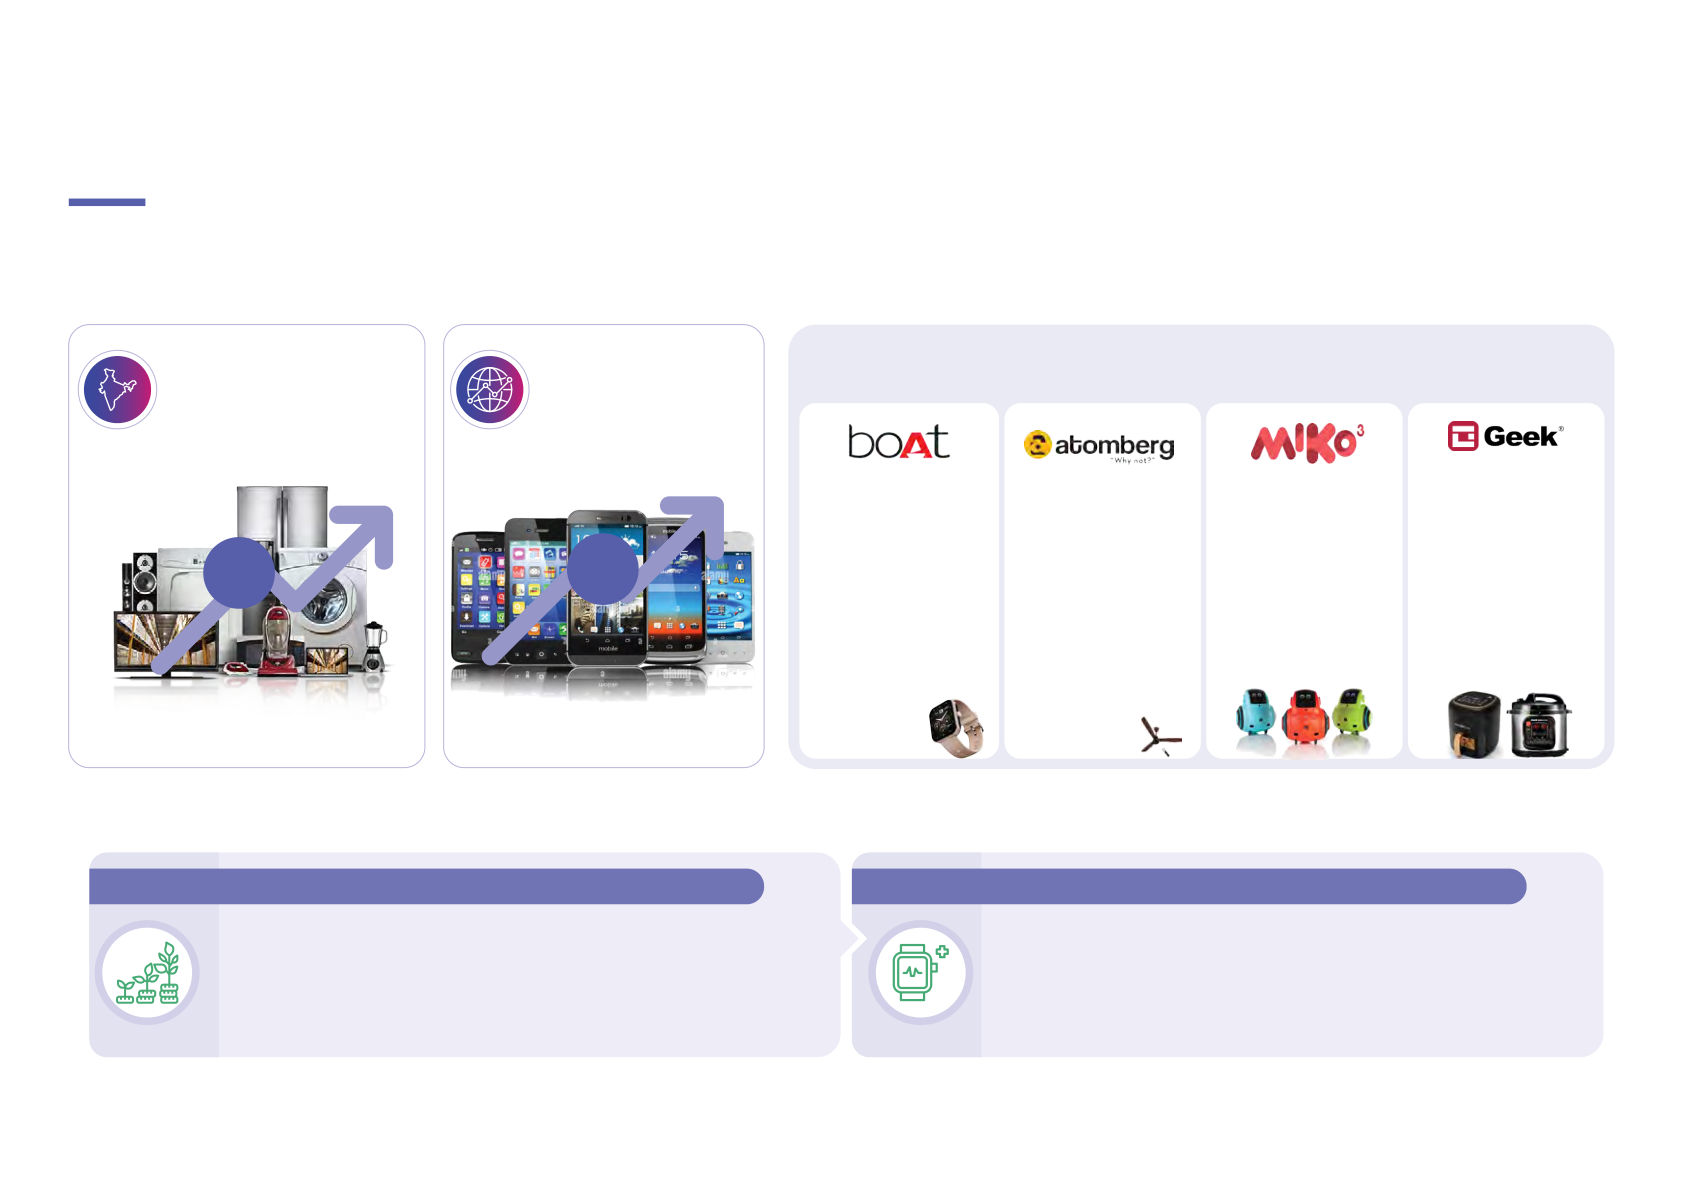
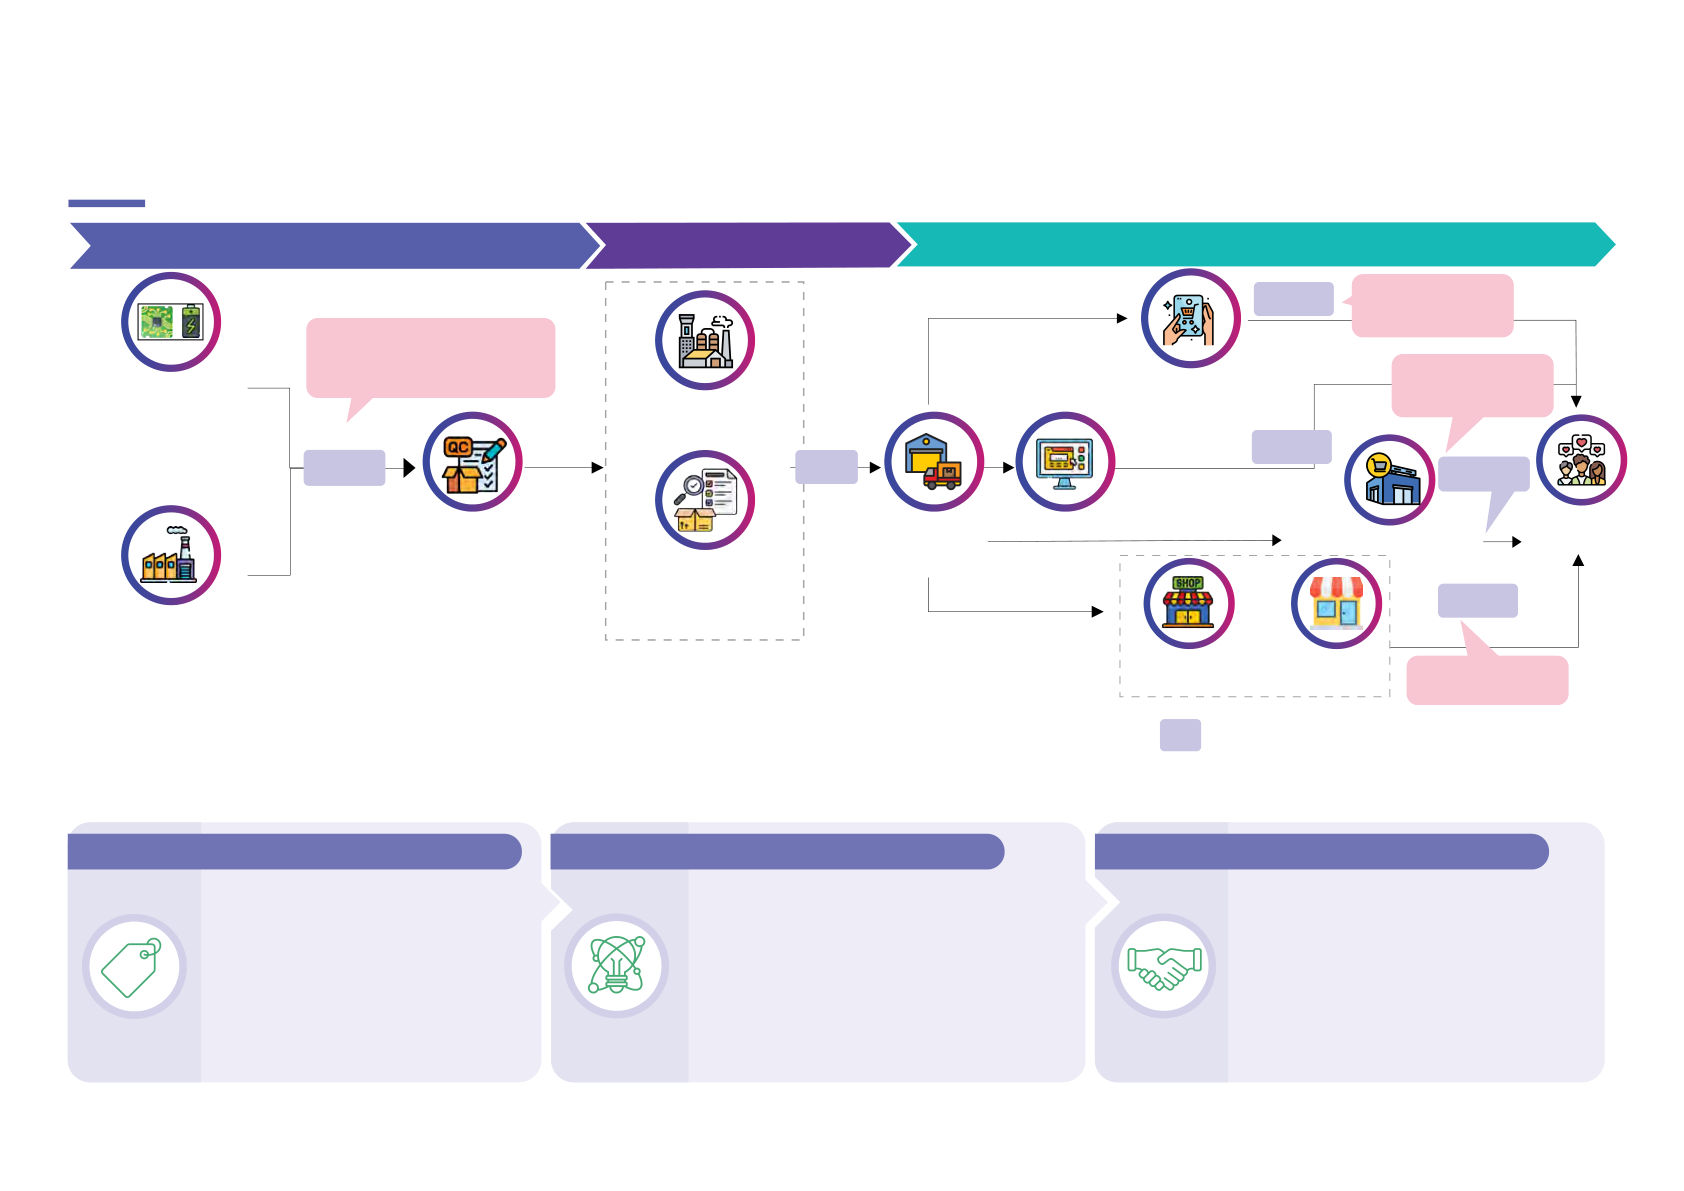
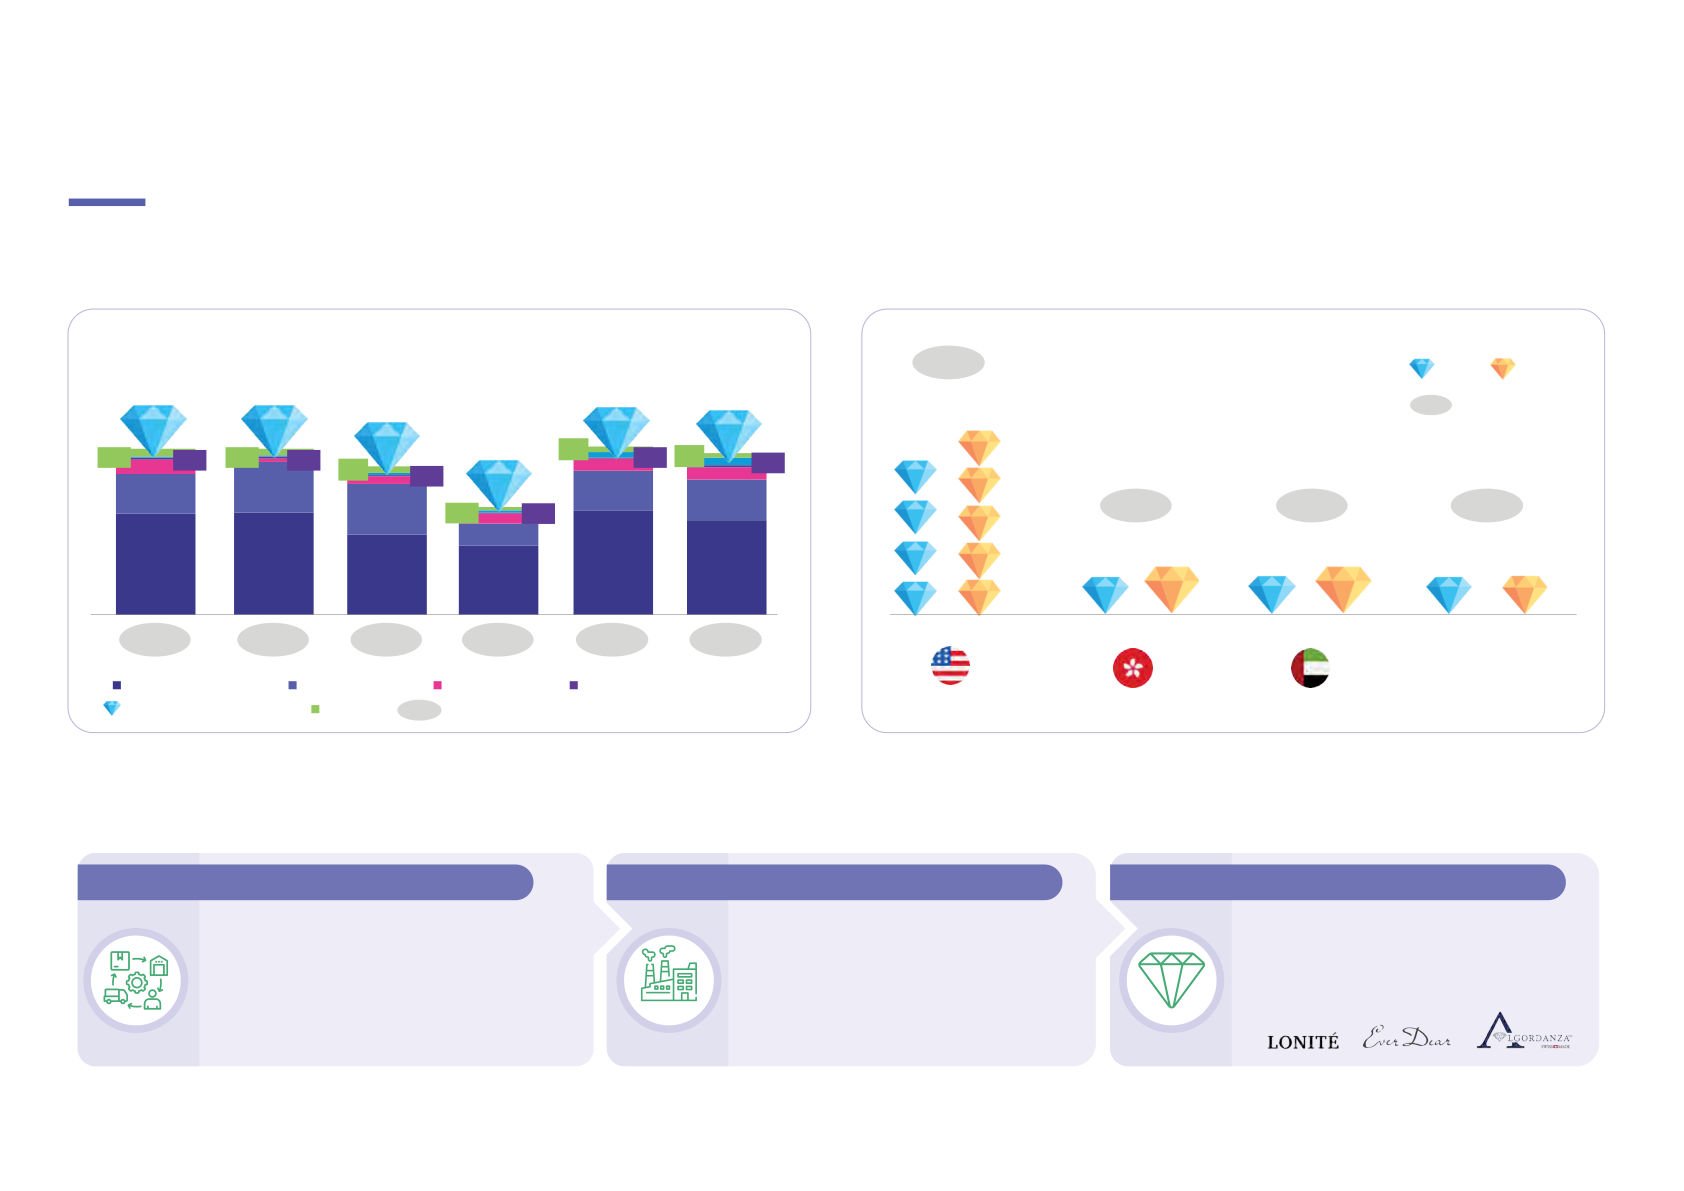
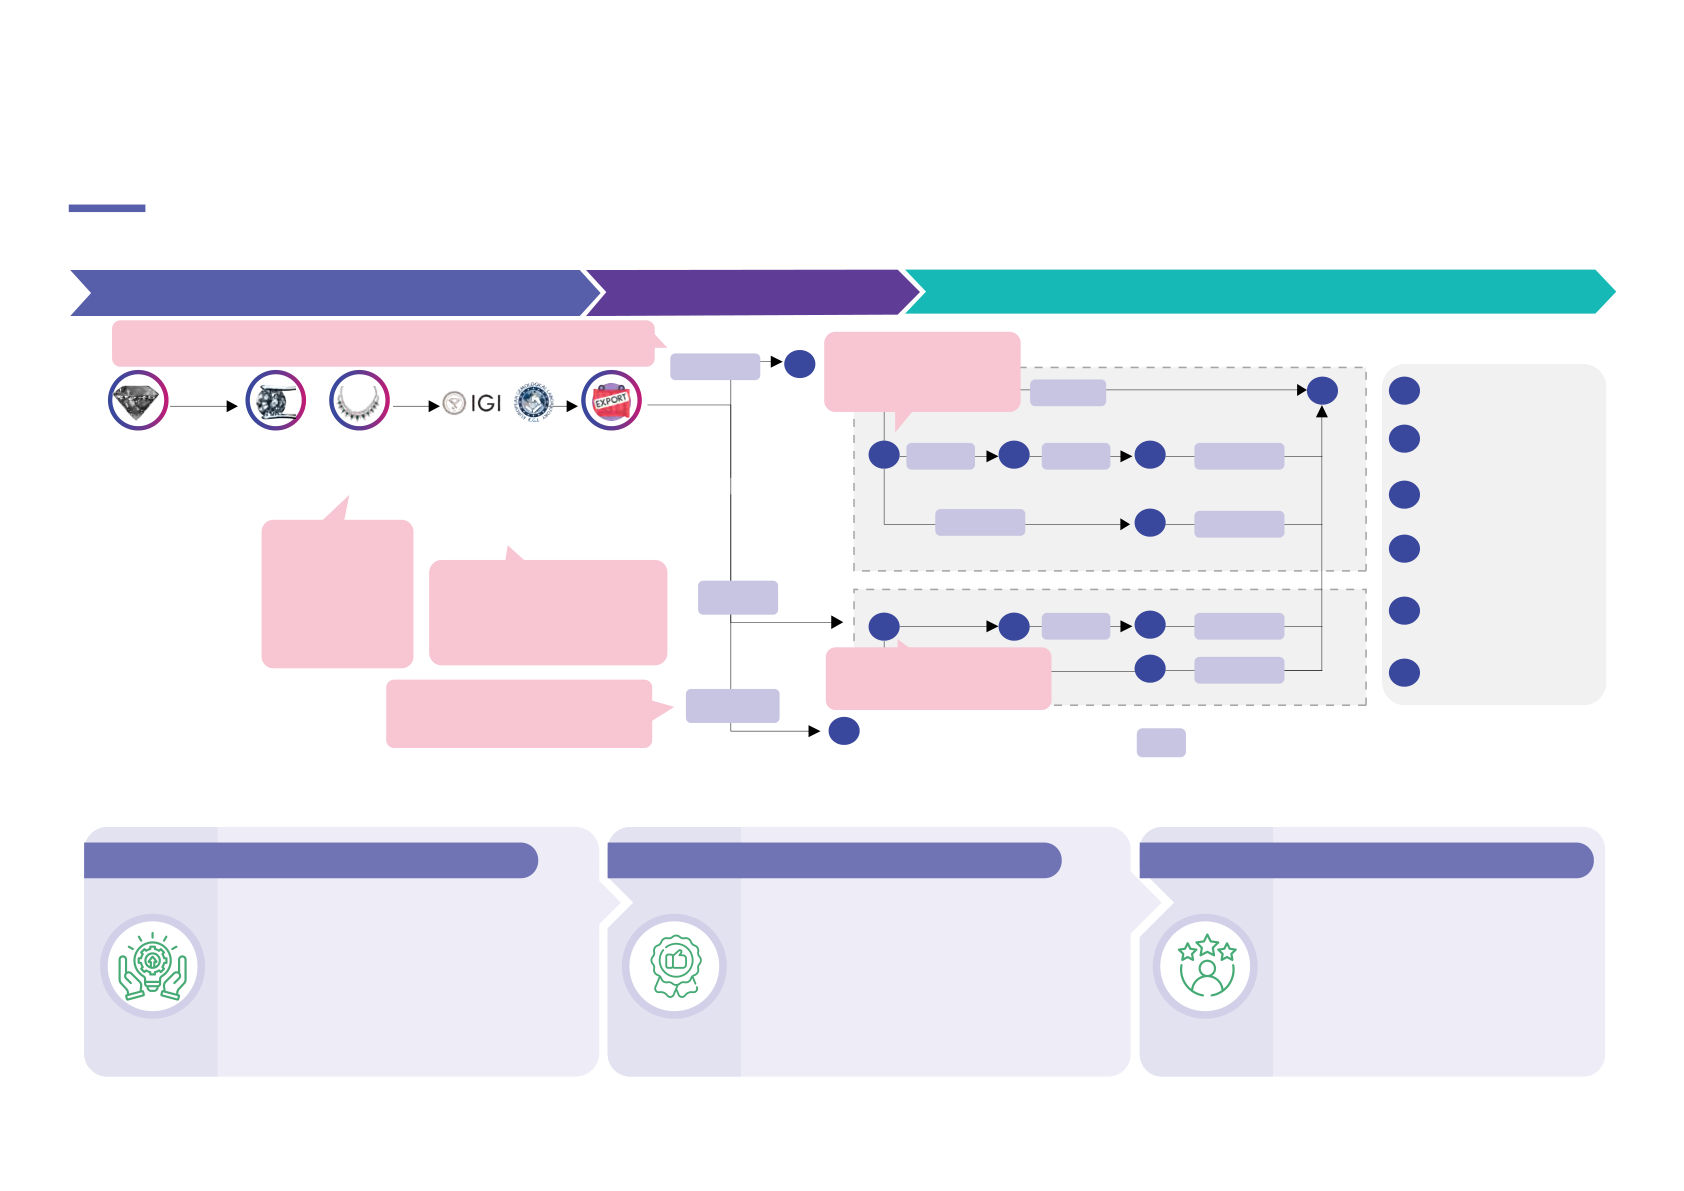
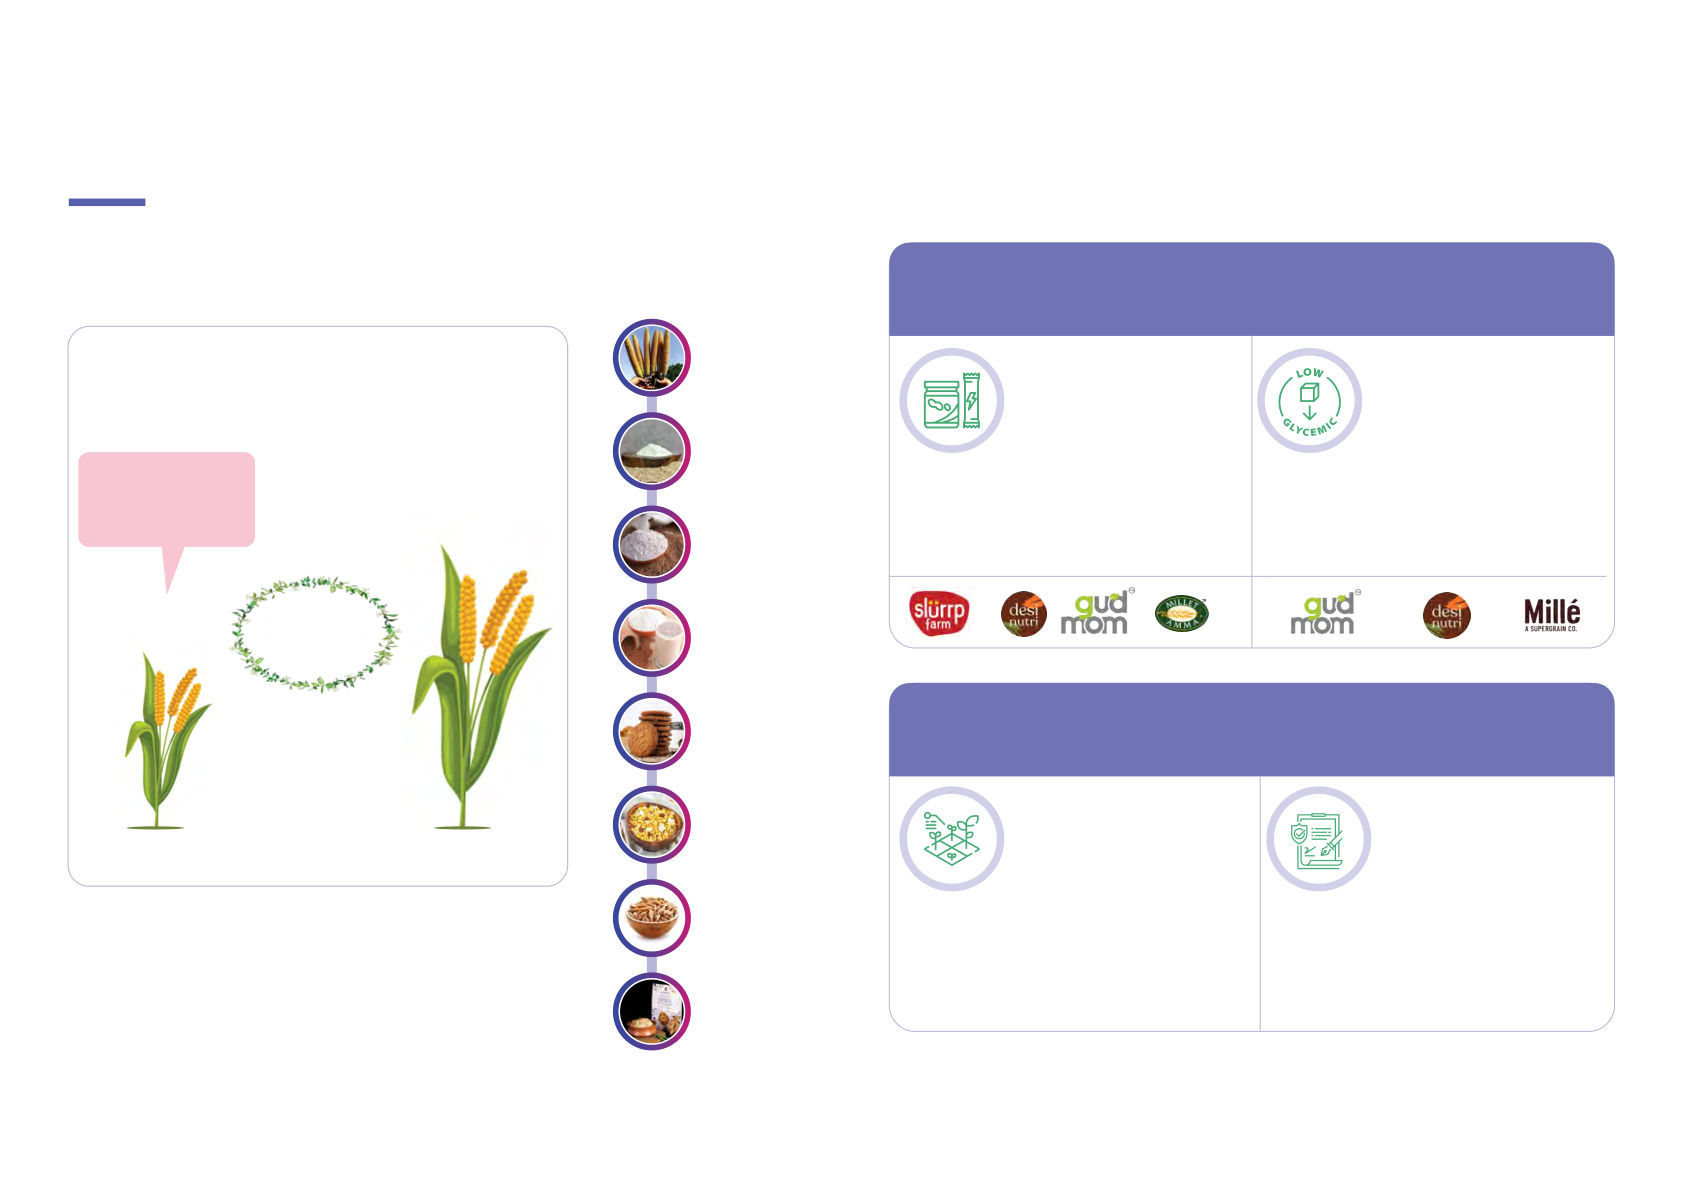
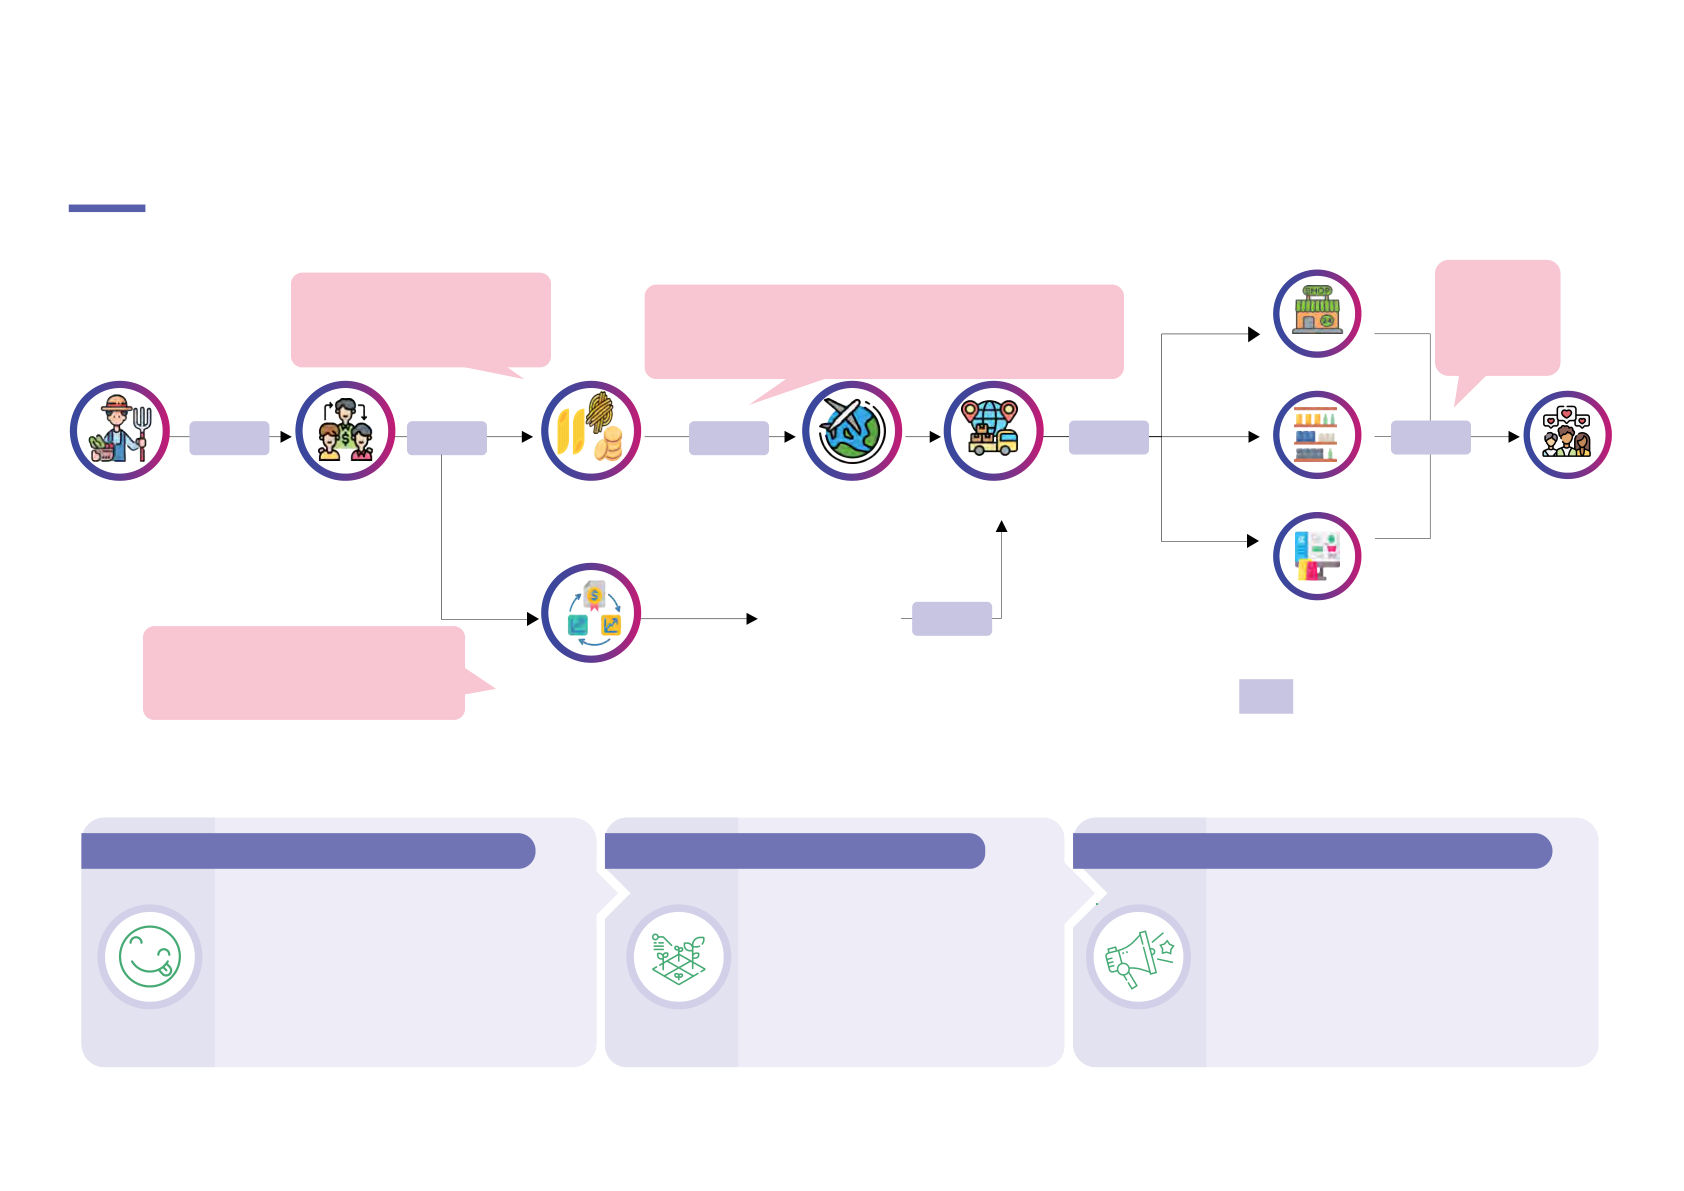
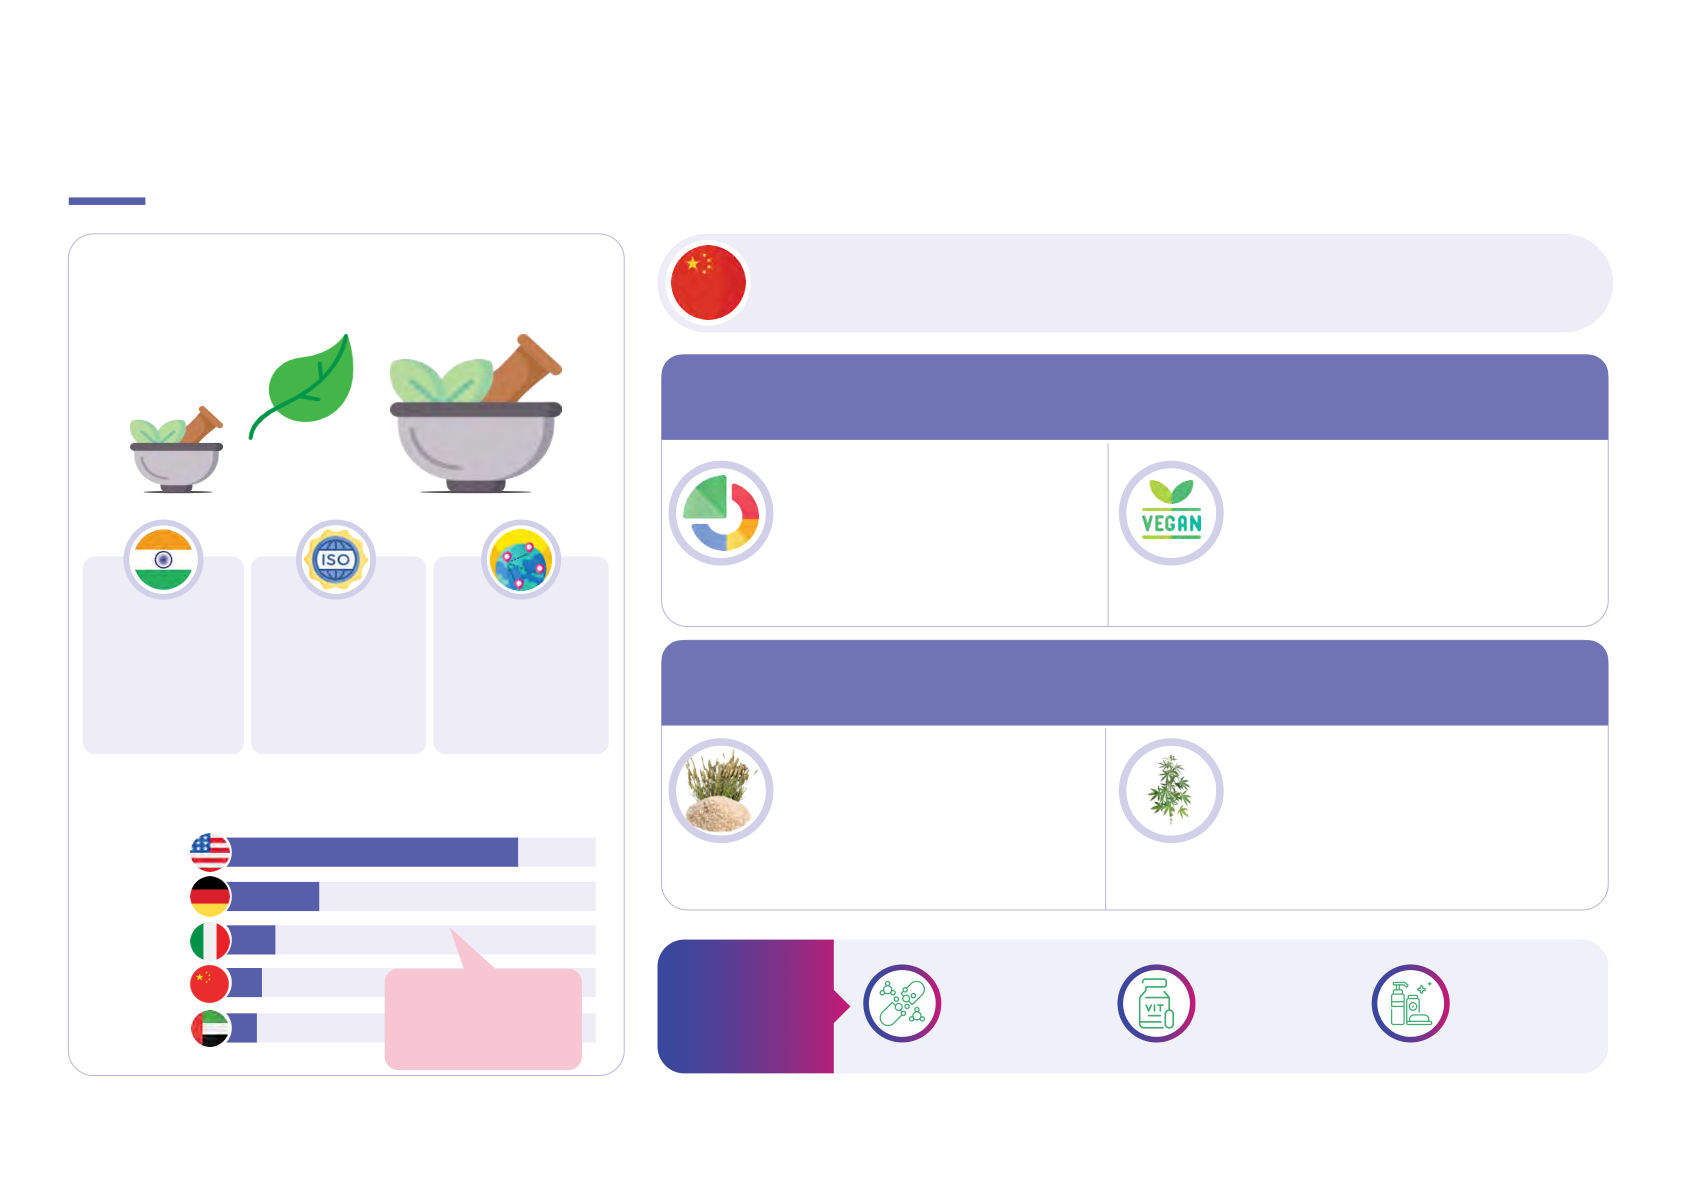
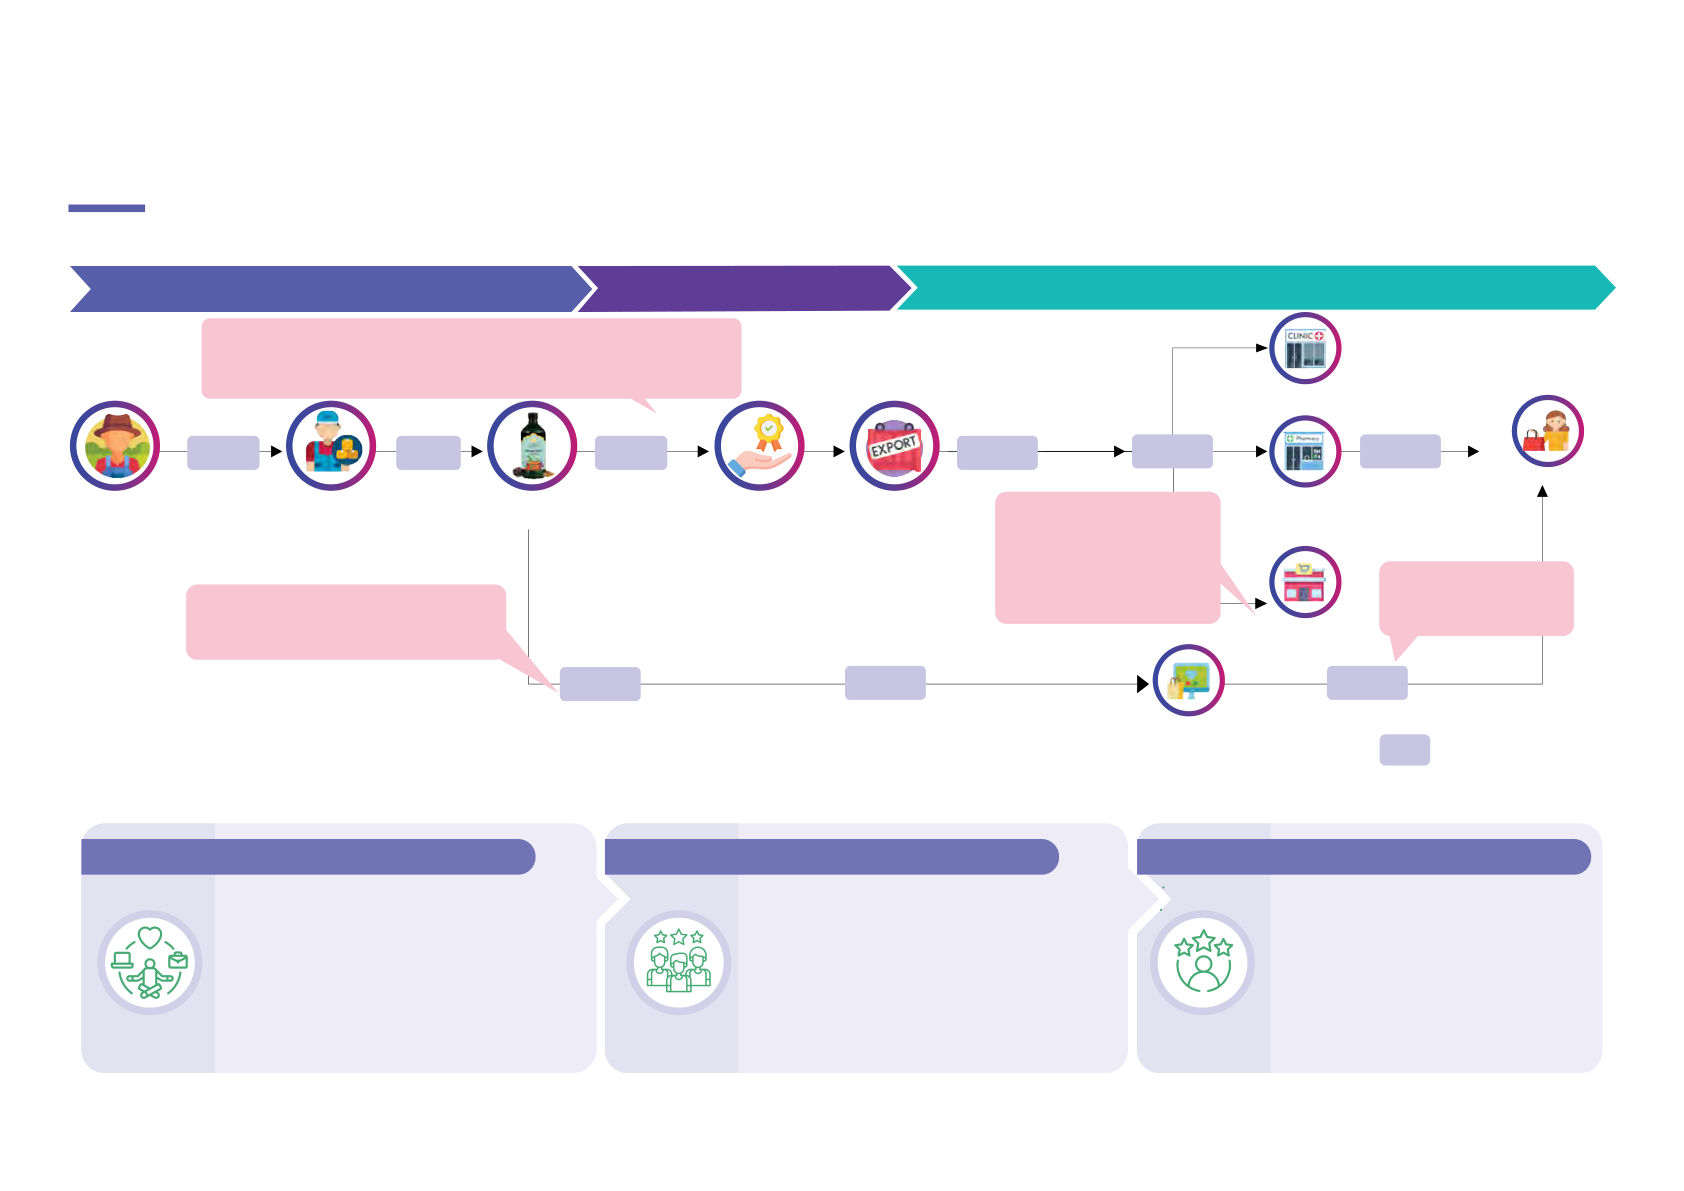
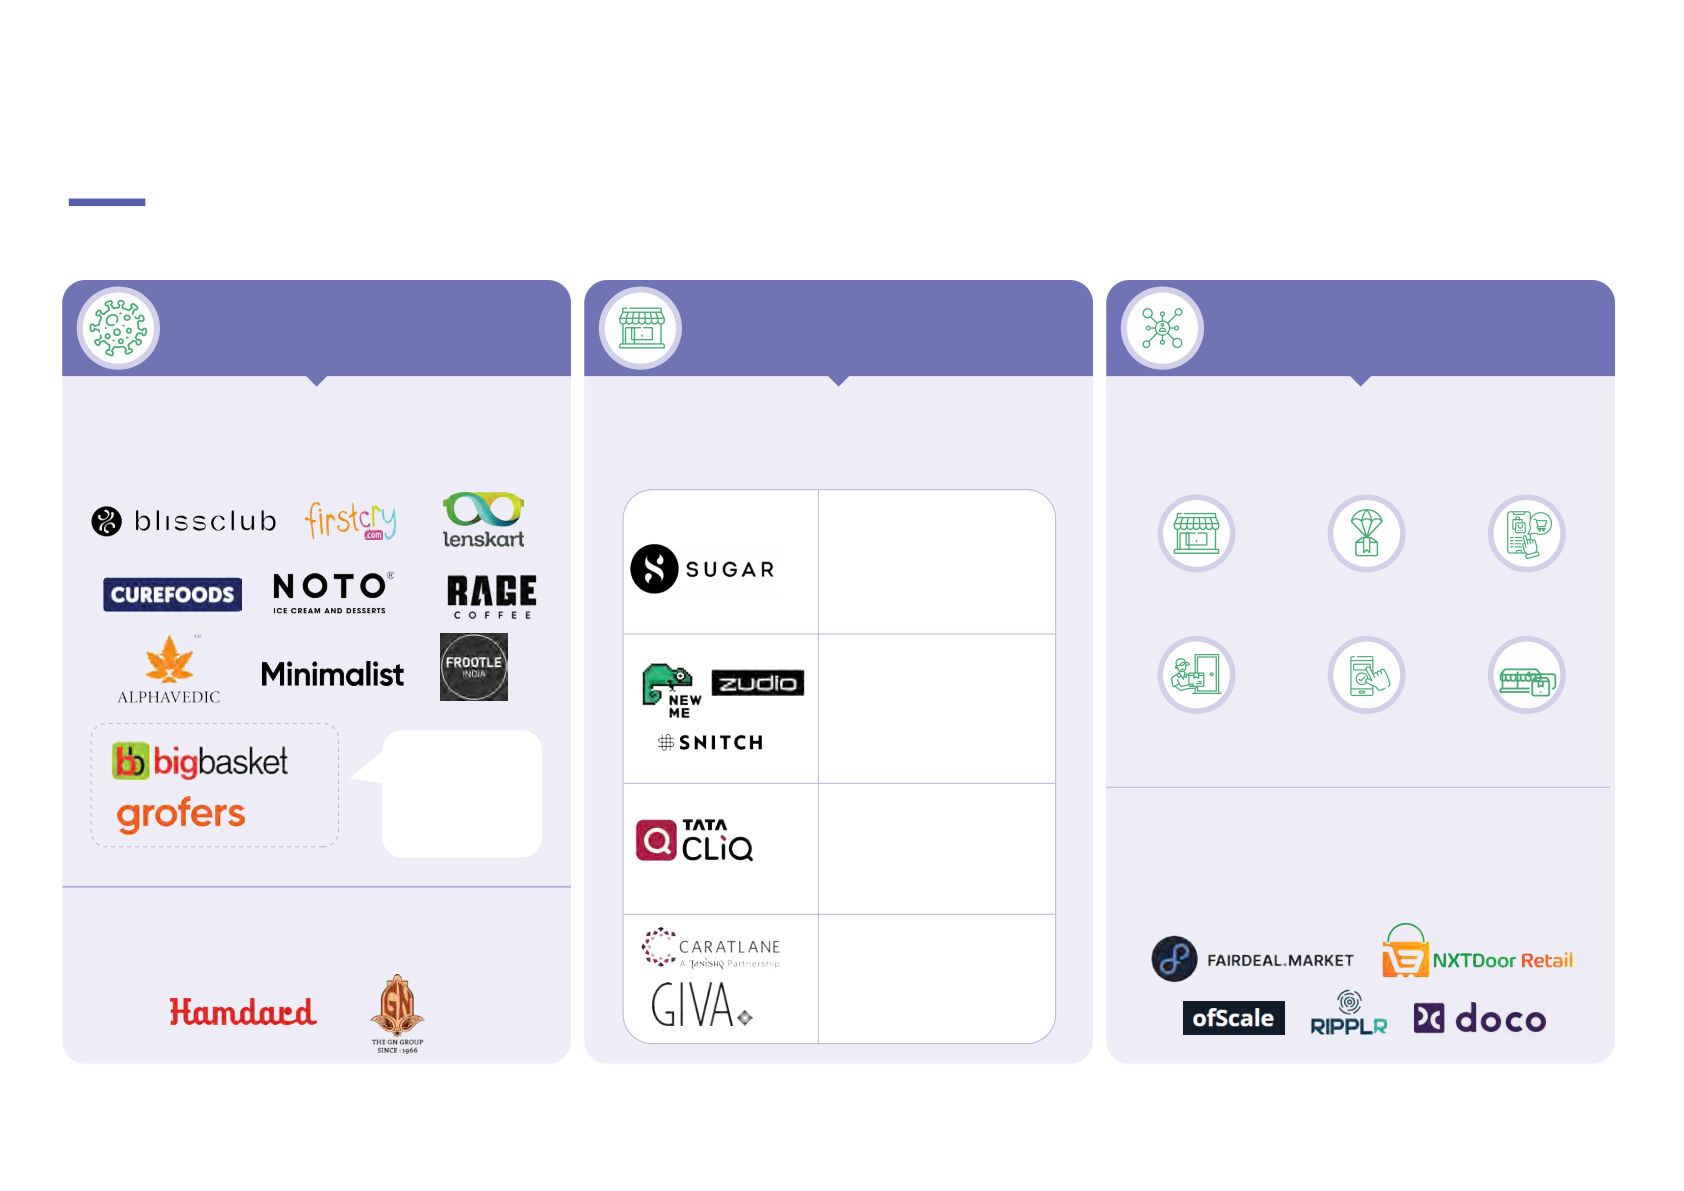
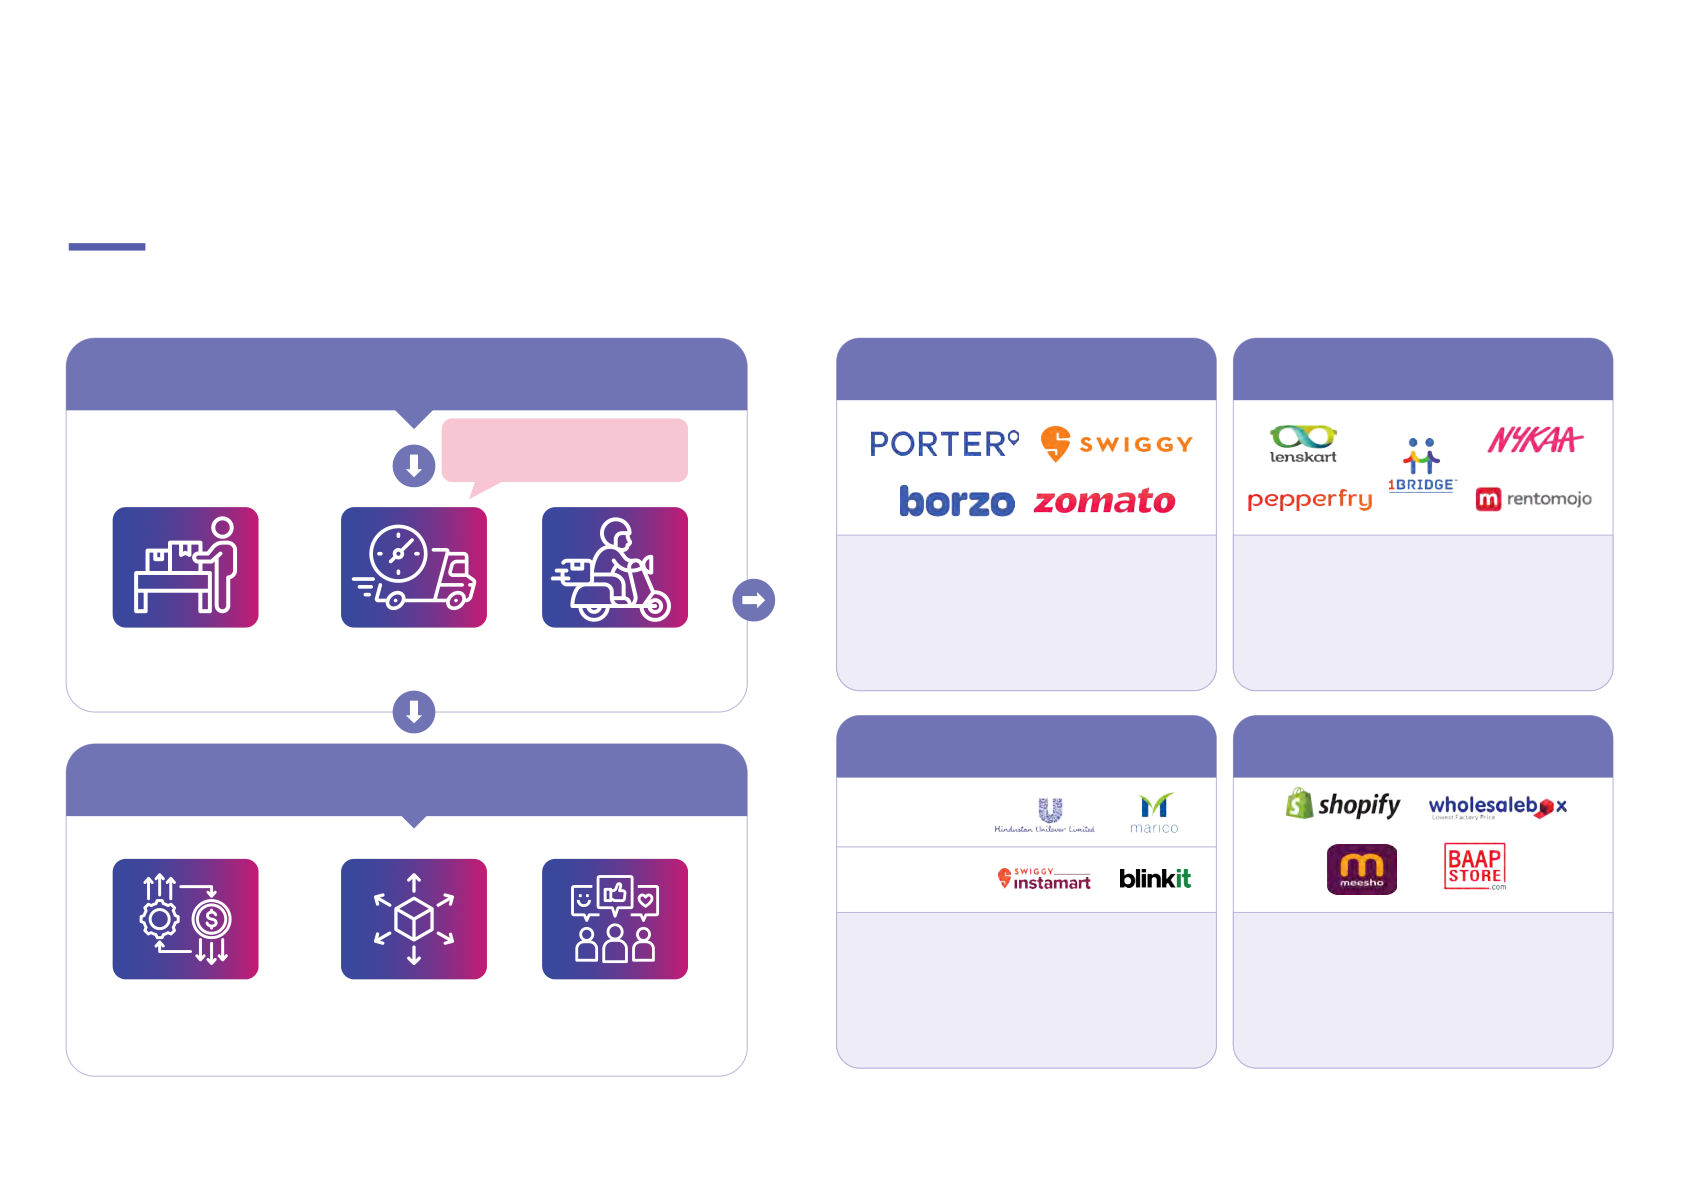
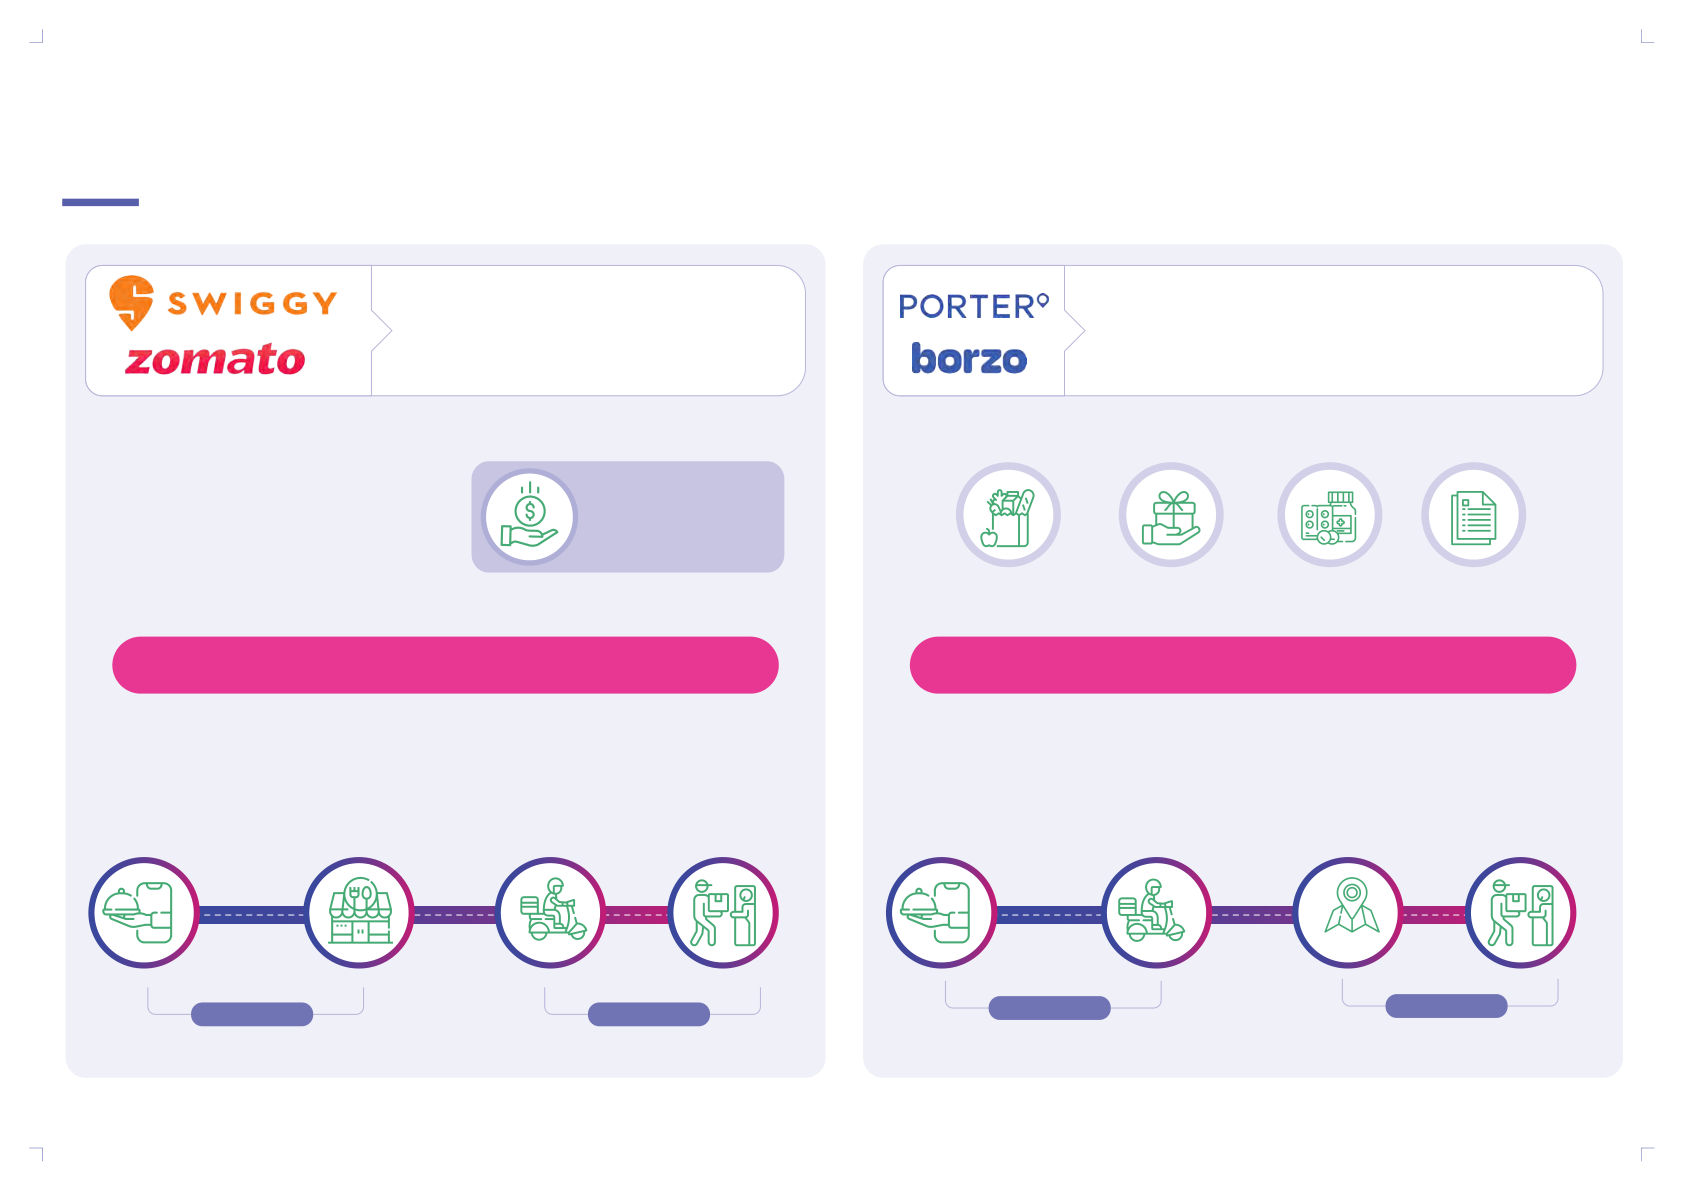
The Evolution of Indian Brands’ Distribution Powered by Confidential and FEB 2025 proprietary © 1Lattice Pvt. Ltd. About the Authors ANOOP MENON SARTHAK BISWAS SUDHIR SETHI Principal, Associate, Founder Chairman, Chiratae Ventures Investments Investment Team AMAR CHOUDHARY ABHILASHA JAJU CEO, 1Lattice Director, Financial Investors 1Lattice RAHUL JAIN SANDEEP CASHYAP Lead, Startups, Head, Emerging & Early Stage Startups, Google Cloud, AI & VC Ecosystem, India Google Cloud The ConsumerTech sector in India is and the execution efficiency needed on a remarkable growth trajectory, to succeed in building long-lasting, Foreword projected to reach US$ 300 billion by sustainable and valuable brands for FY27. This growth is being driven India. by product innovation, the adoption and reach of Digital Public In the course of this thesis, we also Infrastructure (DPI), strategic identify promising categories where backward integration and entrepreneurs can build strong verticalization, omnichannel brands within India or expand from expansion, and an increased focus India to global markets. By analyzing on building global brands. together, the supply chains, margin structures these factors are shaping the next and category-specific demand-side generation of consumer businesses trends, we provide a comprehensive in India and enabling them to blueprint for navigating this dynamic compete on the world stage. landscape and present the key right-to-win strategies for an The earlier edition of our entrepreneur building emerging ConsumerTech report laid out the brands for India. details of the above five pillars and deep-dived into the demand side We hope this report inspires and and brought out insights of informs founders to seize the consumer behaviour across income opportunities presented by the segments and tiers of Indian cities. evolving ConsumerTech landscape, This report is a deep dive on the both domestically and supply chains that have been built internationally. SUDHIR SETHI Founder Chairman, Chiratae Ventures ConsumerTech market expected to reach US$ 300B by 2027; Effective & modern distribution techniques have further helped unlock India's consumer potential New age US$ 300B distribution models The ConsumerTech Increased customer market is poised to expectations and an Key right-to-win reach US$ 300B by Emerging evolving distribution strategies FY27, fueled by domestic sectors infrastructure have led product innovation, Strategies such as to the emergence of Emerging export Demand for sectors growth of digital hero product / new distribution like health food, sectors public infrastructure, ingredient creation, models like athleisure, pet care, Indian exports across strategic backward brand building, crowdsourcing, and consumer sectors such as lab integration, adopting vertically integrated assisted buying, hub electronics is on the grown diamonds, omnichannel manufacturing, & spoke delivery, & rise domestically, millets, ayurveda method & going strategic catalog dropshipping, fueled by products & consumer global width, and global highlighting the health-conscious electronics a re market dynamic evolution of lifestyles, fashion seeing a rise due to diversification are India's omnichannel consciousness, higher govt. support through being adopted by landscape disposable incomes, the “Make in India for emerging brands to with a focus on the world” wave unlock market value sustainability Source(s): Secondary research, 1Lattice & Chiratae analysis © 1Lattice | 04 Right-to-win strategies Indian ConsumerTech brands today must map out clear right-to-win strategies across functions to capture evolving customer interest & become category leaders The winner’s playbook Brand building Strategic catalog Supply (trust, narrative & width exclusivity communication) Hero product / Product innovation Global market ingredient diversification Community building Omnichannel reach Pricing strategy Vertically integrated Sustainability focus Strategic manufacturing partnerships with 1 influencers & KOLs 1 Note(s): Key opinion leaders Source(s): Secondary research, industry reports, 1Lattice & Chiratae analysis © 1Lattice | 05 Agenda Unveiling Emerging Sectors ConsumerTech snapshot ConsumerTech market set to touch US$ 300B by FY27, fueled by 5 pillars including robust omnichannel presence and internationalization Indian ConsumerTech Cracking ConsumerTech: market to grow 3X by FY27 Pillars of success Product innovation Growth forecast • Innovative products m ee ting consum er n eed s US$ 300B • Go C o l or s & The Who l e Tr ut h tapping niche markets & i de ntif y ing whitespaces FY22-27 Robust digital public infrastructure • Taking small retailers online via ONDC 25% • B oo st in FinTech adoption w it h h ig her acc e ssi b ilit y t o g o v er nm e nt s er vic e s US$ 100B Vertical integration • Im pro v ed ma r gins, q ualit y & conv e ni e nc e via domestic production o f in-hous e br an d s • Strategic acquisitions f or e nd-t o-e n d c o nt r ol Omnichannel presence • Brands reaching a wider audience through increased accessibility • Seamless customer experience across channels Exploring international markets 350-400M Mobility, entertainment • B r an d s l e v er aging Indian diversity & shoppers cost-effective manufactu r ing t o mak e & media, fashion as expected to shop uni q u e prod ucts dominant sectors online by 2025 • Zo mat o & R az or pa y exp an ded a bro a d t o unl o ck higher growth Success factors requiring strong focus on complex distribution Source(s): Secondary research, industry reports, 1Lattice & Chiratae analysis © 1Lattice | 07 Emerging sectors Health food, Athleisure, Pet care are among the key emerging sectors in the domestic market; LGD, Millets & Ayurveda exports to grow significantly Key emerging sectors with accelerated demand for new-age distribution models From India, for India Thriving in India & abroad Navigating beyond borders Health food* Home Lab grown electronics diamonds Athleisure Millet based products Pet care Ayurveda products Note(s): *Inclusive of better-for-you brands © 1Lattice Source(s): Secondary research, 1Lattice & Chiratae analysis | 08 Agenda Unveiling Emerging Sectors Building for India Health food: Introduction India’s rising health awareness is driving the healthy food sector, creating space for solutions such as plant-based alternatives & personalized nutrition Rising consumer appetite for wellness Unveiling new horizons India’s health food market to reach US$ 30B by 2026 Emerging opportunities & themes Health F&B market size New ingredients (US$ B, CY20-26) Millets like ragi, bajra, jowar, a re nut r i e nt- r ic h , glut e n-f ree op tions w it h l ow gl y c e mic in dexe s Only includes packaged F&B products (excludes fresh foods) US$ 30B * * Hyperlocal farm to table delivery F a r m er s s e lling pe stici de- f ree prod uc e CAGR directly to customers & br an d s ad op ting 20% vertical integration US$ 10B Cultured meat & plant-based alternatives H ig h-pro t e in plant-based ingredients & r eal meat grown in labs f ro m animal c e lls * C Y2 0 C Y2 6 Meal kit delivery service He alt h f ood * Increased interest in F a r m er s s e lling pe stici de- f ree prod uc e pe n e t r ation is at 11% in directly to customers venture funding – startups India vs . 31% in US, that received funding indicating a large 1 between 2022-24 Healthy snacks/ dessert alternatives headroom f or g row t h Guiltfree snacks o ff er more nutritional valu e d u e t o lower levels o f suga r , fat, & a r tificial additiv e s Health-conscious demographic is to Micro-fulfillment centers for * grow from 108M in 2020 rapid delivery * to 176M by 2026 Small, st r at e gic w a re hous e s e nsu re ult r a-fast de liv ery o f fresh, healthy * groceries & prepared meals t o cust o m er s Note(s): 1 – Illustrative brands; *New-age companies based outside of India Source(s): Industry reports, secondary research, 1Lattice & Chiratae analysis © 1Lattice | 10 Health food: Distribution model Health food distribution being transformed with advanced logistics, rapid delivery systems & integrated production for fresher, faster, and sustainable nutrition Typical distribution model of a plant-based meat alternative brand Production Distribution Retail Cold chain logistics are used to store perishable items 15%- Ingredient Traditional Grocery store 25%- 20%- distributors 20% processors Offline 30% 25% 30%- R a w mat er ial 35% 45%- Regional su pp li er s 50% distribution Customers Speciality store Third party logistics for centers/ stockist Brands source Online storage & distribution their raw materials from countries like Ecommerce China, USA, Europe Private label ~12-15% of this goes platforms manufacturers/ Custom to the e-commerce/ q-commerce sites food manufacturers Supermarkets / hypermarkets Quick Indicative shares commerce XX% (as % of MRP) Building a strong right-to-win in health food 3 4 Crafting a hero product / ingredient Increasing brand share in GT & MT Aligning product differentiation with pricing • Hero prod ucts a re power ful t oo ls t o • H ig h br an d s h a re im pro ves • He alt h f ood pr icing should re main c r eat e brand buzz , st re ngt he ning shelf positioning & b uil d s close t o conv e ntional op tions t o 1 brand recognition & WOM retailer support , wh il e outlet s er v e as a d i re ct rep lac e m e nt & sta y 2 expansion is vital f or dr iving in t he custom er 's consideration set • St r ong STM st r ateg y beh in d re v e nue innovating hero prod ucts t o • Eye- catc h ing packaging , alongsid e add re ss unmet cust o m er n eed s • Freq u e nt prod uct sig h tings m ee ting unm e t & adjac e nt n eed s, can pro vi de a significant b uil d consum er trust & can d iff ere ntiat e br an d s f ro m c o m pe titiv e advantag e per c e iv ed quality simila r l y pr ic ed c o m pe tit or s 1 2 3 4 Note(s): WOM stands for word-of-mouth, STM stands for Speed-to-market, GT stands for general trade, MT stands for modern trade Source(s): Industry reports, Secondary research, 1Lattice & Chiratae analysis © 1Lattice | 11 Athleisure: Introduction Wellness trends combined with everyday comfort have boosted the activewear market; Brands are redefining activewear with a focus on tech & innovative fabrics Athleisure ‘wear anytime, anywhere’ The future of Indian athleisure wear Brands are exploring new avenues in activewear with a focus Growth in activewear segment due to shift towards on inclusivity and wearable technology comfortable clothing and versatile style Riding the athleisure wave The new era of sportswear * Technology guiding your workouts Notable funding activity Indian Athleisure market (2023-28) • Integ r ati o n o f biometric sensors f or * Brand Year Amt (US$) yo ga po sition guidanc e & real-time US$ 6-7B * health monitoring apps t o e nhanc e per f or manc e 2 0 2 4 25M CARG All about size-inclusivity ~13% 2 0 2 3 12M • O ffe r ing a wider size range , f ro m petite to plus sizes, e nsu r ing c o mf or t an d repre s e ntation f or all 2 0 22 15M US$ 3.5-4B Innovative fabrics redefining comfort • Using sustainable prod ucts lik e New-age brands biopolymer, bamboo & other materials * t o re gulat e body temperature Demand for culturally inspired yoga wear • Perfect for modern yogis. B r an d s a re tapping int o cultural inspirations t o captu re t he do m e stic yo ga w ea r ma r k e t's g row ing de man d Sustainability as an overarching theme Margin expansion driven by • Sustainabilit y influ e ncing not just brand philosophy b ut e v ery st ep o f t he premiumization, 15% 6 to 20 4-5 yrs supply chain localized supply From now to beat CAGR Stores by chains & SKU • B r an d s suc h as A ast ey h av e sta r t ed Decathlon online growth end of FY24 f o ll ow ing a 100% closed-loop supply expansion business (projected) chain an d upcycling waste polyester Note(s): *New-age companies based outside of India Source(s): Industry reports, Secondary research, 1Lattice & Chiratae analysis © 1Lattice | 12 Athleisure: Distribution model New Indian athleisure brands targeting eco-conscious youth are turning to a closed -loop supply chain; however, its high costs are hindering wider adoption Going circular: Distribution model of an Weaving a way to the top established D2C activewear brand From sourcing to manufacturing to distributing – brands today are trying to make the process sustainable from end to end Agile innovation cycles • Modest & modern cuts 7.8K kilotonnes o f Activewear is Closed-loop supply chain , de sign ed f or t he m oder n t ex til e w ast e on e o f t he i .e. , f ee ding re sou r c e s t h at In d ian wo man gen er at ed in India la r gest us er s o f h av e s er v ed t he i r p u rpo s e • Q uick innovation c y cl e s t o annuall y – 8. 5 % o f non- b i ode- back int o t he syst e m, is gl o bal t o tal g r adabl e fib er s t he n eed-o f-t he- hou r e nsu re de signs sta y fresh an d t he br an d re mains Inclusive of margins taken by the relevant ami d s h ifting t re n d s e-commerce platforms (~10%-15%) Reduce Catalog covering multiple 65%- functionalities 75% 15%- 10%- • A st r ategic catal o g t o pro vi de E-commerce 20% 20% varied functionalities t h at m ee t d iff ere nt n eed s o f a Raw Supplier/ Mill Manufacturer/ 65%- Consumer d iv er s e cust o m er g r ou p materials 75% Vendor • H aving tiered categories Own website/ stores ac ro ss functions, de signs, pr icing, e tc t o dr iv e be tt er (As fabric) ta r geting (As raw Waste Disposal materials) Sustainability driving the brand story Repair & • D e man d be ing dr iv e n by Recycling/ reuse center r ising eco-consciousness repairing process Drop-off center Recycle Forw a rd fl ow among In d ians t o da y Center Re v er s e fl ow • Tre n d s e tt er s suc h as A ast ey e m br acing e c o- f r i e ndlin e ss Note: Some other emerging brands have started as a central theme o f t he i r Indicative shares recycling and using recycled polyester for sustainability. br an d st ory XX% (as % of MRP) However, high costs limit its widespread ad op tion . Source(s): Association for Supply Chain Management – Journal of Operations Management, industry reports, 1Lattice & Chiratae Analysis © 1Lattice | 13 Pet care: Introduction Increase in pet ownership, humanization coupled with increase in disposable income has boosted growth of the pet care market India’s pet care market is paw-sitively booming Unleashing potential in pet food market India’s pet care market to reach US$ 1.9B by 2029 Brands are exploring in tailored nutrition, functional treats, and gourmet pet food Tailored nutrition India’s pet care market (US$ B, FY2 4- 2 9) • Customized food b len d s & alt er nativ e pro t e in sou r c e s to m ee t calorific needs US$ 1.9B Functional treats Pet food makes up • Tre ats t h at o ff er additional medical ~65-70% of overall benefits suc h as de ntal ca re , j o int pet care market su ppor t, or an x iet y r elief CAGR 17% Gourmet pet food US$ 0.9B • Pre mium pe t f ood lik e pet beer, pet ice * cream, pizza f or p u p s on t he r is e Human-grade pet food • Pe t f ood manufactu red in a mann er FY 2024 FY 2029 c o nsist e nt w it h re gulati o ns fo r ready-to-eat human food products Cat-alysts of pet care market growth The surge in pet ownership and emphasis on pet health fueling the market growth Focus on pet health & wellness Increase in pet ownership Increasing disposable income Pet humanization • R is e in pe t own er s f ro m • W it h m ore financial • Grow ing t re n d o f pe ts • Pe t own er s a re 20M to 30M ( FY re sou r c e s, peop l e a re be ing s ee n as family inc re asingl y inv e sting in 2 015-23) d u e t o willing to invest more members is dr iving natu r al & or ganic urbanization , c h anging in t he i r pe ts' inc re as ed s pe n d ing on functional pe t f ood as lifestyles & f o cus on we ll- be ing & c o mf or t premium & specialized t hey pr i or itiz e health & companionship prod ucts wellness f or t he i r pe ts Note(s): *New-age companies based outside of India Source(s): Industry reports, 1Lattice & Chiratae analysis © 1Lattice | 14 Pet food: Distribution model Leveraging the rise of specialty pet-focused brands, the distribution of pet food now ensures comprehensive solutions for all pet needs Typical distribution model of pet food brand Production Distribution Retail Pet store 20%- 20%- 15%- Offline 25% 25% 20% Pro c e ss ed as f ro z e n/ Warehouse Traditional distributors Customers re f r ig er at ed pe t f ood Veterinary clinics 30%- 10%- 35% 20% Offline Supermarkets / hypermarkets Ingredient 40%- Ecommerce sourcing 50% platforms The br an d mak e s ~ 40-50 % ma r gin Formed into other out o f wh ic h 10-15 % is tak e n by biscuits, nuggets etc e- c o m / q- c o m p latf or ms Indicative shares XX% (as % of MRP) Quick commerce Blueprint for success in the Pet Care industry Need-based ingredients India-first products Community-driven brand building • W it h pe t humanization on t he r is e , • Innovating unique toys & • C r eating cont e nt t o educate & br an d s tu r ning t o high-nutrition accessories he l p cust o m er s add re ss pet ingredients in pe t f ood • Manufactu r ing t he m in India care concerns instead o f im por ting f ro m o t her • Addre ssing specific health areas • Using a brand voice t h at count r i e s t o l ower costs t o he l p bey on d basic nut r iti o n suc h as re sonat e s emotionally , w ithout ma x imiz e margins q ualit y o f fu r & m ob ilit y a h a rd- s e ll app ro ac h Source(s): Industry reports, 1Lattice & Chiratae analysis © 1Lattice | 15 Home electronics: Introduction With rising domestic demand in segments such as smart wearables & government push for exports, home electronics takes centerstage both nationally & abroad India’s multi billion-dollar electronics ecosystem Superior value-creation by new-age brands Domestic manufacturing & exports to see double-digit growth by FY 2026 D2C brands riding the growth wave both nationally & internationally While legacy brands dominate, new-age brands are quickly gaining Domestic Export market share through strong product innovation manufacturing opportunity* capacity* (FY21 – FY26) (FY21 – FY26) ~US$ 182B 2 ~US$ 39B nd • 2 in global • ~10x surge in • Pr esenc e o v er • ~50% Y-o-Y 1 wearables ma r k e t , scale, with 140 countries, g row t h in t he c o m pe ting w it h revenue rising inclu d ing US, E U, last t wo FY s CAGR international from USD 8.3M & M ENA • ~ 40% do m e stic CAGR ~64% p la yer s lik e App l e , to USD 78.6M • W it h o v er ~2X ma r k e t s h a re in ~34% Xia o mi, e tc . (FY20 to FY23) g row t h , re v e nu e t he e l e ct r ic • ~24-25% ma r k e t • Achieved ~USD su r pass ed ~ USD pre ssu re cook er s h a re in t he o v er all 120M in ARR (FY 27.2 M in FY2 3 categ ory domestic 23) & on the way we a r ables to profitability ~US$ 3.5B ~US$ 43B segm e nt by FY24 Mobile phones lead in exports, while smart wearables continue to gain domestic interest Make-in-India push + Increased PE/VC interest Rising affordability + high tech functionalities • Multi p l e P LIs & su ppor ting po lici e s f or mulat ed by t he • R ising affordability dr iv e s t he ad op tion o f sma r t g o v er nm e nt t o p us h “Make in India for the world” f or w ea r abl e s w it h diverse functionalities , re placing simpl er mobil e p hon e s, I T h a rdw a re , e tc fitness ban d s • Inc r eas ed int ere st f r om PE/VC investors for new-age • Subtle-tech innovations & fashion-forward de signs fu r t her consum er e l e ct r onics sta r tu p s, s ee ing t he g row t h dr iv er s o f o v er all we a r ables de man d do mesticall y po t e ntial in t he segm e nt Note(s): *Specifically includes mobile phones, IT hardware (incl. laptops, desktops, tablets, TV & audio, wearables & hearables), 1 2 2nd among the biggest producers based on volume in Q3 2023, Estimated exports trend © 1Lattice Source(s): Indian Cellular Electronics Association (ICEA), industry reports, 1Lattice & Chiratae analysis | 16 Home electronics: Distribution Competitive pricing with exceptional quality, product innovation, and trust are key to capturing market share in legacy-brand dominated markets Distribution and retail Pre-production and quality check Assembly and final QC Inclusive of 7-10% 35-40% of platform margin Higher due to import duties and complex tech used in Inclusive of 8-12% components E-commerce PCB and platform margin platforms Manufacturing / battery are Assembly plant being imported 35-40% from China Shipped via 45-50% 7-10% 35-40% D2C channel End Own website QC of Company Q-comm dark store customers components warehouse Testing and quality sourced from the control of finished third-party 35-40% product Hardware components like vendor straps and casings are Electronic Offline channels Modern trade sourced from majorly from Inclusive of 8-12% stores channels China and manufactured store margin by a third-party vendor Indicative margins in the wearables segment XX % (Note: all percentages are on MRP) Successfully navigating the home electronics market Superior product quality at delta price ‘Smart’ product innovation Cracking omnichannel & building trust • Value-conscious customers • Consumers are demanding advanced • Cracking MT in the domestic market today are willing to pay a small features (e.g., energy saving, home through strong distributor/retailer premium for noticeable quality automation, etc.), even in conservative relationships for segments like home improvements segments such as home & kitchen & kitchen appliances to compete appliances with legacy brands • Many new-age brands are emerging with robust • Innovating ”smart” devices is crucial for • New-age brands in online-focused product-price strategies & capturing market share amid growing categories like phones & wearables challenging legacy brands global demand for multi-device must prioritize building trust on connectivity & advanced functionality marketplaces & q-comm Source(s): Industry reports, 1Lattice & Chiratae analysis © 1Lattice | 17 Agenda Unveiling emerging sectors Navigating beyond borders Lab-grown diamonds: Introduction LGD exports have tripled since FY21, with USA accounting for 60% of the share; Scope for Indian brands to leverage HPHT machine fabrication & industrial application 1 A new era of luxury jewelry market USA accounts for ~60% of LGD exports from India Share of lab grown diamonds exports rose from 0.6% to 4.5% from FY18 to FY23 While exports to UAE and Hong Kong are growing rapidly Exports of gems & jewelry from India Export value of LGD 18% (US$B, FY18-23) (US$M) 21-22 22-23 YoY Growth (%) 1,047 0.2 0.2 0.2 1.3 1.7 885 0.4 1.4 1.0 1.9 1.6 0.3 0.4 0.4 0.4 1.6 0.4 0.6 11.9 9.3 9.3 9.6 38% 52% 19% 12.0 0.8 0.2 5.0 247 206 179 119 135 100 24.4 23.7 23.8 22.0 18.7 16.3 2 USA Hong Kong UAE Others 0.6% 0.6% 1.2% 2.5% 3.3% 4.5% Natural Diamonds Gold jewellery Silver jewellery Coloured gemstones Lab grown diamonds Others LGD % of total gems & jewelry exports HPHT machines, industrial application & memorial diamonds are areas that can be leveraged by Indian brands HPHT machines in India Industrial application Memorial diamonds • Tr ansf or ming human ashes or • There a re 15+ application • In d ia cu rre ntl y lacks the hair int o diamonds by ex t r acting a r eas o f L G Ds bey on d j ewe l ry capability t o fab r icat e HPHT ca rb on f ro m t he m an d using d u e t o t he i r hardness, machines , po sing a c h all e nge advanc ed HPHT pro c e ss e s thermal conductivity, & t o ac h i e ving an e nd-t o-e n d * electrical properties su pp l y c h ain * * 1 2 Note(s): LGD – Lab grown diamonds, High-Pressure High Temperature (HPHT) ; others include Israel, Belgium, Singapore, Thailand, Australia, etc , *Brands based outside of India Source(s): Euromonitor International, industry reports, 1Lattice & Chiratae analysis © 1Lattice | 19 Lab-grown diamonds: Distribution model Precise production method is key to LGD supply chain; Leading with tech innovation, unique store experiences & a strong emotional brand story drive success Distribution model of a lab-grown diamond brand Production & quality control Export process & logistics Distribution & retail Exporters can opt to take 1 out of 3 paths – selling through an The agent can opt to agent / broker, trade shows or directly on e-commerce platforms take 1 out 3 paths – sell A ~20-30% to wholesale, retailer or Exported B A Agent / broker ~75% directly to customers Raw materials Cutting Made Third party Exporters B Customer A 10-15% C ~20% D ~50-55% & chemicals are notify customs and into Quality sourced for polishing jewelry assurance and provide C Wholesaler diamond necessary and 20-25% D ~50-55% growth documents Some certifications D Retailer manufacturers Manufacturing have in-house IGI charges US$ 10 per cutting and carat for jewelry 20-40% LGDs are polishing as well E Trade shows certification & US$ 15 per created using ~20% D ~50-55% as jewelry E C carat for loose diamond either CVD* or making facilities certification Trade shows can opt to HPHT* D ~50-55% F Online platforms sell to wholesaler, retailer processes. The exporter makes ~70-80% or to the customer directly 70%-80% margin out of which some % is taken by online platforms F Indicative shares (as % of MRP) XX % (Note: Margins in this sector are extremely volatile) Crafting a winning edge in the market Investing in seedless technology Creating a unique offline experience Memorable & emotional brand story • Adopting pioneering tech for • Traditional players have long embraced • Mined diamonds have long seedless LGD production , as seen in the "customer is king" mantra with been associated with legacy & countries like South Korea – a exceptional in-store hospitality emotion strong competitive advantage • To compete, new-age brands to offer a • Important to build a strong unique experience (e.g., celebratory • Reduced HPHT dependency leading brand story around LGDs to to easier & faster 15-minute dinner with an engagement ring create an emotional connection production, down from a minimum purchase) throughout the customer with the customer & foster of 7-8 days journey to build brand pull brand recall Note(s): LGDs – Lab grown diamonds, *High-Pressure High Temperature (HPHT) and Chemical Vapor Deposition (CVD) Source(s): 1Lattice & Chiratae analysis © 1Lattice | 20 Millets: Introduction Rising demand for healthier snacks and a viable alternative to rice / wheat could make millet exports from India a US$ 2B opportunity by FY30 Current & potential export of millet & value-added Millet –The next superfood millet products (FY24-30) With rising demand for healthier food options, India can be the health foods capital Grain India’s millet market Healthy snacking Alternative for US$ 93M (US$ B, FY2 4-30) is the new trend diabetic patients Mill e t snacks, r ic h in Launc h ing low glycemic Flour balanced index mill e t prod ucts, micronutrients, a re c o mpa red t o wh eat & US$ 138M Current millet s ee n as a healthier r ic e , o ff er s In d ian exports are just alternative t o cu rre nt br an d s a gl o bal ~1% of India’s millet production ~US$ 2B snacks by h ealt h oppor tunit y t o ta r get Malt e nthusiasts gl o ball y diabetic population US$ 7M Potential after Beverage mixes ~US$ 71M* value addition US$ 322M Biscuits 2023 –International year of millet Declared by the United Nations to promote millet US$ 672M cultivation and usage globally Incentivizing the Expedite Snack mixtures farmers to promote policymaking to US$ 404M millet production ensure faster growth Government bodies a re Po lici e s suc h as public Noodles / Pasta inc e ntivizing fa r m er s w it h procurement and INR 10K per hectare o f distribution of millets , US$ 268M • India should shift from grain export to millet lan d t o g row mill e ts t he announc e m e nt o f flour & value-added products along w it h t he n e cessa ry MS P can be d on e t o • Due to the lack of HS codes, data on flour and RTC mixes eq uipm e nt req ui red fast-t r ack t he pro c e ss value-added products is not formally captured US$ 140M but it is estimated to be minuscule Note(s): *Millet exports in FY24 © 1Lattice | 21 Source(s): Secondary research, APEDA, ICMR, 1Lattice and Chiratae analysis Millets: Distribution model Taste-first product innovation, strong farmer networks & building a strong brand image through customer education are key to navigating international markets Distribution model of a millet brand 3-4% margin There are two types of millets: is for E-comm FSSAI certification is mandatory for export; However, regular & organic. Obtaining a platform additional certifications such as ISO 22000, USDA / FDA, license for organic millet (when sold Halal, and EU Organic might be required depending on requires at least three years online) the destination of the trade General trade 5-10% 2-5% 25-30% 35-40% 20-25% Supermarket Customer / F a r m er Farmer producer Biscuit, noodles, International distributor end user organization pasta manufacturer (FPO) / Aggregator E-commerce platform 25-30% Rebrands and Millet flour resellers earn more than sells flour manufacturers of biscuits, noodles, and pasta due to the latter's higher Millet flour reseller XX % production costs Indicative margins (as % of MRP) Small grains, big gains: Nailing the millet master plan Taste-first product innovation Strong farmer tie-ups Awareness creation via customer education • Reputation for poor taste in • Partnership with regional • Awareness building by educating health foods farmer networks for customers about millets hands-on quality & • Continuous innovation to • Covering usage, nutrition & production control ensure the taste is as good farm-to-fork stories with a fun as or better than • Elimination of middlemen, brand voice to boost TOMA & conventional alternatives thereby widening margins brand recall Source(s): Industry reports, secondary research, 1Lattice & Chiratae analysis © 1Lattice | 22 Ayurveda: Introduction Growing acceptance of Indian Ayurvedic products and trends toward natural and organic health & wellness has sparked a surge in exports from India Export potential of Ayurveda market Challenging China (FY21-FY30) With similar bio-diversity and cultural roots, China holds ~13% share of the global herbal market compared to India’s 2% US$ 10B ~40% India can compete with China by capitalizing on the following US$ 0.5B untapped opportunities Strategizing product- Riding the plant-based trend market fit • Substantial use of animal- derived • Product identification based products in TCM * on diseases prevalent in key • Plant-based Ayurvedic products markets in line with the veganism trend • Rigorous clinical validation globally In d ia is the 2nd ~30% increase Pro m o tion o f largest exporter in exports Ay us h prod ucts o f Ay u r veda & between 2014 in o v er 165 With rigorous clinical validation, India can unlock the full potential of alt er nativ e & 2020 count r i e s these medicinal plants in the foreign market m ed icin e t hr oug h ISO gl o ball y standards ro ut e Psyllium (Isabgol) Medical cannabidiol / Indian hemp Exports of Ayush & herbal products from India • India -Top psyllium producer • US FDA-approved ing red ient (US$M, FY23-24) • Untapped potential - Kno w n in • Untapped potential – Can Ay urv ed a f or therapeutic address IBS in the US with USA 183 properties ; h ig h export potential 10-15% affected population t o t he US w it h inc re as ed R &D Germany 62 Italy 36 China 28 Ashwagandha is the Niche Nutraceuticals Dietary Personal care most sought-after & medicines supplements products segments health supplements & UAE 25 is exported to 60+ countries Note(s): AYUSH stands for Ayurveda, Yoga, Naturopathy, Unani, Siddha and Homeopathy as a government ministry*Traditional Chinese Medicine, IBS – Irritable bowel syndrome Source(s): Ministry of Chemicals & Fertilizers, Trade Promotion Council of India, 1Lattice & Chiratae analysis © 1Lattice | 23 Ayurveda: Distribution model Positioning Ayurveda as a lifestyle, with expert development and online-offline partnerships, can boost global acceptance Distribution model of an Ayurveda brand Production and quality check Export process & logistics Distribution & retail Products need to comply with regulatory requirements regarding labeling (ingredient lists, dosage instructions, etc.) and certifications (organic, Ayush certifications, drug approval process in the target export country, e.g. FDA in the US) Ayurvedic clinic & practitioners 50-55% 20-25% 5-7% 3-5% 10-15% Offline Customers Pharmacies/ Ayurveda products in Farmers or Collectors / Manufacturers Quality Exporters notify health stores foreign countries are cultivators supplier assurance customs and primarily sold in super - markets / hypermarkets provide necessary 8-12% margin of this as there are very minimal documents is for the e-commerce ayurveda clinics abroad Some manufacturers directly sell platform the products through e-commerce Supermarkets/ platforms abroad hypermarkets 45-50% Online 35-40% Ecommerce platforms Indicative margins XX % (as % of MRP) The Ayurveda formula for success Lifestyle-integration of Ayurveda Technical R&D team Brand communication & building trust • Heavy reliance of ayurveda industry • Changing the perception of • Leveraging targeted influencer Ayurveda from curative care to on medical expertise & complex marketing & partnerships with preventive care ingredient knowledge key stakeholders (e.g., wellness centers, clinics) to strengthen • Introducing daily-use products such • R&D team with deep domain brand communication knowledge to create truly effective as skincare with modern packaging products to make them more attractive & • Fostering credibility & building increase usage trust in product efficacy through trusted voices Note(s): AYUSH stands for Ayurveda, Yoga, Naturopathy, Unani, Siddha and Homeopathy as a government ministry Source(s): PIB, Invest India, 1Lattice & Chiratae analysis © 1Lattice | 24 Agenda The Omnichannel Evolution: Embracing New Distribution Models Birth of omnichannel era Continued demand for in-store shopping amidst e-commerce surge has accelerated omnichannel growth in India The omnichannel era Drivers of accelerated online-offline integration in India The COVID boost –Accelerated Physical retains appeal Omnichannel integration into demand for online shopping despite e-commerce boom existing distribution models The pandemic boosted online-offline integration Including physical store as a Experience centers in India, driving e-commerce growth , giving rise to today further elevate in-store shopping through touchpoint in an online journey not as 800+ D2C brands by 2021 AR/VR integration, walkthrough studios, etc. complex as before • 100 new EBOs between 2022-2023 • ~50% retail sales from offline stores Drop Buy-online, Ship from 1 in 2023 shipping pick up in store store • Fast fashion frenzy: Online-focused fashion brands 2 rush into physical Book online , Buy online, In-store buying, stores pickup in store return in-store home delivery ~45% m ore order s + ~20% h ig her AOV • Tata Cliq Palette d u r ing lock dow n Emergence of new-age omni- stores launched in channel & distribution enablers Mumbai empowering online-only D2C brands boost omnichannel adoption & reach physical stores Offline-focused legacy brands 4 • BOPIS gained also joined the race & built e-commerce presence more traction post pandemic 1 2 Note(s): Sellers sell products online without holding any inventory, as a third-party supplier stores & ships them directly to customers; Without prior payment; 3 4 Inexhaustive list of brands; Buy Online Pick-Up in Store © 1Lattice Source(s): Industry reports, secondary research, 1Lattice & Chiratae analysis | 26 Need of new age distribution models Evolving customer preferences led to the emergence of innovative distribution models facilitating higher cost efficiency, scalability & enhanced customer experience New age distribution models Under the traditional e-commerce model, the order was delivered within 4-7 days, however Assisted buying & SiS* Crowdsourcing With an evolving distribution infrastructure, there delivery adoption was a change in customer expectations Brands such as Lenskart provide next-day delivery in 8 cities, soon to reach 25 System of employing contractors Includes in-store guidance or to carry out deliveries using their online support to ease purchase own vehicles , going from decisions, and boost offline warehouses, stores or fulfillment footfall through Shop-in-Shop a - Buy Online, Pick Up Same day / <2 <1 hour centers to the customer doption In-Store days delivery delivery Hub and Spoke Drop shipping Leading to the emergence of innovative distribution models offering advantages like Traditional companies New-age companies Centers on a main location (the Order fulfillment method where a hub) & multiple spokes business purchases finished branching out. The hub stocks products as needed from a third Cost Scalability & Enhanced customer goods, while the spokes are party , rather than keeping efficiency flexibility experience distribution centers products in stock Note(s): *SiS refers to Shop-in-Shop format wherein the primary retailer agrees to rent out part of its business space to a brand © 1Lattice Source(s): Secondary research, 1Lattice & Chiratae analysis | 27 Case study: Crowdsourcing Crowdsourcing: Evolution of the model from only food delivery to package delivery for various categories Birth of new companies offering Initial model started with courier & package delivery under food delivery apps various categories 1 2015 -present 1 2017 -present App s lik e Porter an d B or zo (f or m er l y WeF ast) conn e ct us er s w it h n e a rby de liv ery pa r tn er s f or e ffici e nt p ackag e de liv eryo f va r i e s it e ms suc h as: Delivery on food delivery apps like Swiggy & Zomato are completed by INR 1B+ contractors who complete the Valuation ac h i e v ed deliveries from the restaurant to the by bo t h in 2 01 8 customer via their own vehicles Groceries Gifts Medicines Documents 2 INR 40-100 Delivery fee per order is charged INR 50-200 Delivery fee per order is charged Rider accepts the Restaurant Rider collects Customer Rider accepts Rider delivers order on the app & prepares order the order & places order order and travels order to goes to restaurant & packs it till delivers it to on the app to location A to location B to to pick order rider arrives the customer collect it collect it Location A Location B 15-30 min 10-15 min 15-20 min 15-20 min 1 2 Note(s): ndicates dates when apps launched and not when company started Basis item value and distance Source(s): Secondary research, 1Lattice & Chiratae analysis © 1Lattice | 28