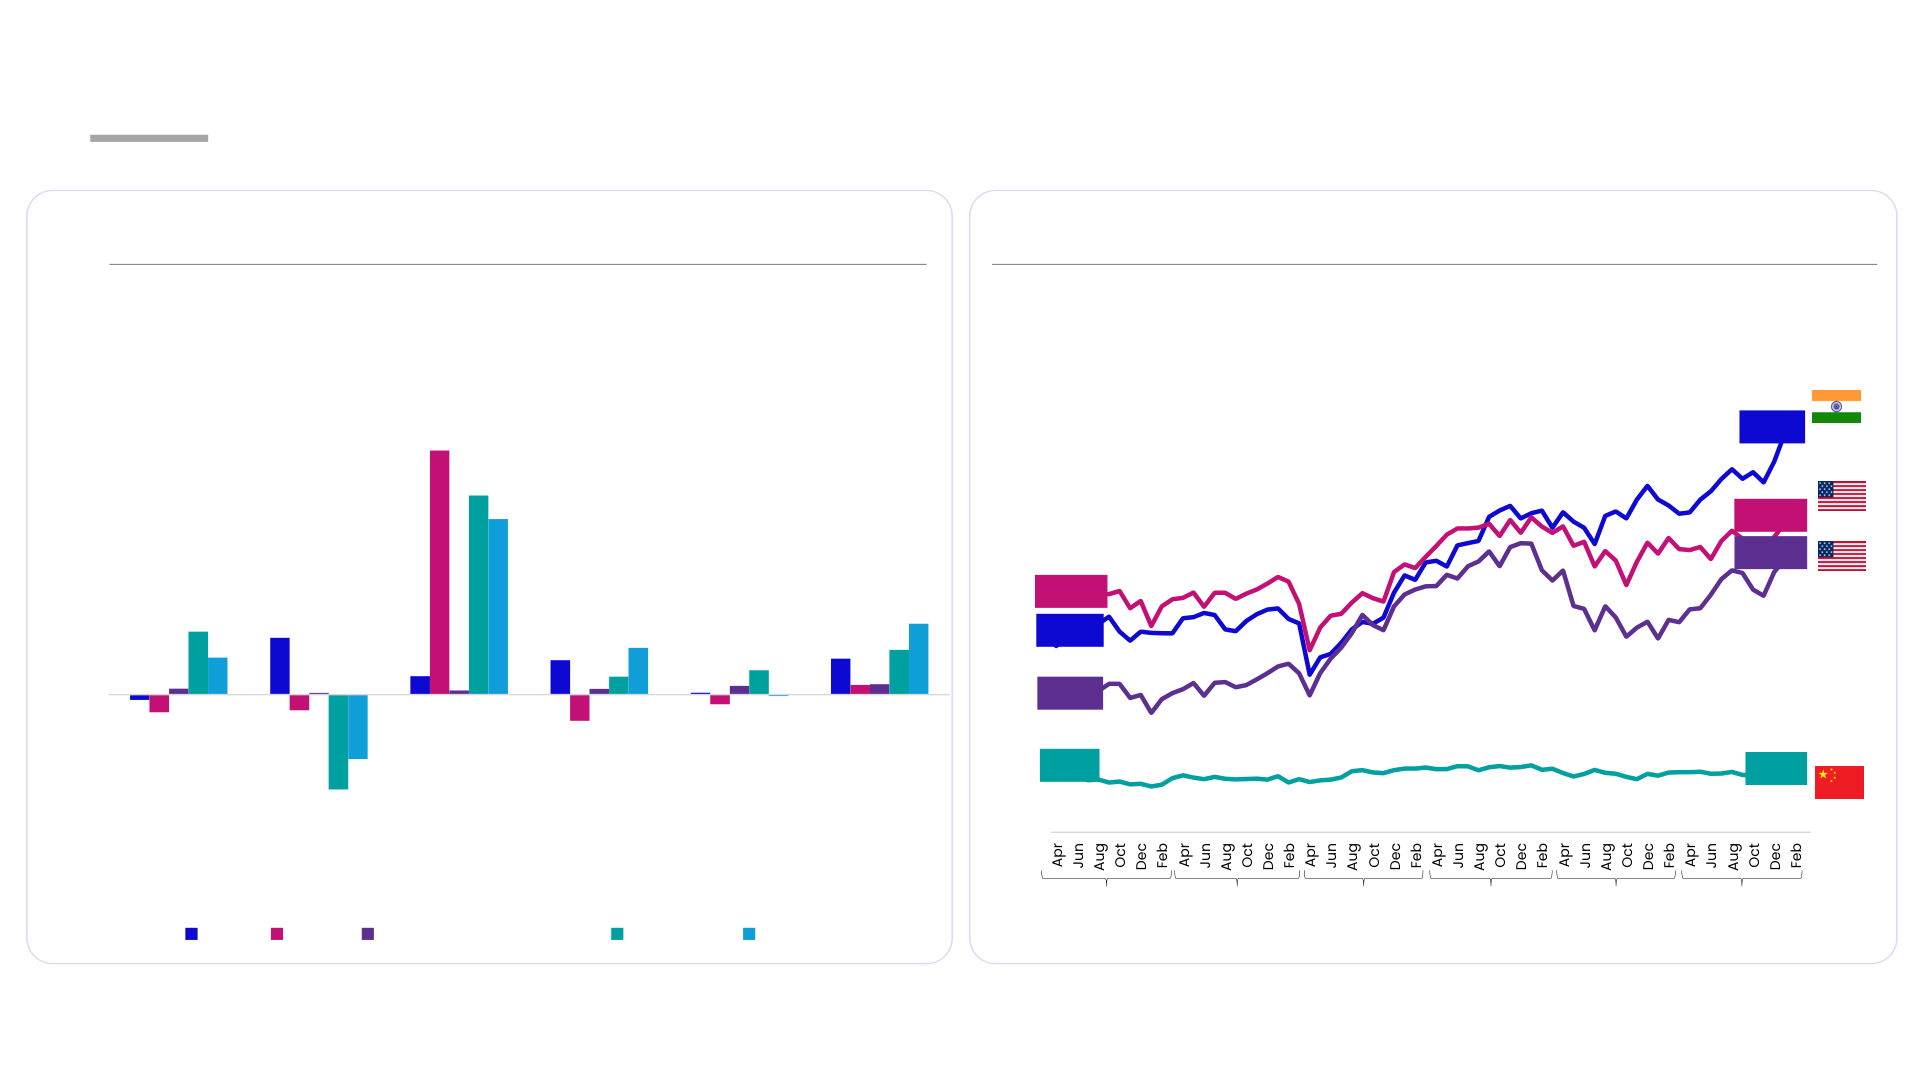
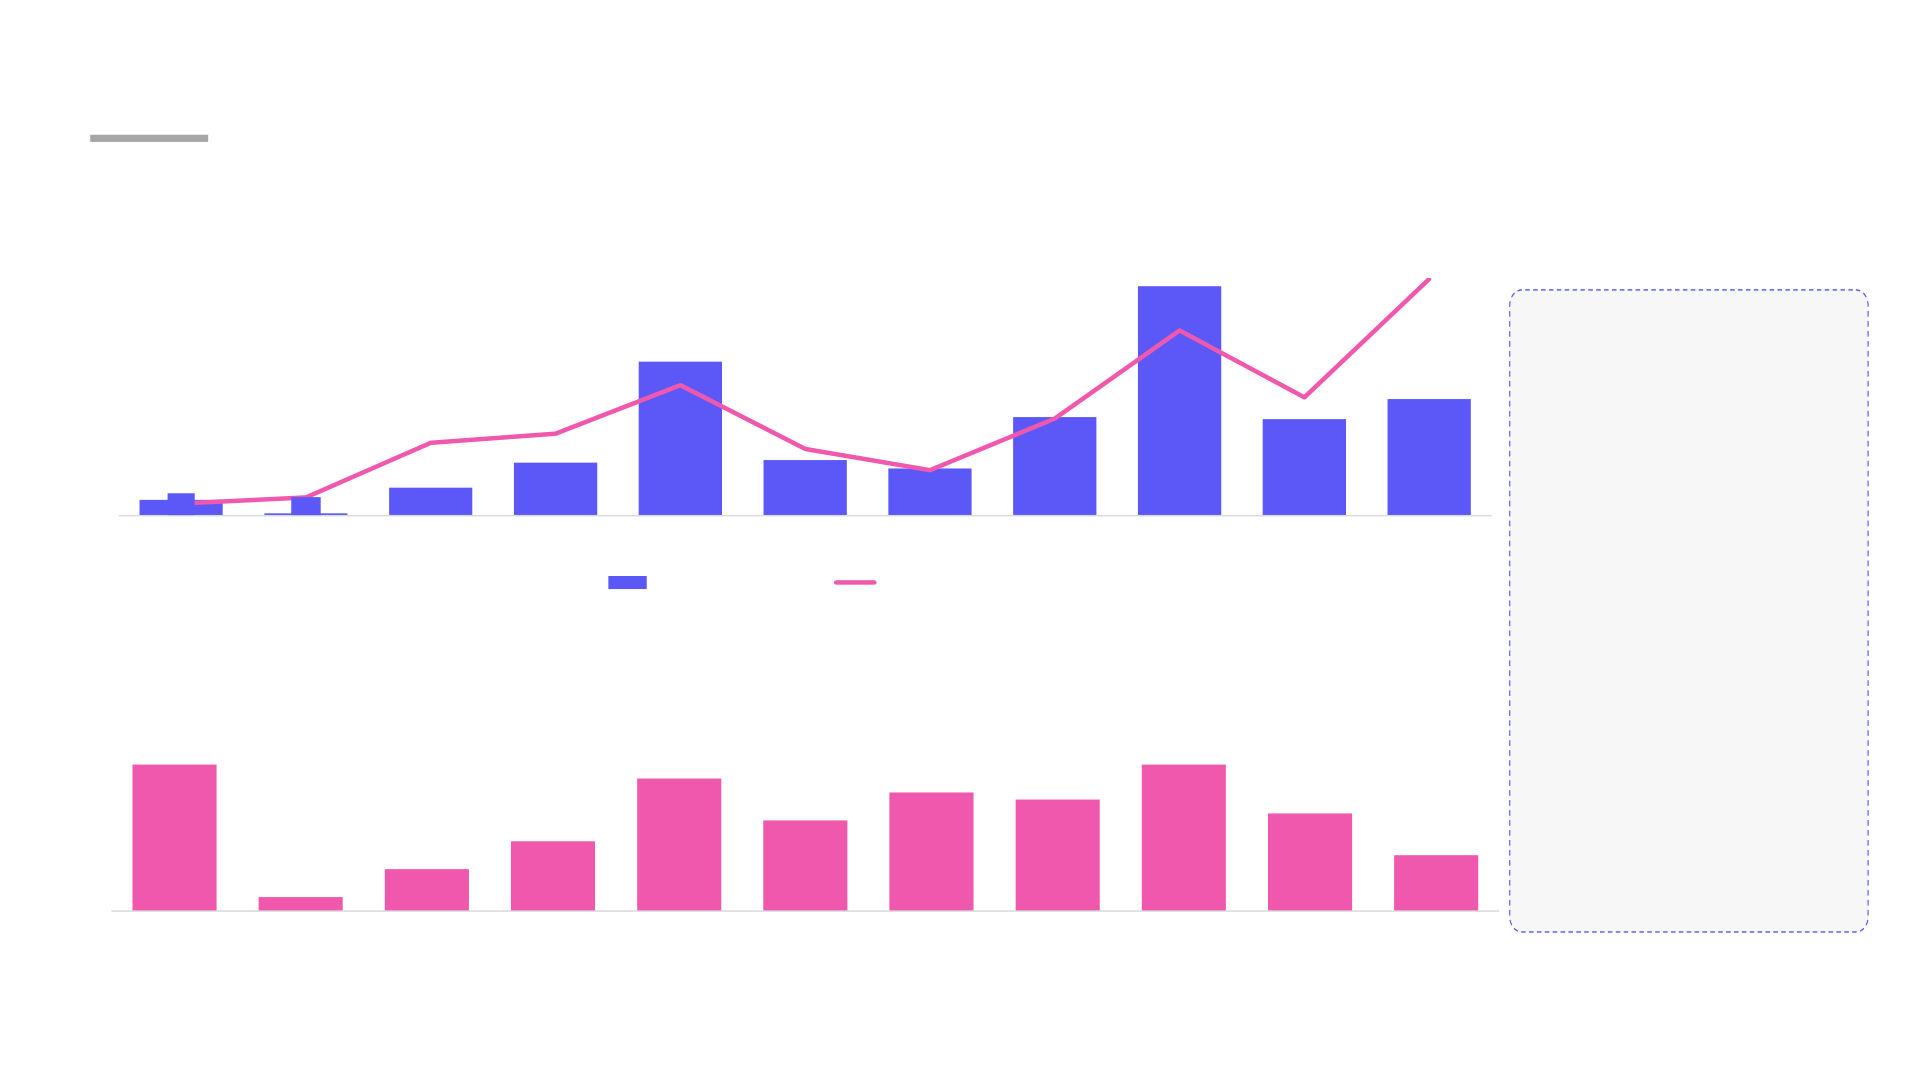
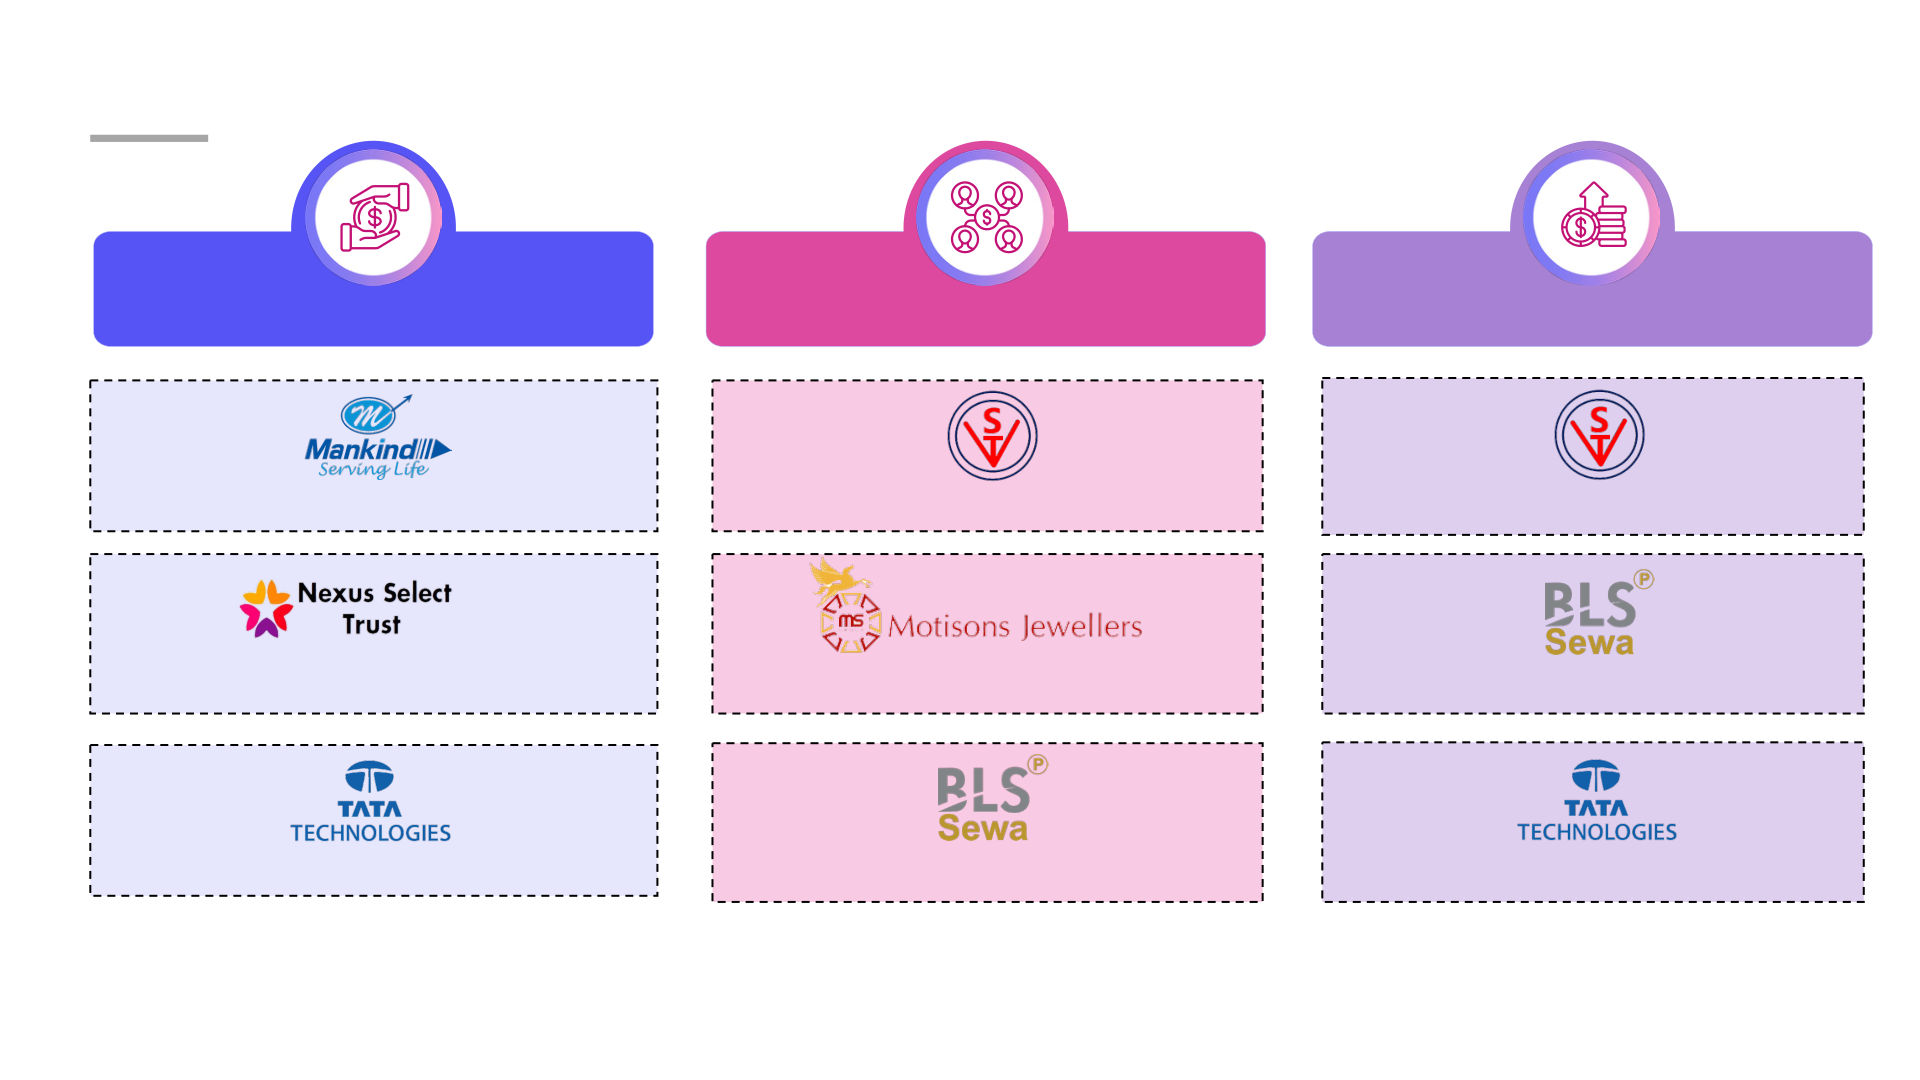
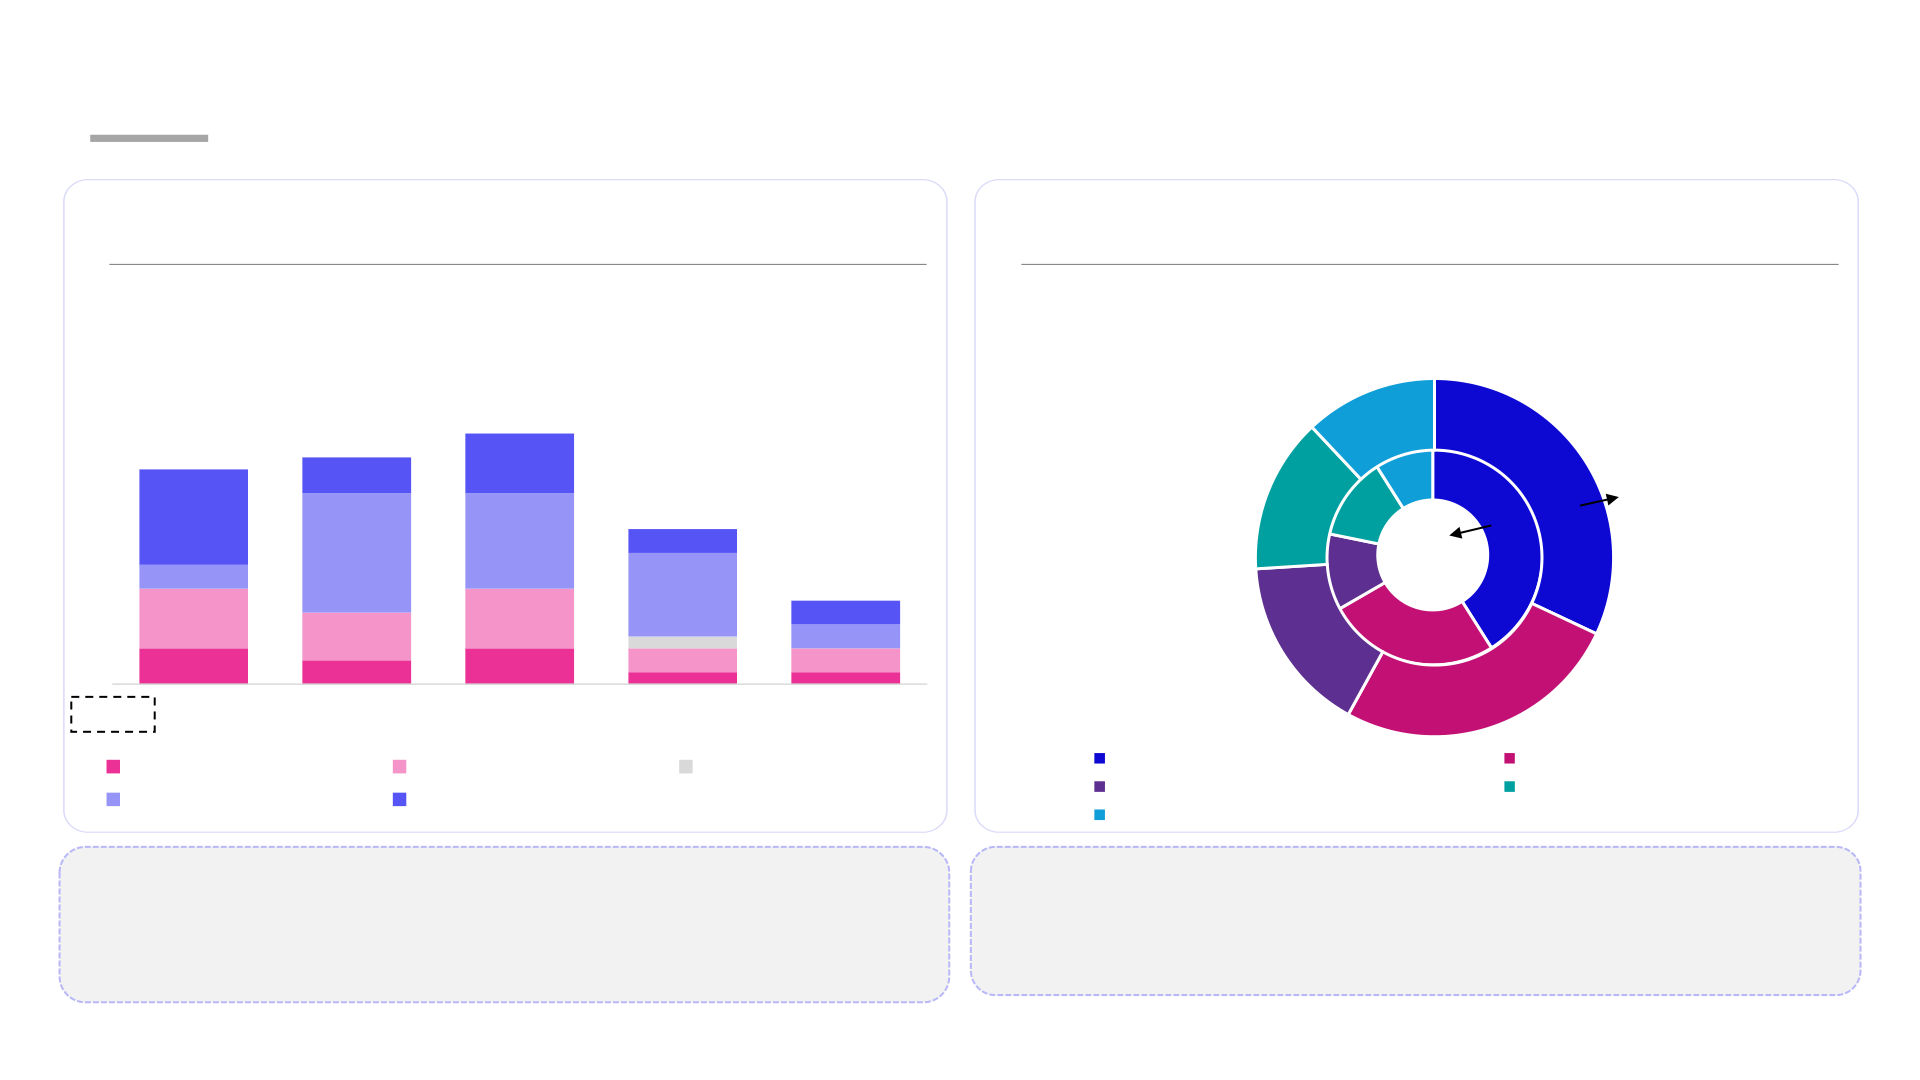
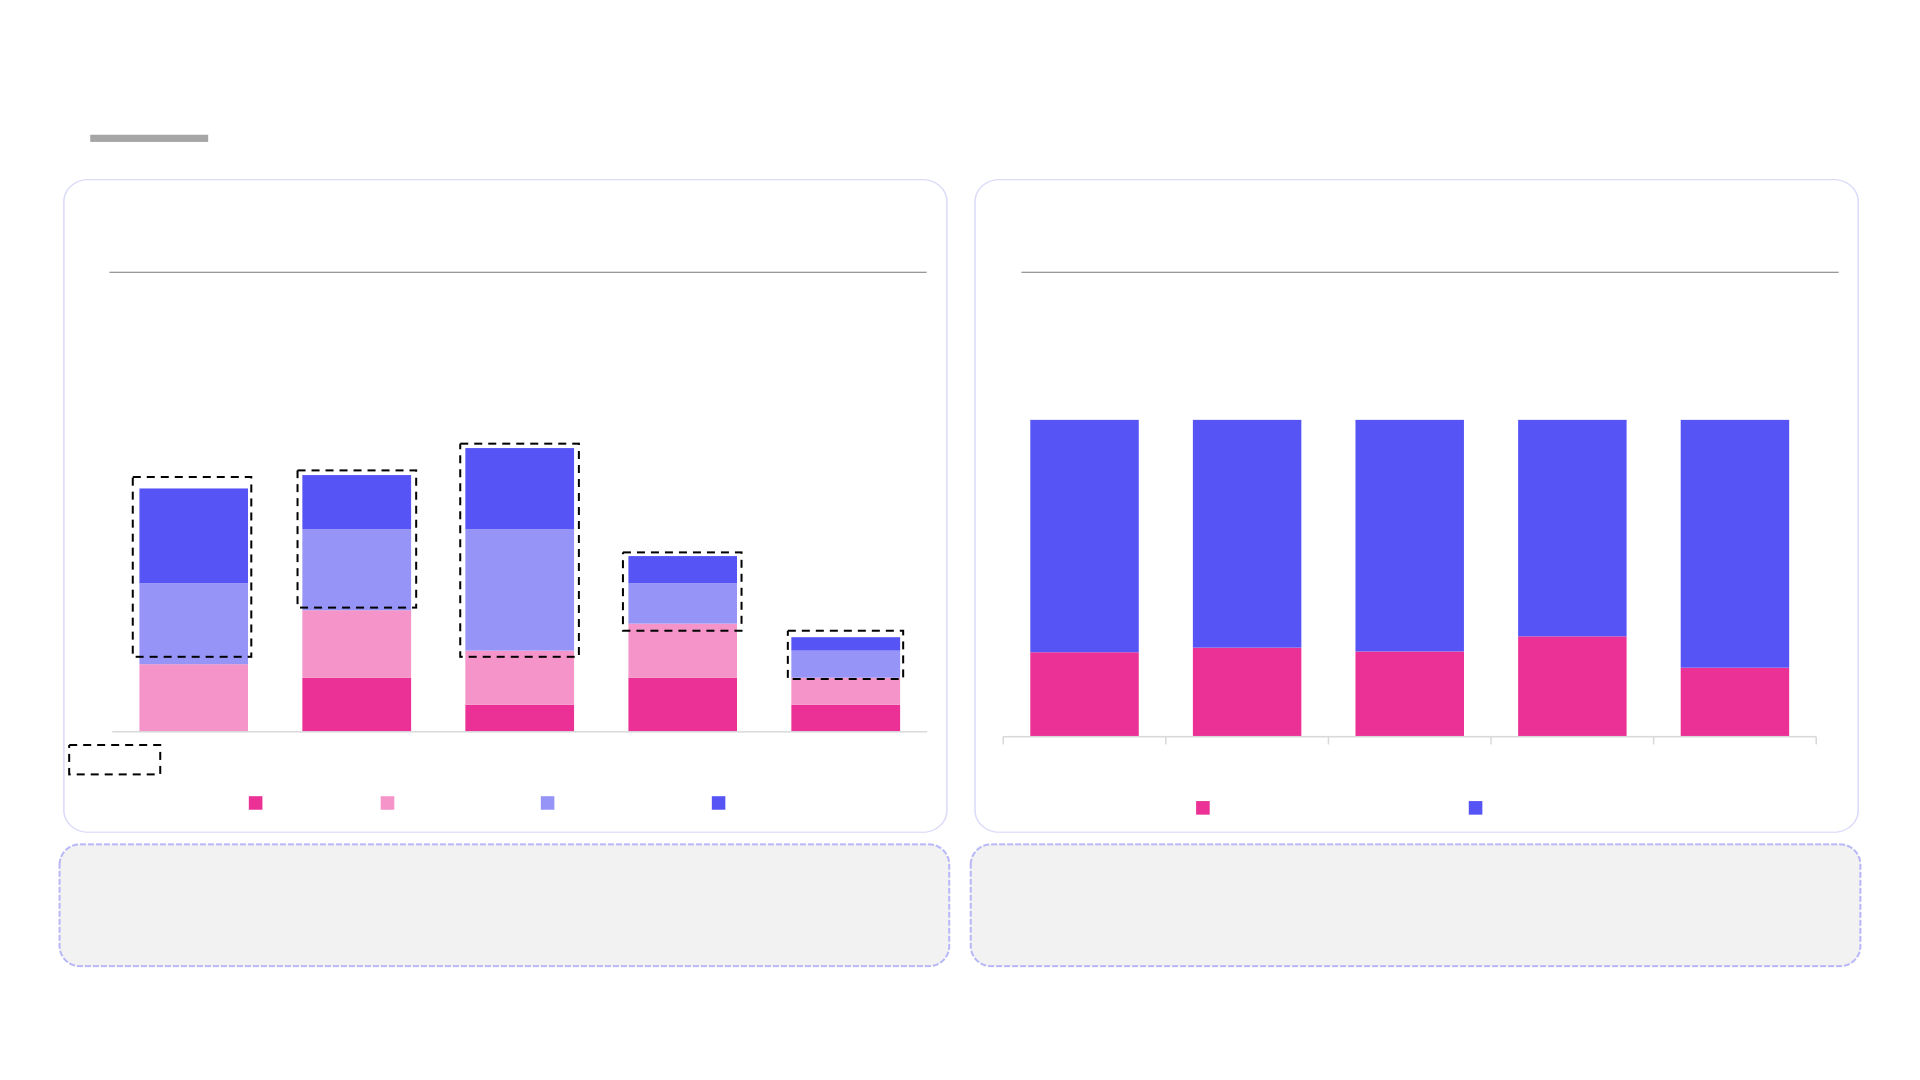
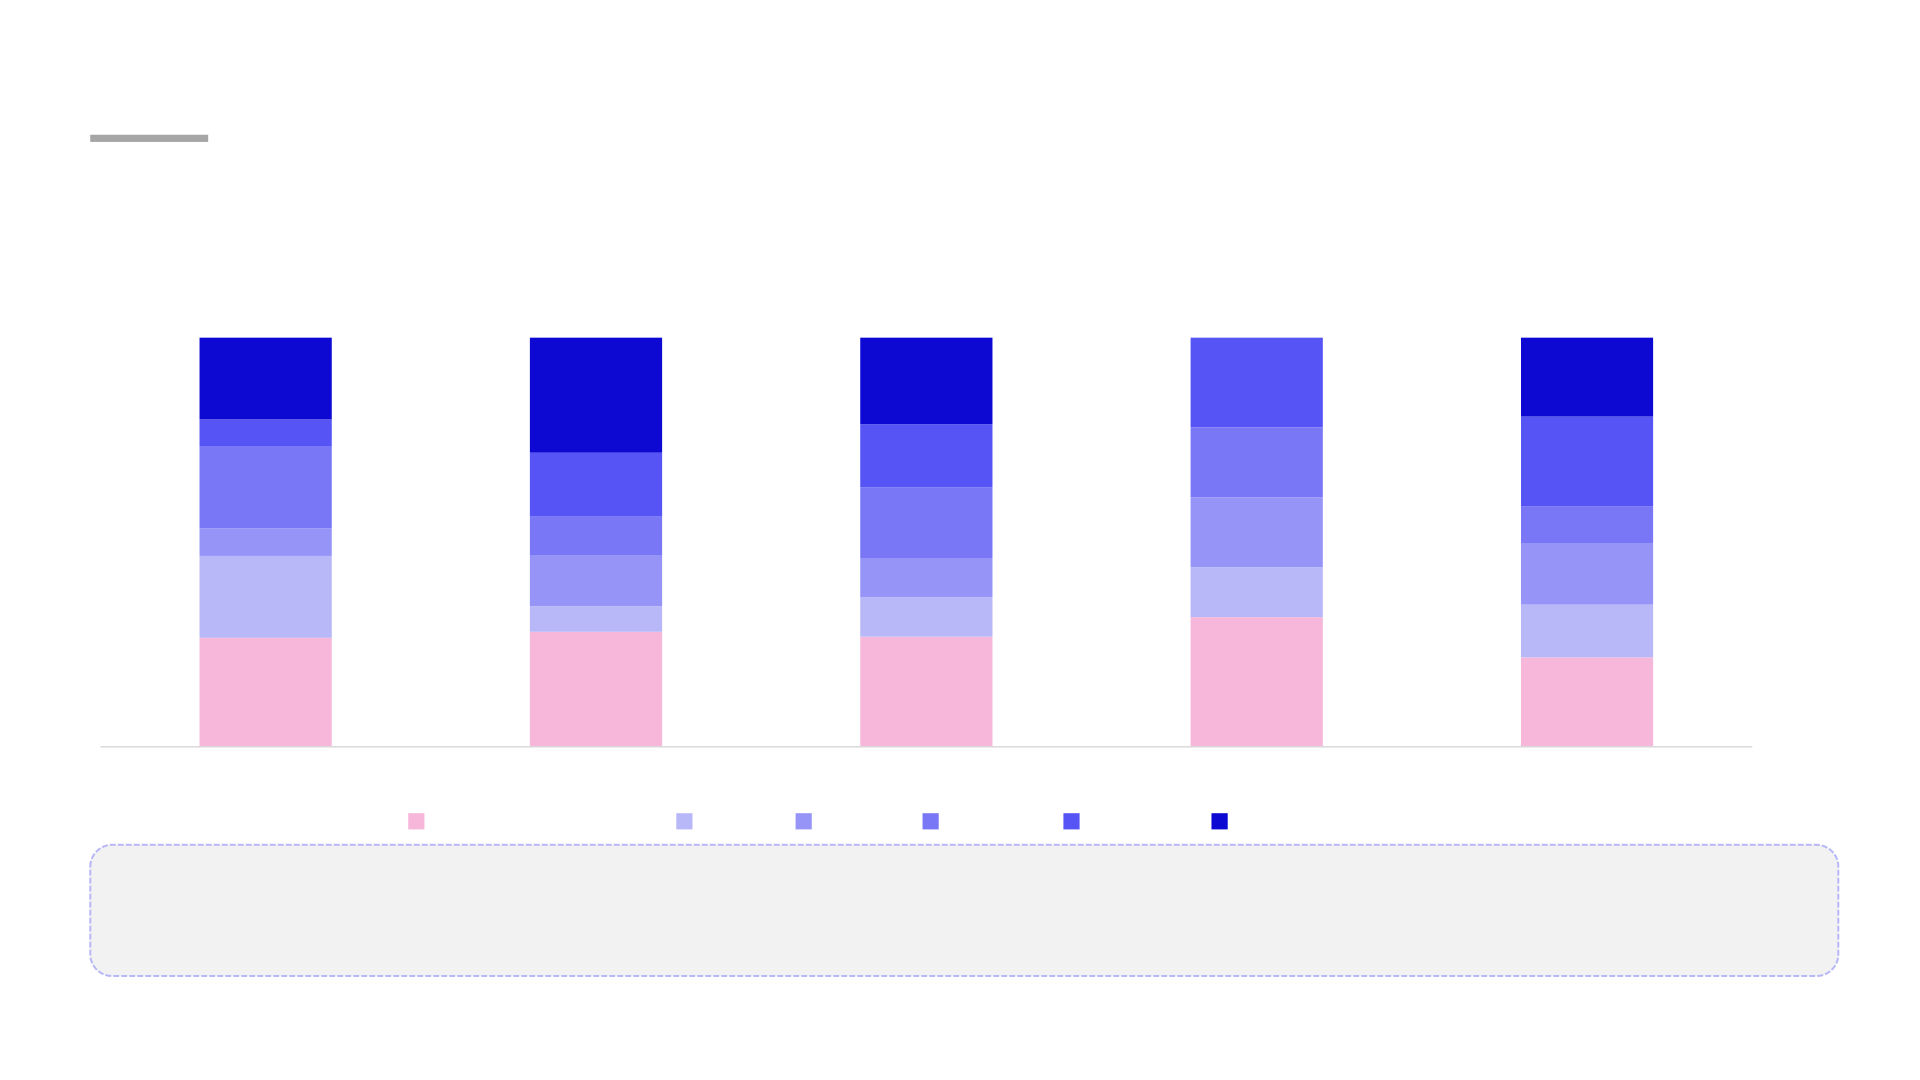
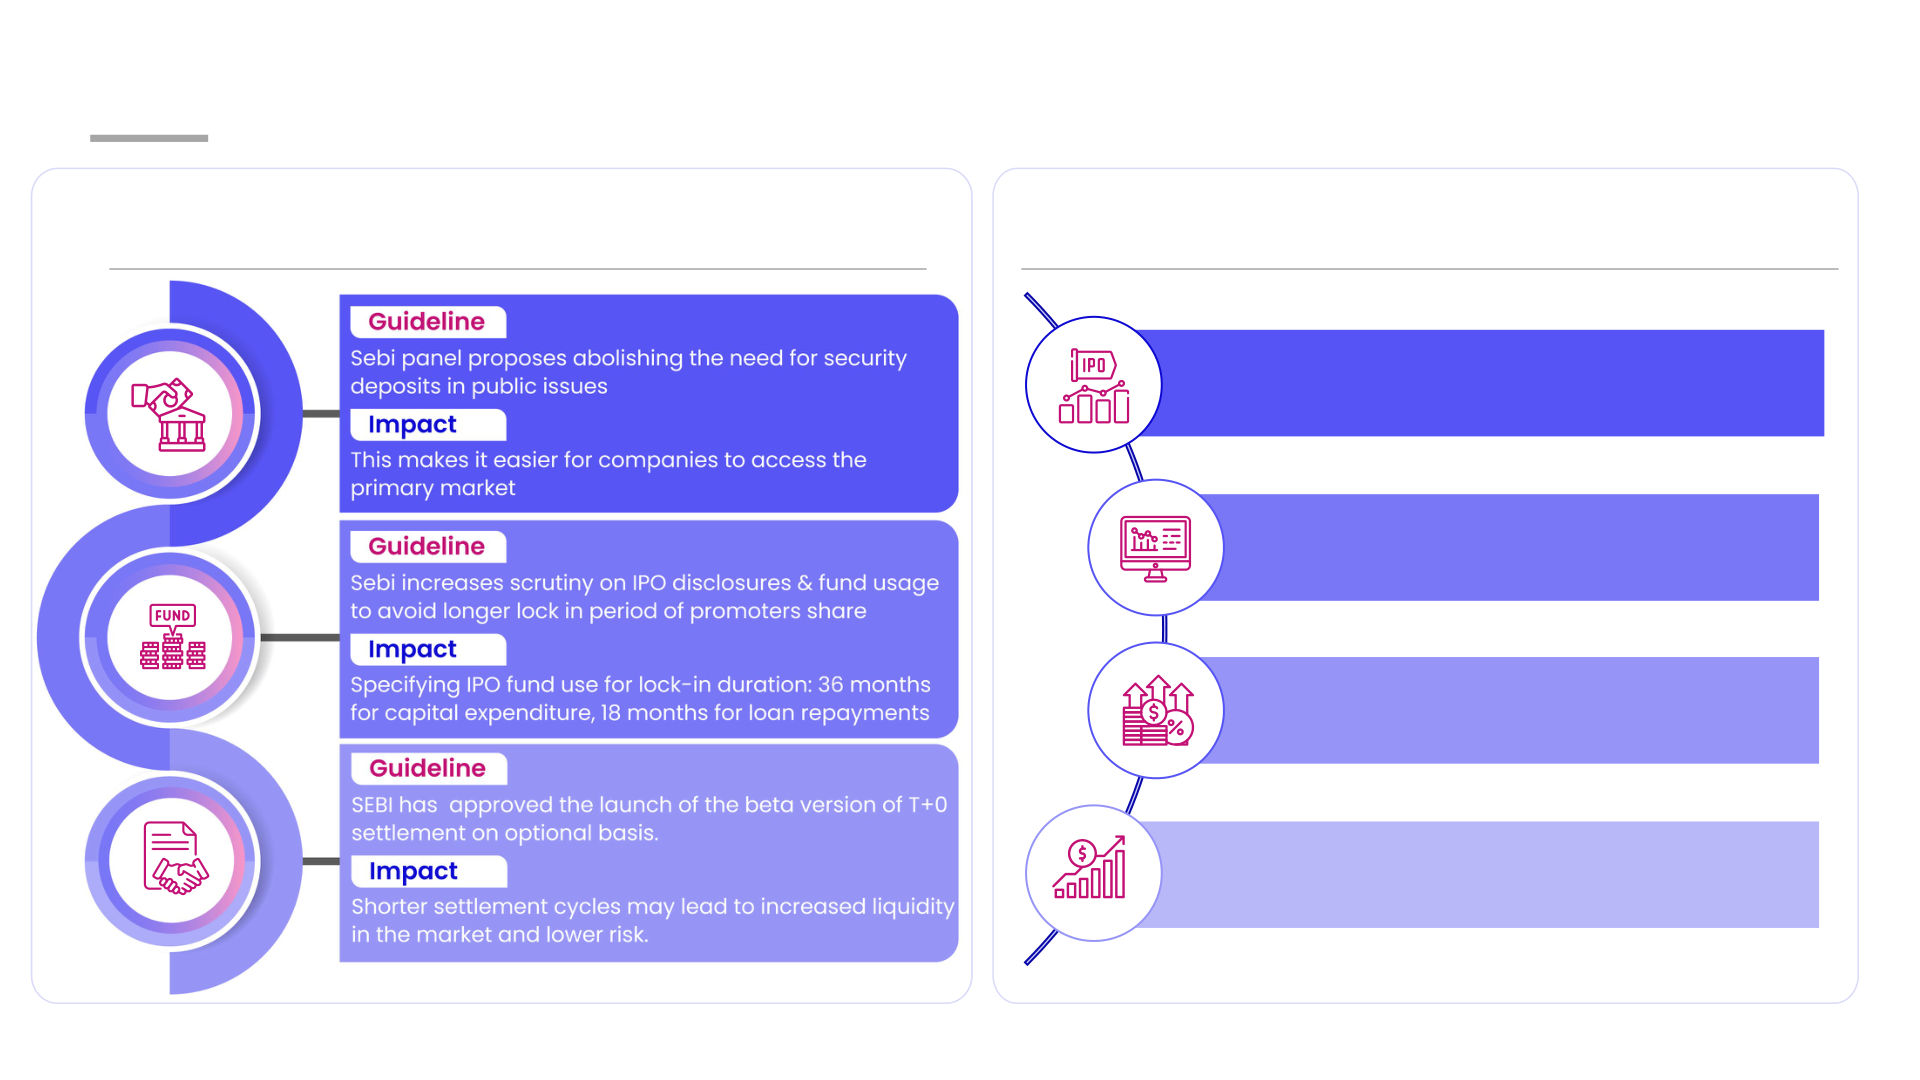
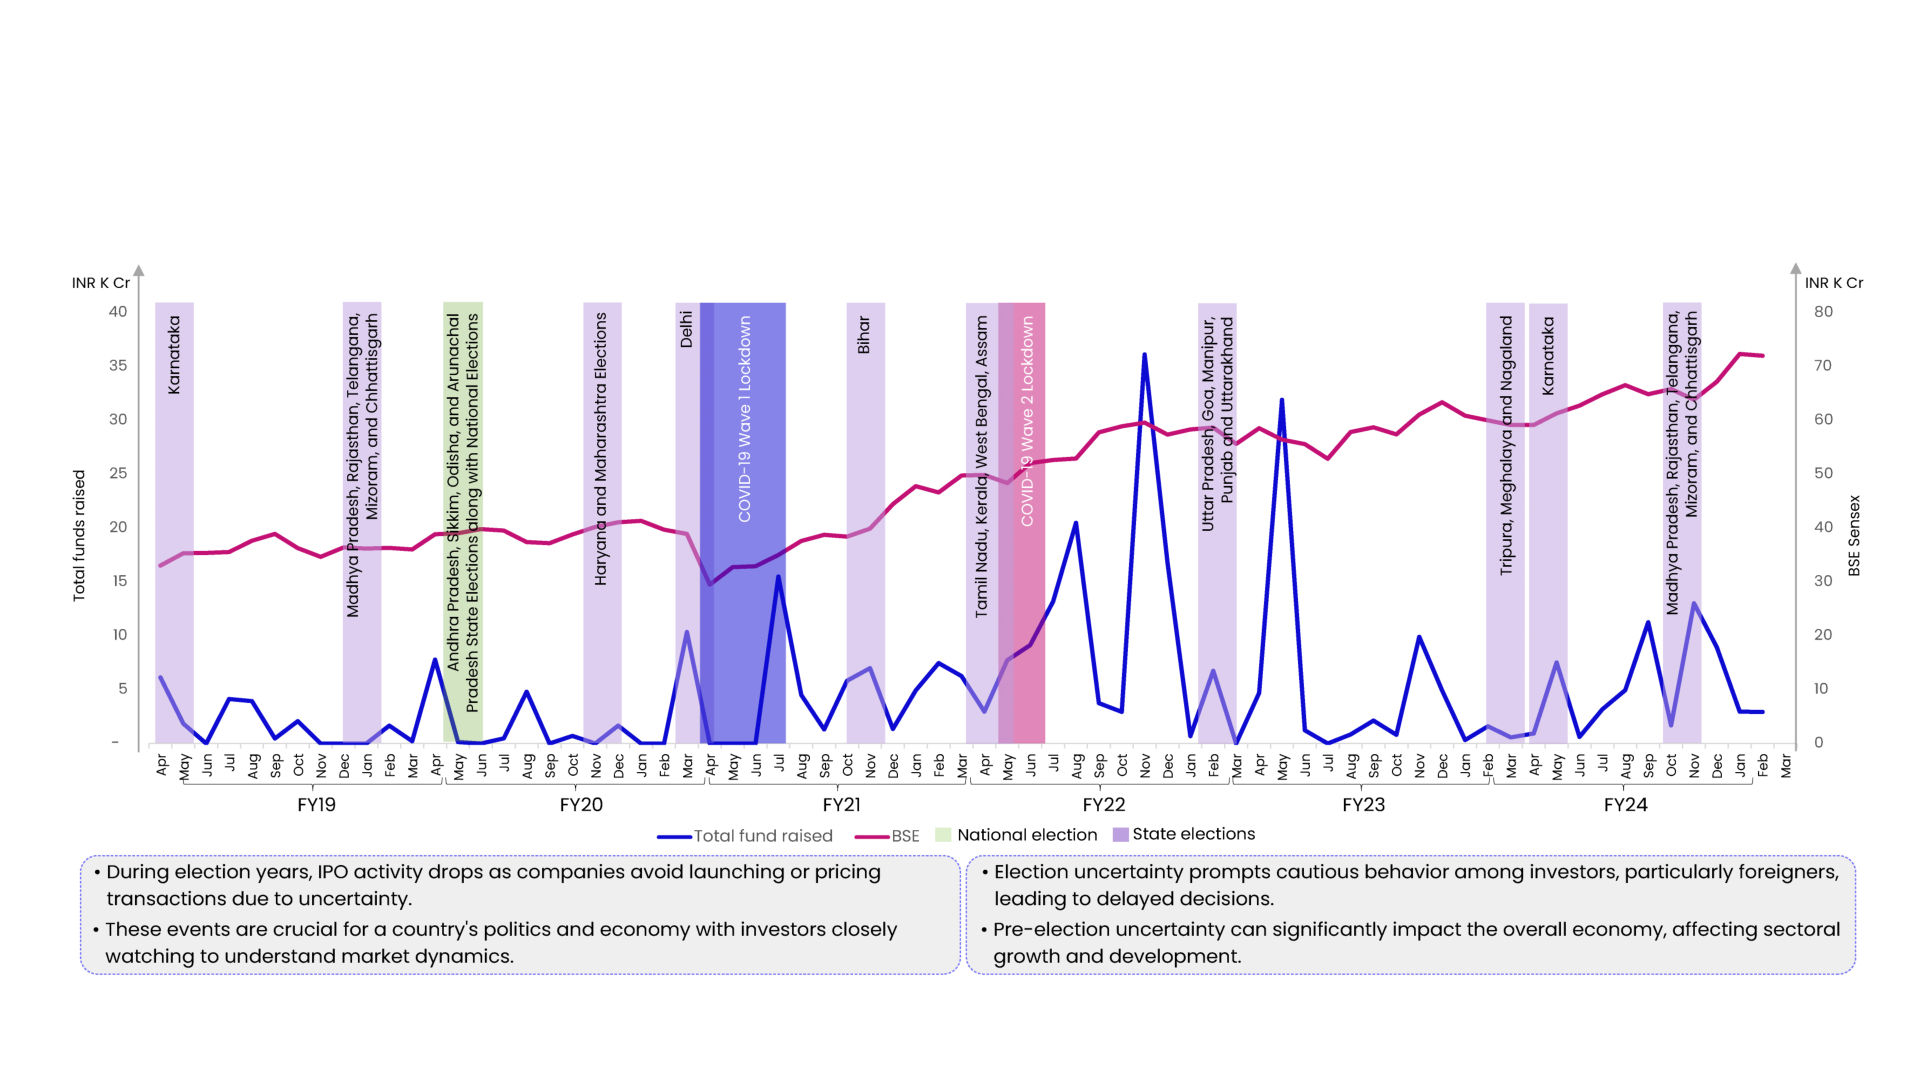
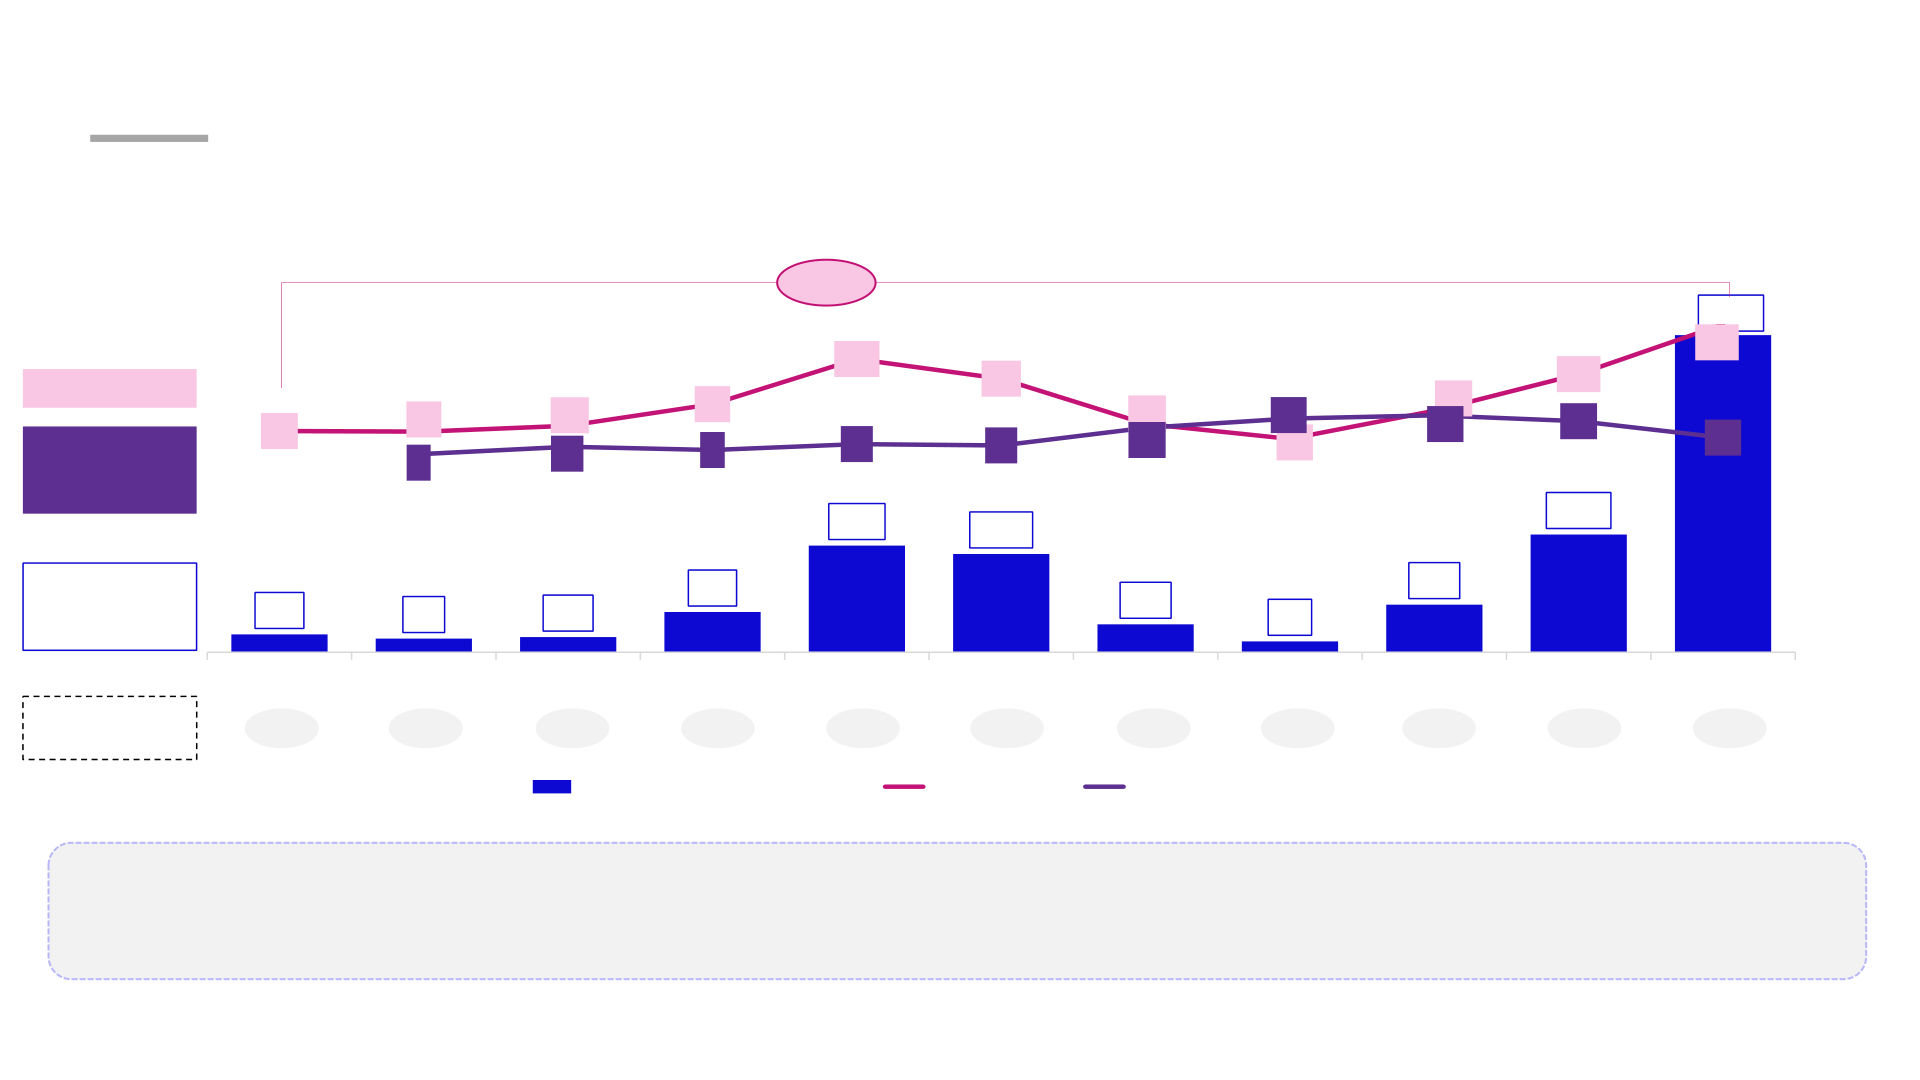
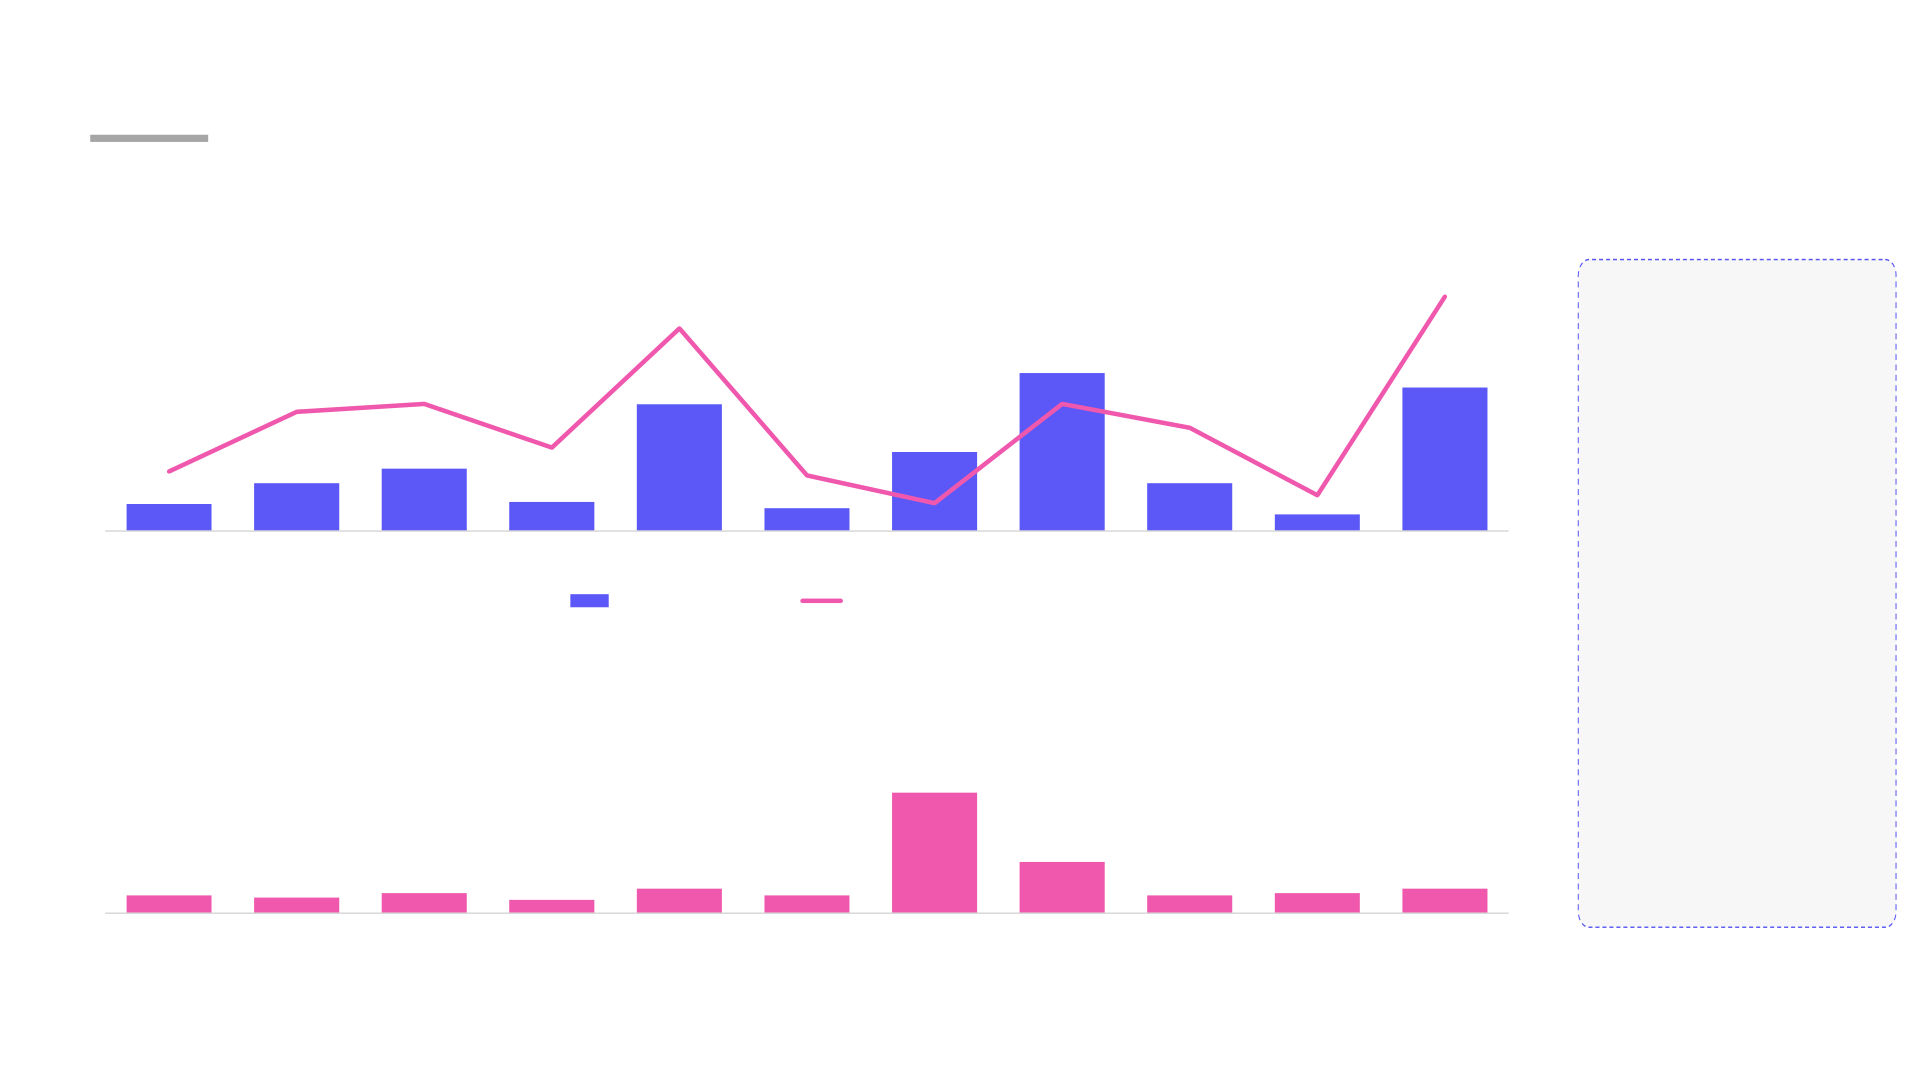
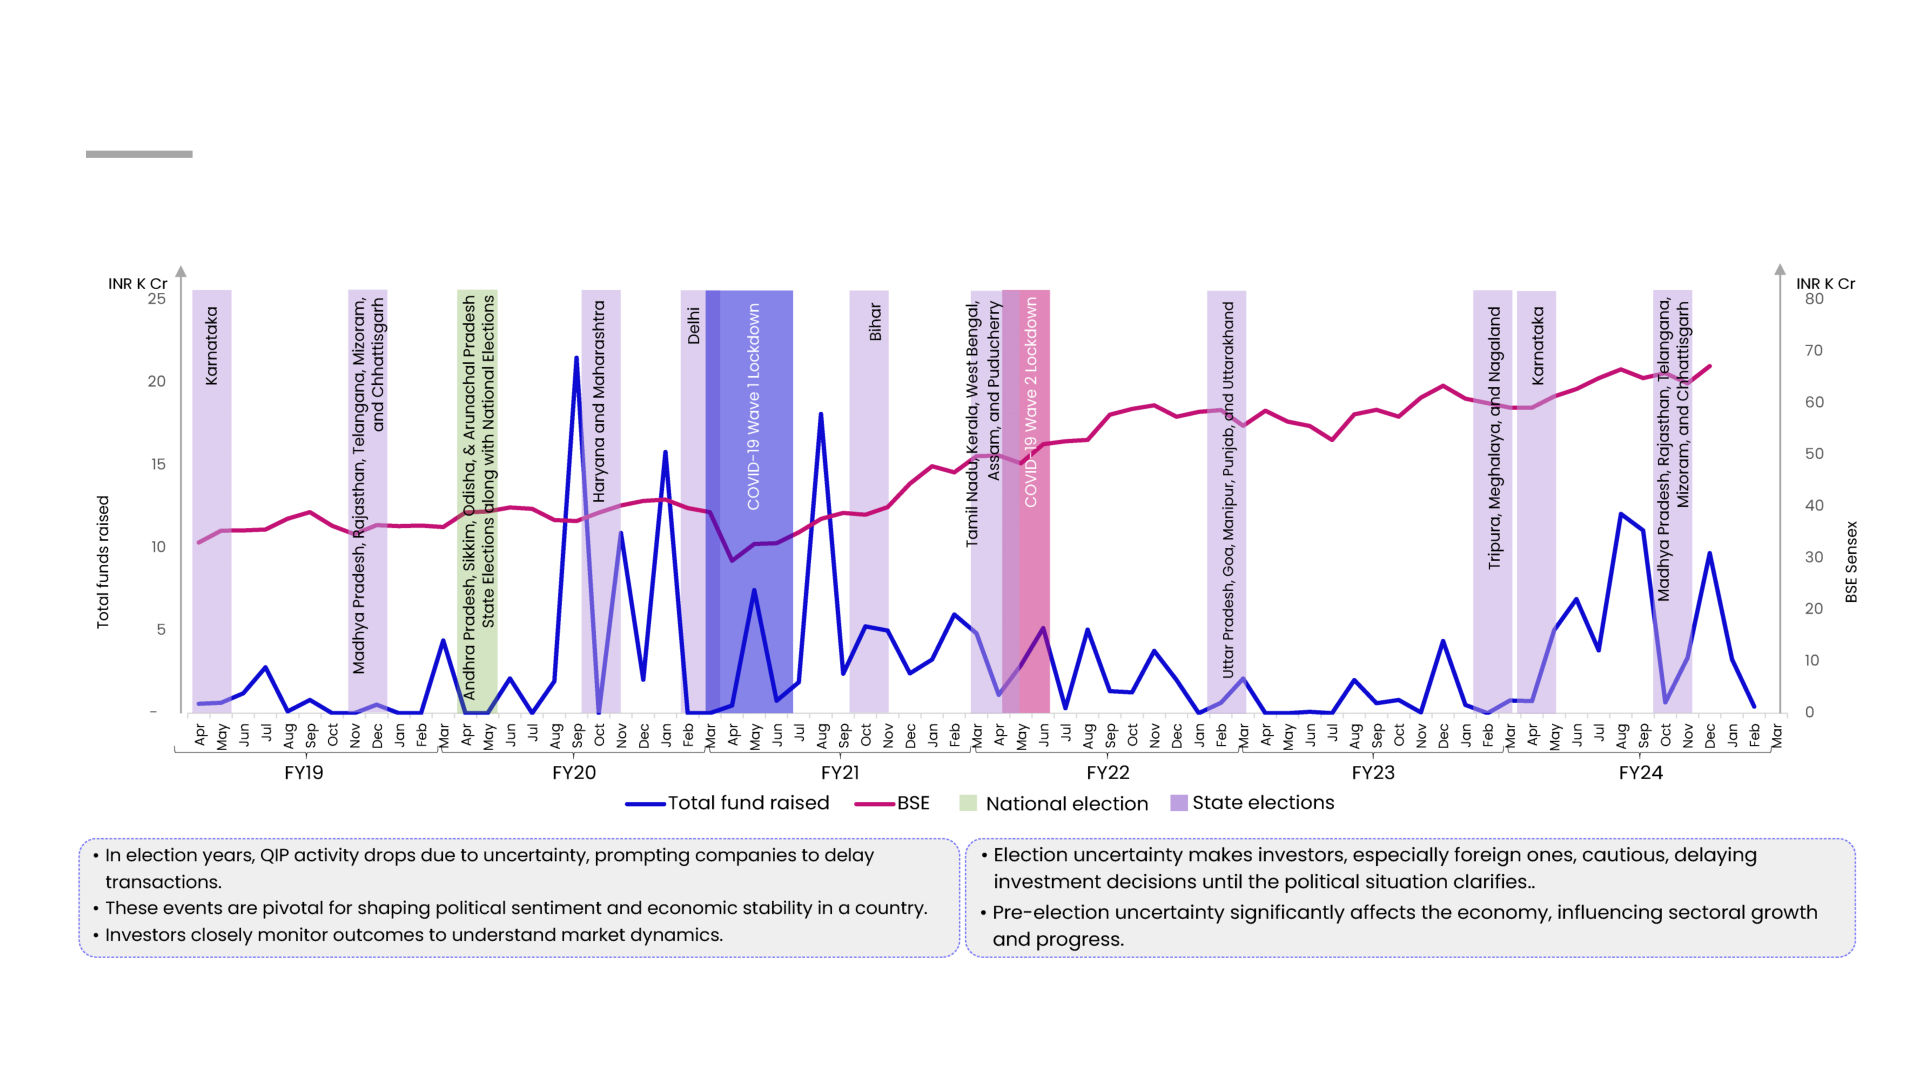
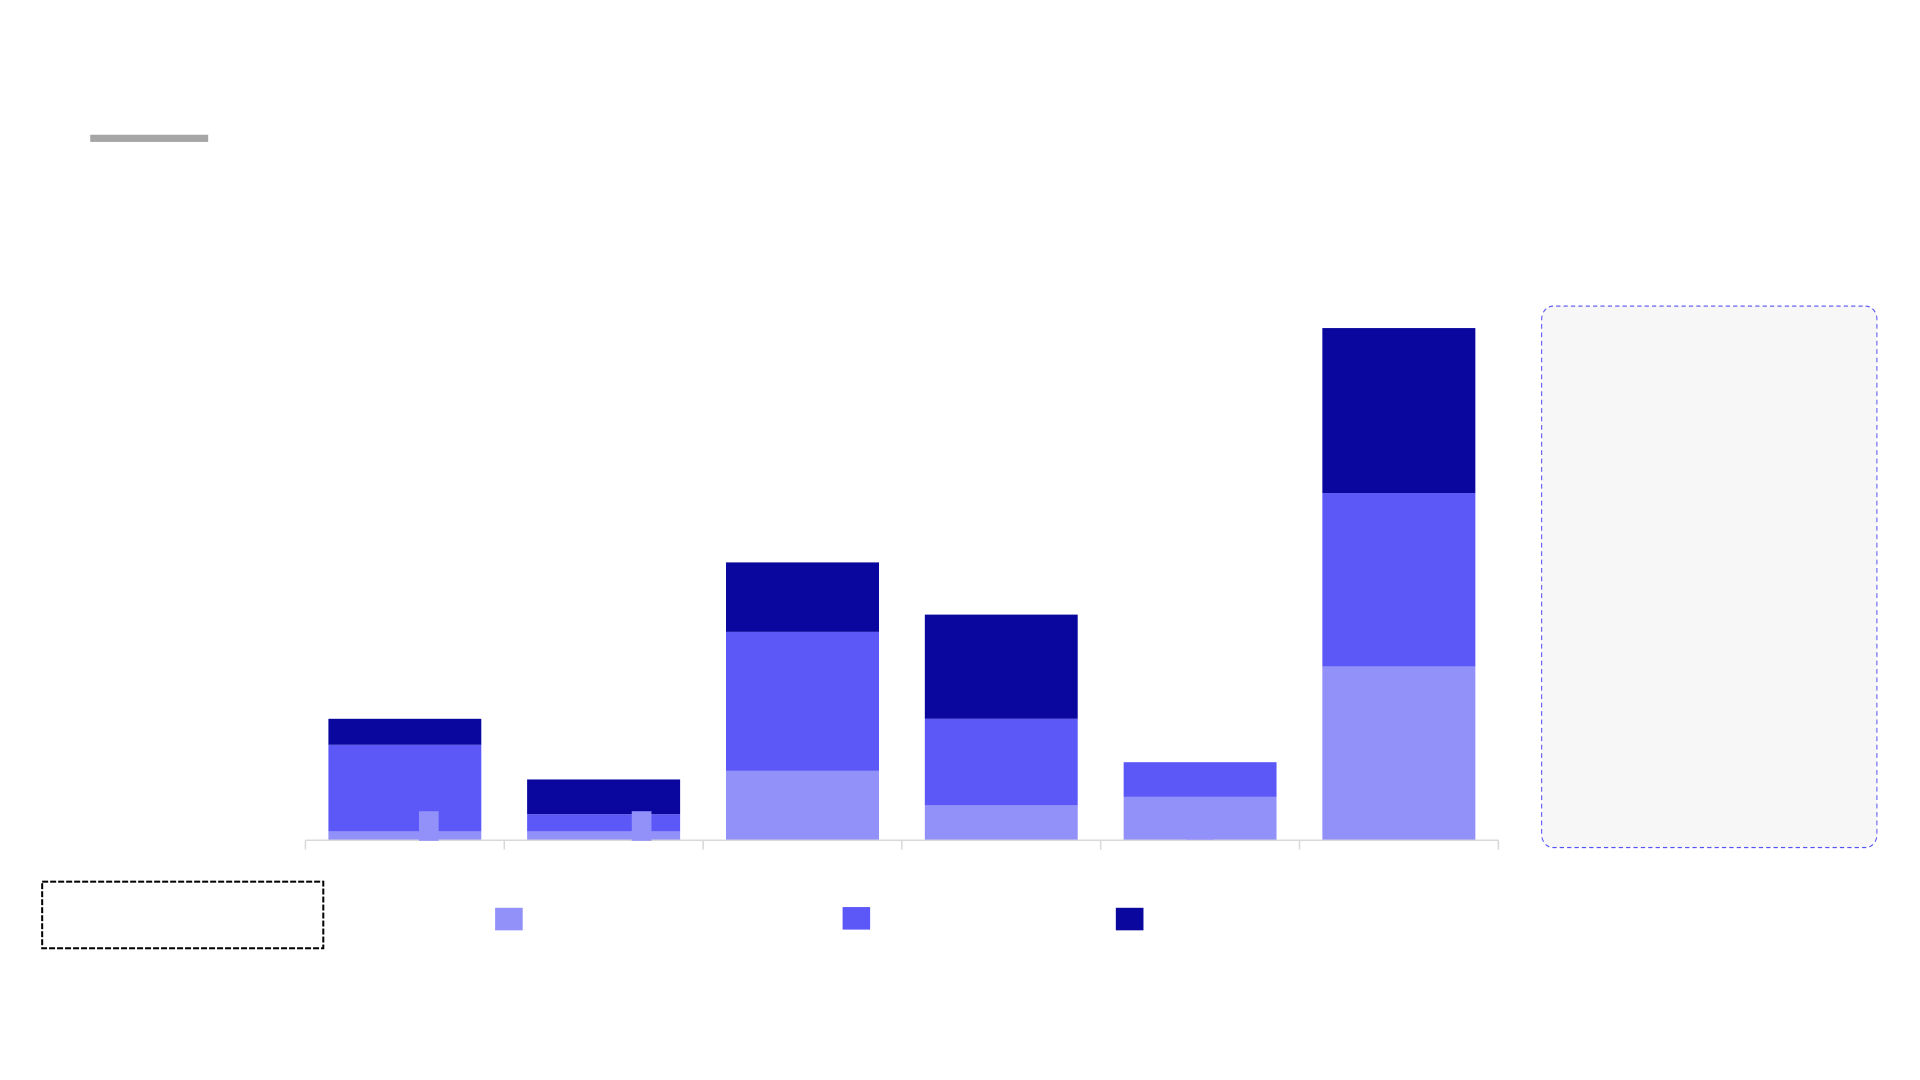
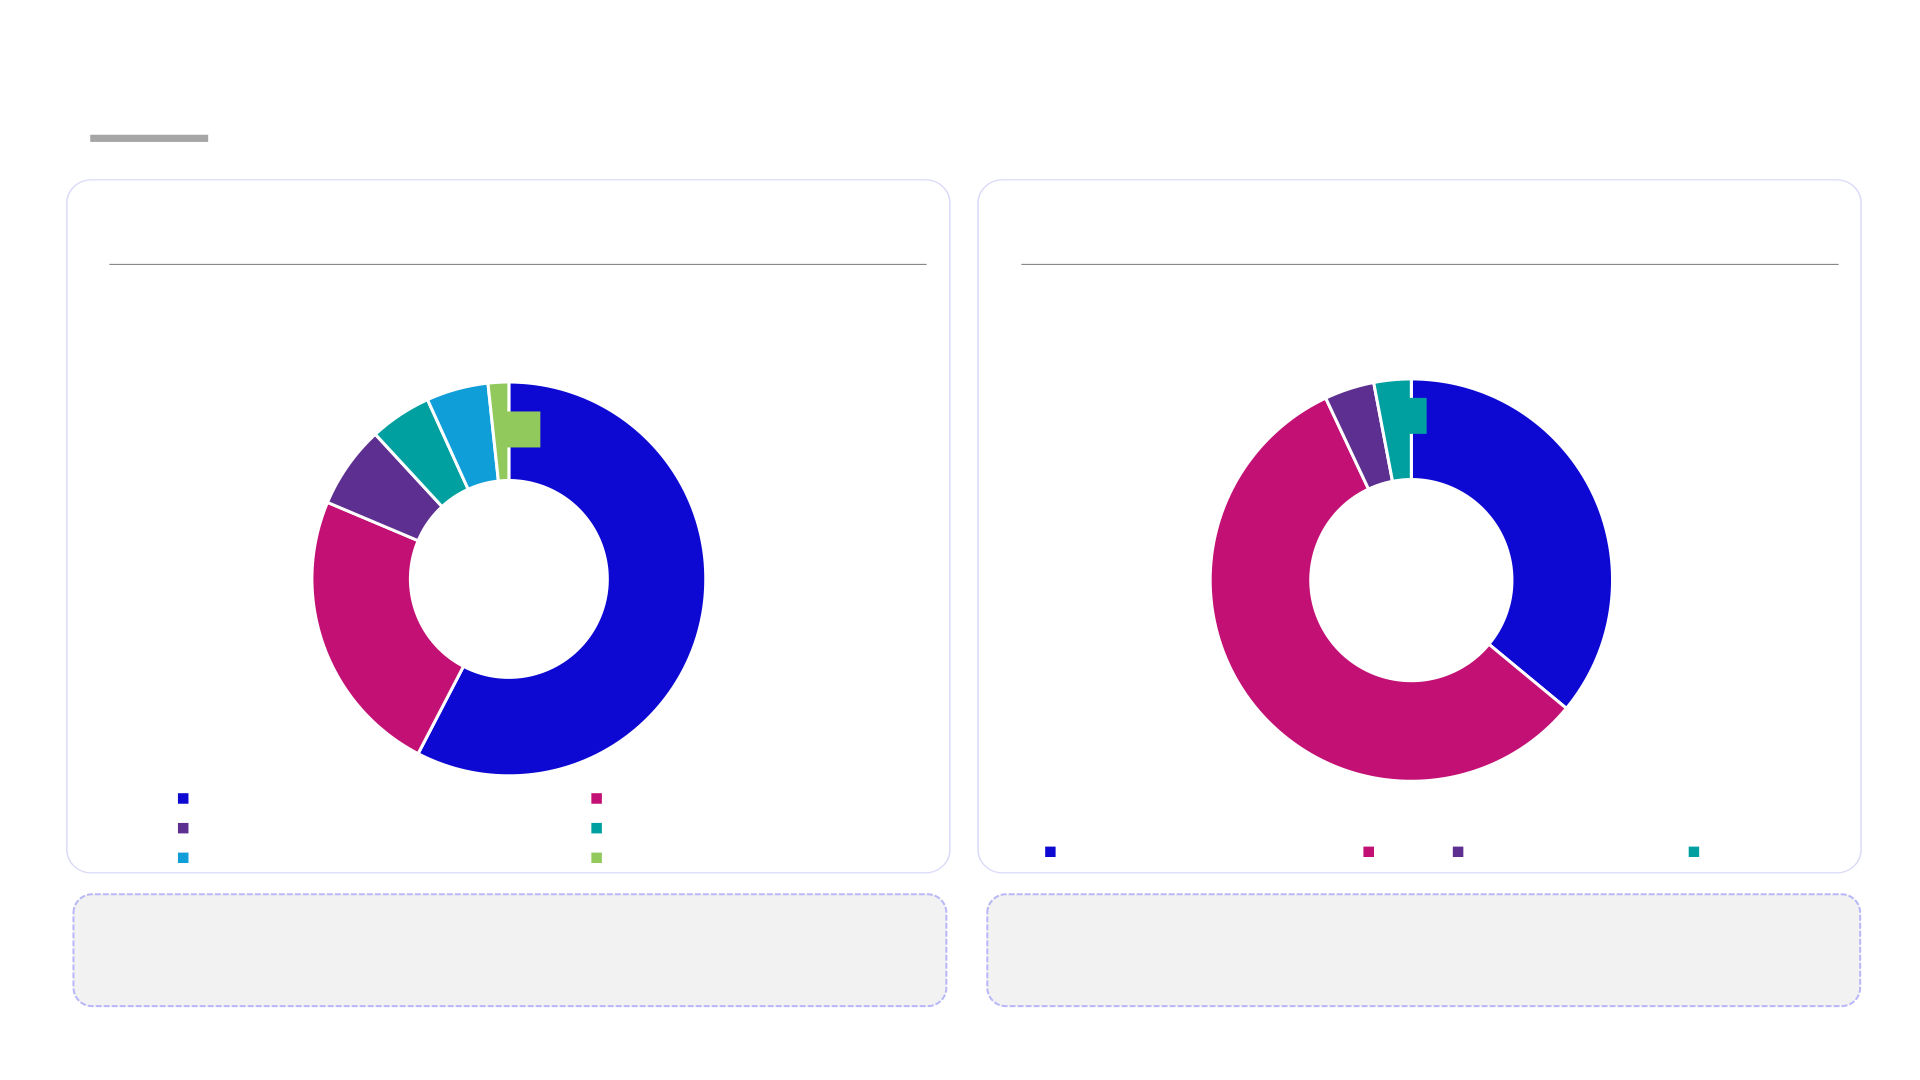
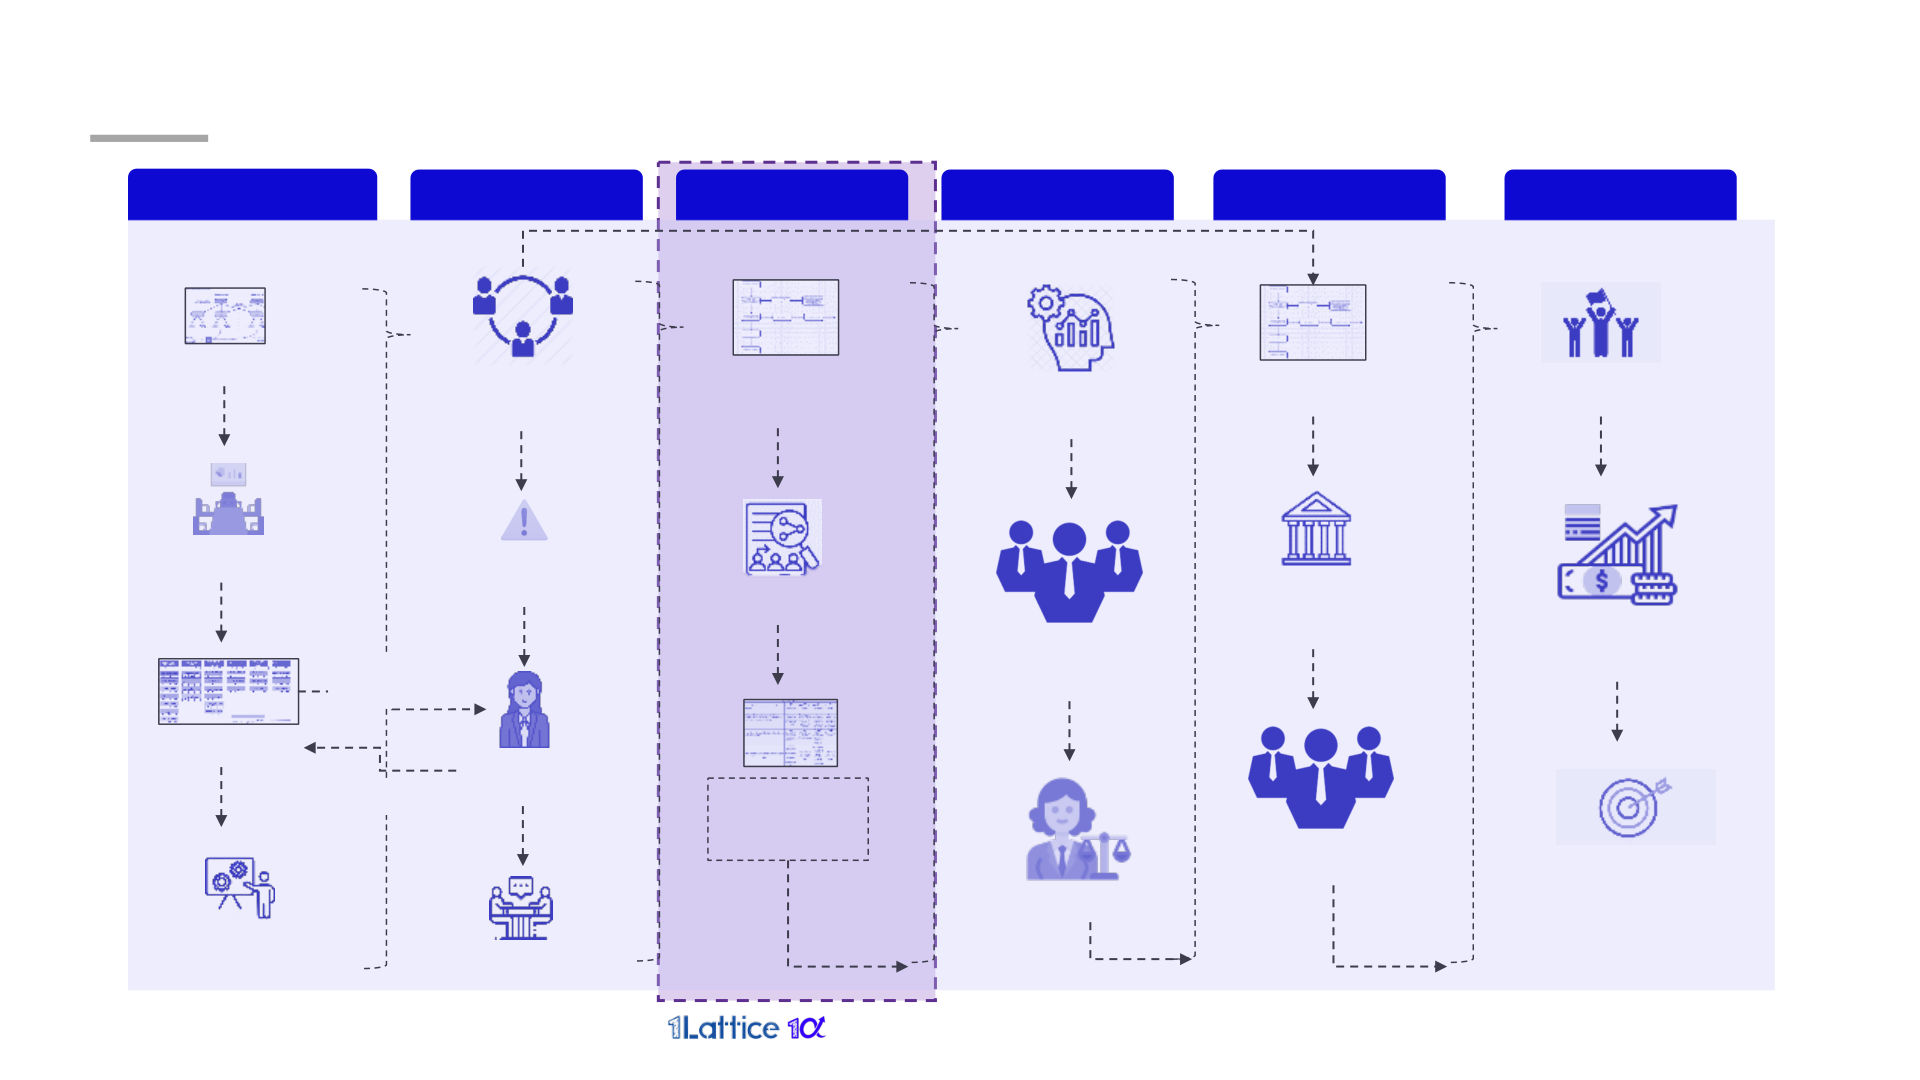
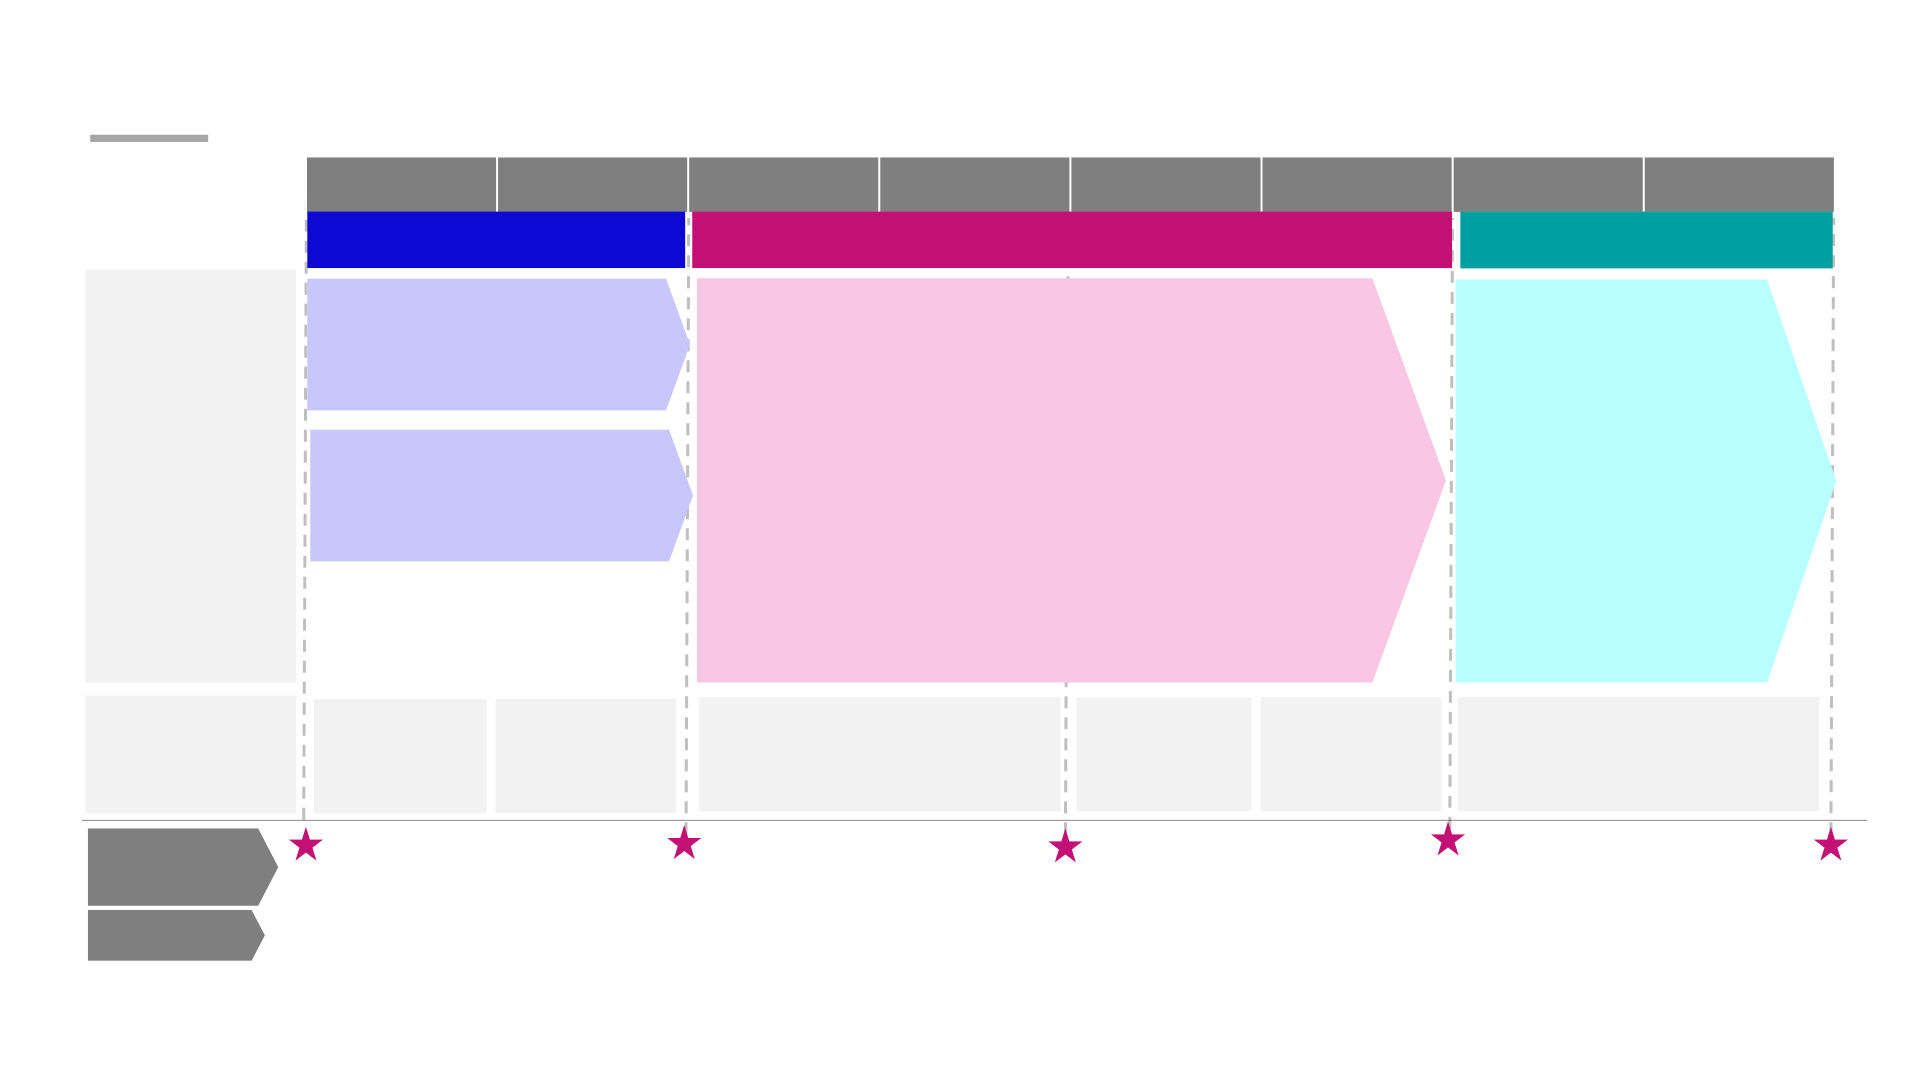
Performance analysis of Indian stock market across various asset classes and global markets Indian stock market outperformed various asset classes India charted new heights in the global stock market landscape Performance of different asset classes Stock market trends (%, FY19-24) (FY19-24) 25,000 21,781 99% NSE 100% 20,000 80% 71% 16,853 70% NYSE 15,254 15,000 12,490 NASDAQ 40% 29% 25% 23% 19% 10,152 18% 15% 15% 10,000 10% 14% 7% 7% 4.2% 10% 2.4% 3.5% 0.7% 4% 2.3% 1% 1.7% 7,054 -2% -1% -4% -6% -11% -7% 5,000 -20% SSE 3,170 2,773 -26% -38% -50% - FY19 FY20 FY21 FY22 FY23 FY24 FY19 FY20 FY21 FY22 FY23 FY24 Gold Silver U.S 10-Year Bond Yield* Nifty Bank Nifty 50 Note(s): *U.S 10-Year Bond Yield are based on the yield rate values as of the last trading day of March Source(s): Secondary research, 1Lattice analysis © 1Lattice | 4 rd FY24 ranked as the 3 highest in terms of issue size, while FY22 witnessed highest issue size in the last 10 years IPOs in last 10 years (INR K Cr, FY14-24) 78 61 60 • FY24 witnessed 78 IPOs 43 39 raising a total of ~INR 32 64KCr, averaging ~INR 27 24 22 866Cr per issue. 15 6 4 • FY23 and FY24 saw a shift 126 64 29 85 31 26 54 53 15 towards smaller issuances, 9 1 indicating a more FY14 FY15 FY16 FY17 FY18 FY19 FY20 FY21 FY22 FY23 FY24 diversified range of Total Issue Size No. of IPOs offerings compared to the past three years. Average Issue Size • FY21 and FY22 featured mega IPOs like One 97 (INR K Cr, FY14-24) Communications, Zomato, 2.1 2.1 and LIC, with issue sizes of 1.9 1.7 ~INR 18.3K Cr, ~INR 9.3K Cr, 1.6 1.4 1.3 and ~INR 21K Cr 1.0 respectively, contributing to 0.8 0.6 higher average issue sizes and total funding. 0.2 FY14 FY15 FY16 FY17 FY18 FY19 FY20 FY21 FY22 FY23 FY24 Source(s): Secondary research, 1Lattice analysis © 1Lattice | 5 IPO FY24 Snapshot: Unveiling the top performers in India’s public market debut Issue Size Subscription status Listing gains Highest issue size of INR 4,326Cr Highest overall subscription at 320x Achieved remarkable listing gains of 193% Second highest issue size of INR 3,200Cr Second highest overall subscription at 173x Achieved second highest listing gains of 175% Third highest issue size of INR 3,043Cr Third highest overall subscription at 162x Achieved third highest listing gains of 163% Source(s): Secondary research, 1Lattice analysis © 1Lattice | 6 ~25% of the IPOs had their entire issue size as fresh issues; Industrial goods and services raised the most funds in FY24 Most companies allocated over 50% of their issue size to fresh issues Industrial goods & services recorded highest no. of listings (~30%) rather than Offer for Sale(OFS) and issue size (~40%) followed by consumer & retail OFS & Fresh Issue Funds Vs Revenue Sector-wise IPO analysis (#, FY24) (%, FY24) 21 12% 19 18 5 3 9% 32% Issue Size 13 14% 13% 8 41% 8 2 No. of IPOs 10 12% 7 2 7 2 5 5 16% 4 2 26% 1 2 2 3 3 2 1 1 26% INR Cr < 250 250-500 500-1,000 1,000-3,000 > 3,000 Industrial Goods & Services Consumer & Retail 100% OFS > 50% OFS = 50% OFS & Fresh Issue Healthcare BFSI > 50% Fresh Issue 100% Fresh Issue Tech & Internet • Industrial goods & services raised ~INR 22K Cr, experiencing the highest listing gains • IPOs with revenue between INR 500-1,000Cr saw maximum 50% fresh issues, at 193%. including 5 IPOs with solely fresh shares. th • Tech & internet, consumer retail, and healthcare sectors saw increased IPO • JSW Infrastructure had the 4 largest issue size of INR 2,800Cr, with the entire numbers in recent years, but FY24 featured smaller issuances. amount as fresh shares. Source(s); Secondary research, 1Lattice analysis © 1Lattice | 7 In FY24, ~60% IPOs witnessed >25x subscription; 78% of IPOs experienced positive listings Out of 78 companies, 20 saw companies witnessed subscription Proportion of negative listings has remained relatively constant status more than 75x (~30%), but decreased by ~10% in FY24 as compared to FY23 Listing day gains over past 5 years IPO Subscription across various revenue ranges (%, FY20-24) (x, FY24) 15 32 52 41 78 21 19 18 6 4 13 68% 72% 7 73% 73% 78% 6 2 9 3 7 6 5 1 4 2 4 32% 2 28% 27% 27% 5 22% 4 4 2 2 INR Cr < 250 250-500 500-1,000 1,000-3,000 > 3,000 FY20 FY21 FY22 FY23 FY24 < 5x 5x-25x 25x-75x > 75x Listed at discount Listed at premium • Majority of companies with revenue between INR 500-1,000Cr experienced • As IPO numbers have grown over the years, listing gains have also risen, hitting subscription rates exceeding 25x. about 78% in FY24. • Out of 78 IPOs, 9 IPOs witnessed subscription status to be more than 100x. • From 78 IPOs, 65 closed the listing day with premium, including 3 IPOs seeing triple-digit returns & 41 with double-digit returns. Note(s): x represents subscription times © 1Lattice | 8 Sources(s); Secondary research, 1Lattice analysis FY24 had the most IPO listings, with around ~40% seeing over more than 25% listing gains # companies by listing gains (%, FY20-24) 15 32 61 39 78 19% 20% 21% 22% 28% 7% 15% 22% 17% 16% 20% 17% 9% 17% 9% 7% 15% 10% 13% 12% 20% 10% 6% 13% 32% 28% 27% 27% 22% FY20 FY21 FY22 FY23 FY24 Listed at discount 0-5% 5-15% 15-25% 25-50% More than 50% • In FY24, 41% of the companies witnessed listing gains of more than 25%. Vibhor Steel Tubes had the highest listing gains of 193% followed by BLS E-Services with listing gains of 175%. • Samhi Hotels and Signature Global, despite having negative PnL during their listings, recorded listing gains within the range of 0% to 25%. Sources(s): Secondary research, 1Lattice analysis © 1Lattice | 9 Regulatory updates and important factors to monitor in the market Regulatory updates and guidelines by SEBI impacting the market Important factors to monitor in the IPO market Strong IPO pipeline is prepared for rollout in FY25 2024 to see surge in new-age tech IPOs as macro-economic headwinds ease Higher interest rates will drive corporates to equities in 2024 SME IPOs could continue to grow in year 2024 Source(s): Secondary research, 1lattice analysis © 1Lattice | 10 Surge in total funding garnered via IPOs both preceding and post elections, with a notable surge occurring during the lockdown period Total issue size raised via IPOs (INR Cr, FY19-24) © 1Lattice | 11 Note(s): FY19-24 represents state elections, BSE Sensex is represented in INR Source(s): Secondary research , 1Lattice analysis Performance of SME IPOs has been increasing steadily over past 10 years, both in terms of the number of IPOs and the amount of funding raised # SME IPOs and total funds raised (INR Cr, FY14-24) 4.7x 6,287 201 148 125 118 # SME IPOs 69 79 49 46 57 37 53 62 38 28 43 26 Migration 18 16 9 14 3 from SME to Mainline IPO 2,333 2,114 1,948 Total funds 944 798 554 1000 raised 353 271 300 216 (INR Cr) FY14 FY15 FY16 FY17 FY18 FY19 FY20 FY21 FY22 FY23 FY24 Average 9.3 7.3 6.5 10.1 14.3 16.5 11.3 8.3 13.7 18.7 30.1 funds raised Total funds raised (INR Cr) # SME IPOs Migration from SME to Mainline IPO • In FY24, the highest number of IPOs were issued, raising a total of ~INR 6K Cr, indicating a surge in market activity and investor confidence. • FY21 witnessed the highest number of SME IPOs transitioning into Mainline IPOs, enhancing stock performance in the market and providing investors with greater returns. Source(s): Secondary research, 1Latice analysis © 1Lattice | 12 FY24 had the highest number of QIP listings of 59 QIPs and raised a total of INR 69K Cr QIPs in last 10 years (INR K Cr, FY14-24) 59 51 • Total funds raised were approximately INR 69K 32 30 across 59 QIPs in FY24, 26 32 with an average issue 21 15 size of about INR 1,115 14 9 Cr. 23 30 61 38 76 23 69 7 13 14 11 • Bajaj Finance Limited 8 led in FY24 with an FY14 FY15 FY16 FY17 FY18 FY19 FY20 FY21 FY22 FY23 FY24 issue size of INR 8,800 Total Issue Size No. of QIPs Cr, followed by Union Bank with INR 5,000 Cr. Average Issue Size • Mega QIPs like ICICI (INR K Cr, FY14-24) Bank Ltd with INR 15K Cr in FY21 and State Bank of India's INR 14.9K Cr in 5.4 FY18 were notable in the financial services 2.3 sector. 1.1 1.1 0.9 0.9 0.8 0.8 0.8 0.7 0.6 FY14 FY15 FY16 FY17 FY18 FY19 FY20 FY21 FY22 FY23 FY24 Sources(s): Secondary research, 1Lattice analysis © 1Lattice | 14 Total funding raised via QIPs experienced a significant surge both before and after key elections, as well as during the lockdown period Total funds raised via QIPs (INR Cr, FY19-24) Note(s): FY19-24 represents state elections, BSE Sensex is represented in INR © 1Lattice | 15 Source(s): Secondary research, 1Lattice analysis In FY24, long-established listed companies(>15 years) returned with QIP listings surpassing FY23's count, indicating substantial growth in QIP listings Company vintage based on difference between QIP filing date and IPO listing date (FY19-24) 59 • FY24, there was an increase in QIP listings 19 for companies that had recently gone public (<5 years). • In FY23, QIP listings were mainly among 32 recently listed companies (<5 years). 20 26 8 • In FY24, there was a growth in QIP listings, covering both recent 12 and long-established, 14 16 suggesting a potential 9 3 revival in the private 7 20 10 capex cycle. 4 10 4 8 5 2 4 1 1 FY19 FY20 FY21 FY22 FY23 FY24 Time gap between IPO listing Less than 5 years 5-15 years More than 15 years and QIP filing Source(s): Secondary research, 1Latice analysis © 1Lattice | 16 BFSI and industrial goods & services sector emerged as the most active in FY24 Industrial goods & services saw the maximum number of listings in BFSI(57%) recorded highest Issue size followed by Industrial goods FY24 & services(36%) Total Issue Size No. of QIPs (%, FY24) (%, FY24) 3% 2% 5% 4% 5% 7% 36% 58% 24% 57% Industrial goods & services BFSI Consumer & Retail Healthcare Industrial goods & services BFSI Consumer & Retail Other* Tech & Internet Impact & Education • In FY24, there were 59 QIPs, including notable ones like Bajaj Finance Limited (INR • Despite Industrial goods & services having the highest number of listings, they 8,800 Cr), Union Bank (INR 5,000 Cr), and Bank of India (INR 4,500 Cr), all within the were characterized by smaller issuances, with BFSI being the sector with the BFSI sector. highest issue size. Note(s): *Others include Healthcare, Tech & Internet and Impact & Education © 1Lattice | 17 Source(s); Secondary research, 1Lattice analysis Timing and preparation for an IPO means difference between success and failure Companies / startups need a clear, well-orchestrated plan to capture the full value of their IPO • IPO readiness assessment • Prepare business plan and • Prepare financial information, • IPO ceremony and deliver on • Mobilize investor relations, and diagnostic IPO fact book , and industry report and other your promises as a public road shows and investor (implementing organizational presentation materials for content for the first draft of company that attracts more marketing based on the IR changes & corporate culture) banks, analysts and investors prospectus media attention calendar • Identify preferred option , a • Build external IPO team • Manage the filing process, • Manage investor Plan B ( a trade sale and debt (bankers, lawyers, auditors, finalize prospectus and seek expectations with efficient financing) investor relations and other approvals from the regulator forecasting and the use of IPO advisors) and the stock exchange proceeds • Set up resources and your IPO project management team • Set the target IPO timetable , • Launch the investor road show • Deliver high-quality external start DD and prepare the to attract the right investors in reporting and disclosures, • Prepare group systems, new offering concept main pools of capital with the and good corporate functions and tax optimization right market timing governance • Fine-tune the equity story • Build capital market and valuation • Build the IPO order book, infrastructures determine the issue price 1.Strategic considerations and 2. IPO preparation 3. Pre IPO transactions 4. Listing 6. Public listed IPO planning 12–24 months prior to IPO 6–12 months prior to IPO 1–6 months prior to IPO Listing date Post IPO © 1Lattice | 19 We understand the nuances of DRHP / placement document filing process Industry / Business Industry / Business Banker / Lawyer Banker / Lawyer DRHP Story Kickoff DRHP Story Kickoff Co Co - - ordinations ordinations Equity Investor Pitch Equity Investor Pitch Road Shows / Finale Road Shows / Finale W W rite rite U U p p Discussion Discussion Setup core team Regular team Industry / Business Investor meeting / pitch Equity report discussion Structure and brainstorm coordination report strawman on report Criticality of War room setup initiatives Stakeholder consultations Discussion with team Equity Analyst discussions Review / comments / Valuation story For by bankers comments Story outline Banker initial discussion Incorporate Suggestions comments & write section Review / comments Filing the DRHP by bankers Review / comments by lawyers Initiative workshop © 1Lattice | 20 Area of expertise Why do bankers and businesses rely on us for IPO/ ECM support Customized Accurate: Rich Data Credible Comprehensive • Custom-made Industry • Public reports launched in • Participated in 150+ private • Differentiated and rigorous Report basis business association with leading and public deals in last 2 approach by in-house team objectives industry bodies and years across sectors organizations • Working-group channel for • Flexibility and promptness • Dedicated leadership with seamless interaction enable deeper engagement • Deep expertise across sectors, experienced team in sector with the business quoted in various media and Industry Report making • Complete adherence to code publications of conduct • Understand the nuanced • Access to knowledge base needs of report to showcase • Easy traceability of research and experts • Tech-enabled access business strength and and sources control of client documents, advantages material • Alignment to business pace for reports © 1Lattice | 21 How can 1Lattice help? W1 W1 W2 W2 W3 W3 W4 W4 W5 W5 W6 W6 W7 W7 W8 W8 Storyboarding & Strawman Storyboarding & Strawman Industry assessment draft report Industry assessment draft report Finalization of industry report Finalization of industry report • Storyline creation • Detailed hypotheses along with • Secondary analysis along with data and literature on market sizing data sources • Preparing the contours of industry analysis • Key analyses required for Industry • Primary interaction with key stakeholders assessment • Validate findings and analysis • Bring viewpoints in the industry segment • Finalize the industry report along • Build strawman with broad details • Discussions with stakeholders and industry experts Our inputs Our inputs with iterations and changes • Capture all pointers to be detailed • Validate and crystalize the trends and projections over the next few • Final review and submission. out along with the feedback from years. bankers • Prepare projections • Finalize the trajectory of sector and sub-sectors • Draft cut to be reviewed by client • Draft version • Draft version to • Finalize the changes from the • Finalize • Interim and inputs to be provided to be shared be shared with lawyers and other stakeholders storyline and strawman Client reviews Client reviews to bankers lawyers and submit the industry write up sign off with version with bankers details Milestones and Milestones and progress update progress update Kick-off meeting First check-in Second check-in Third check-in Final check-in check check - - ins ins Storyline submission Storyline submission Interim report discussion Interim report discussion Draft report submission Draft report submission Final Final report report submission submission Deliverable Deliverable © 1Lattice | 22