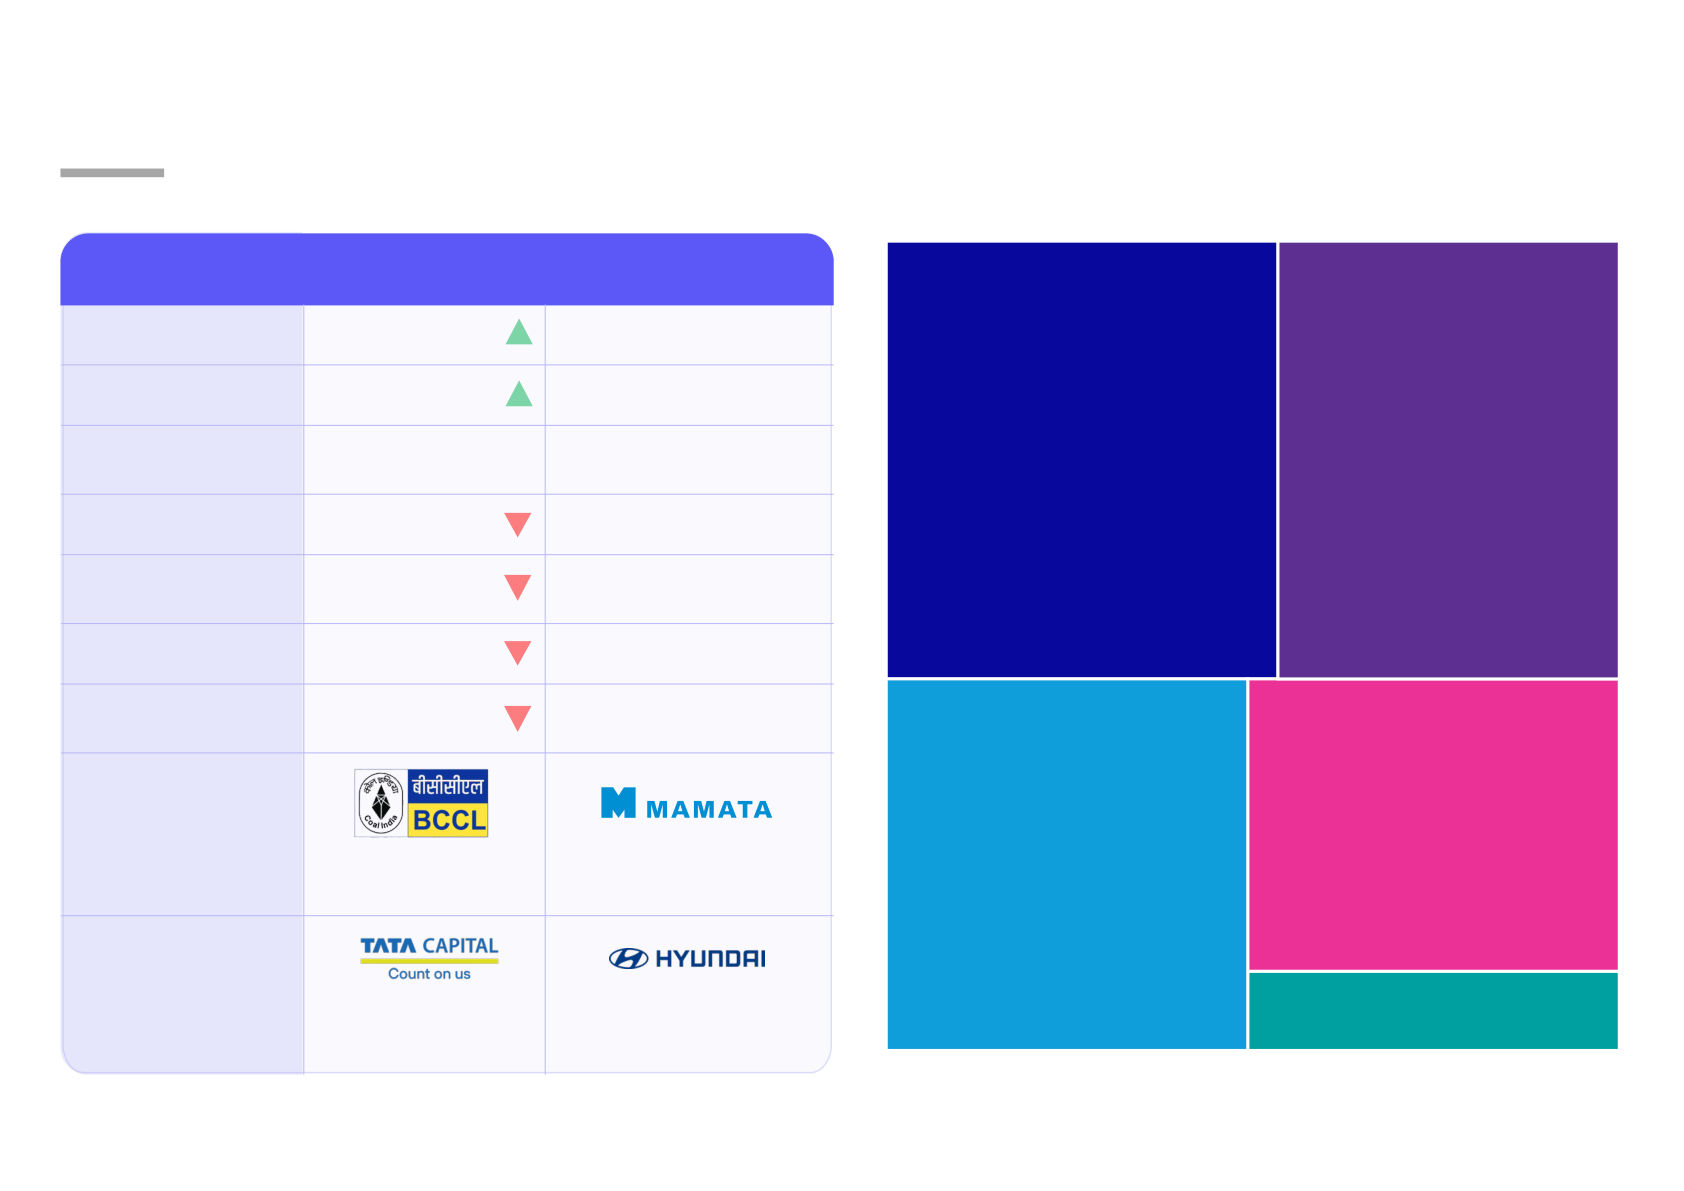
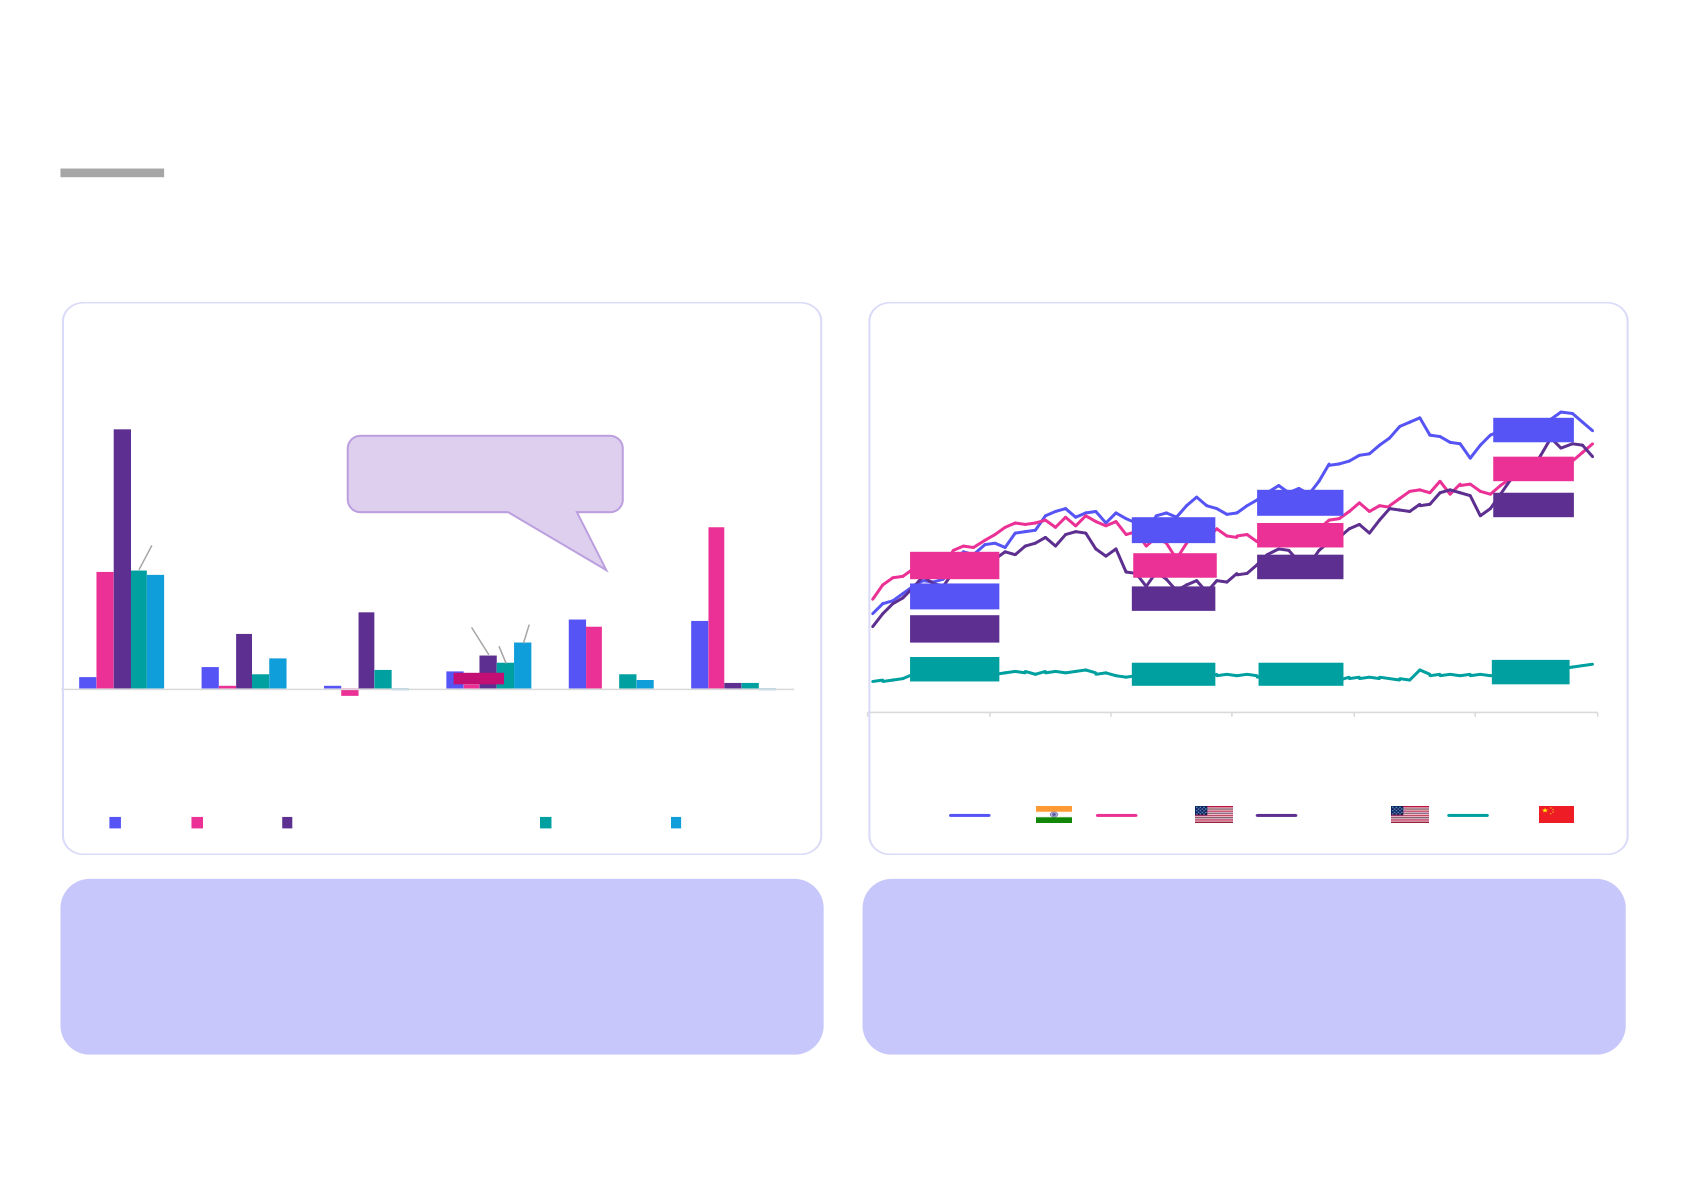
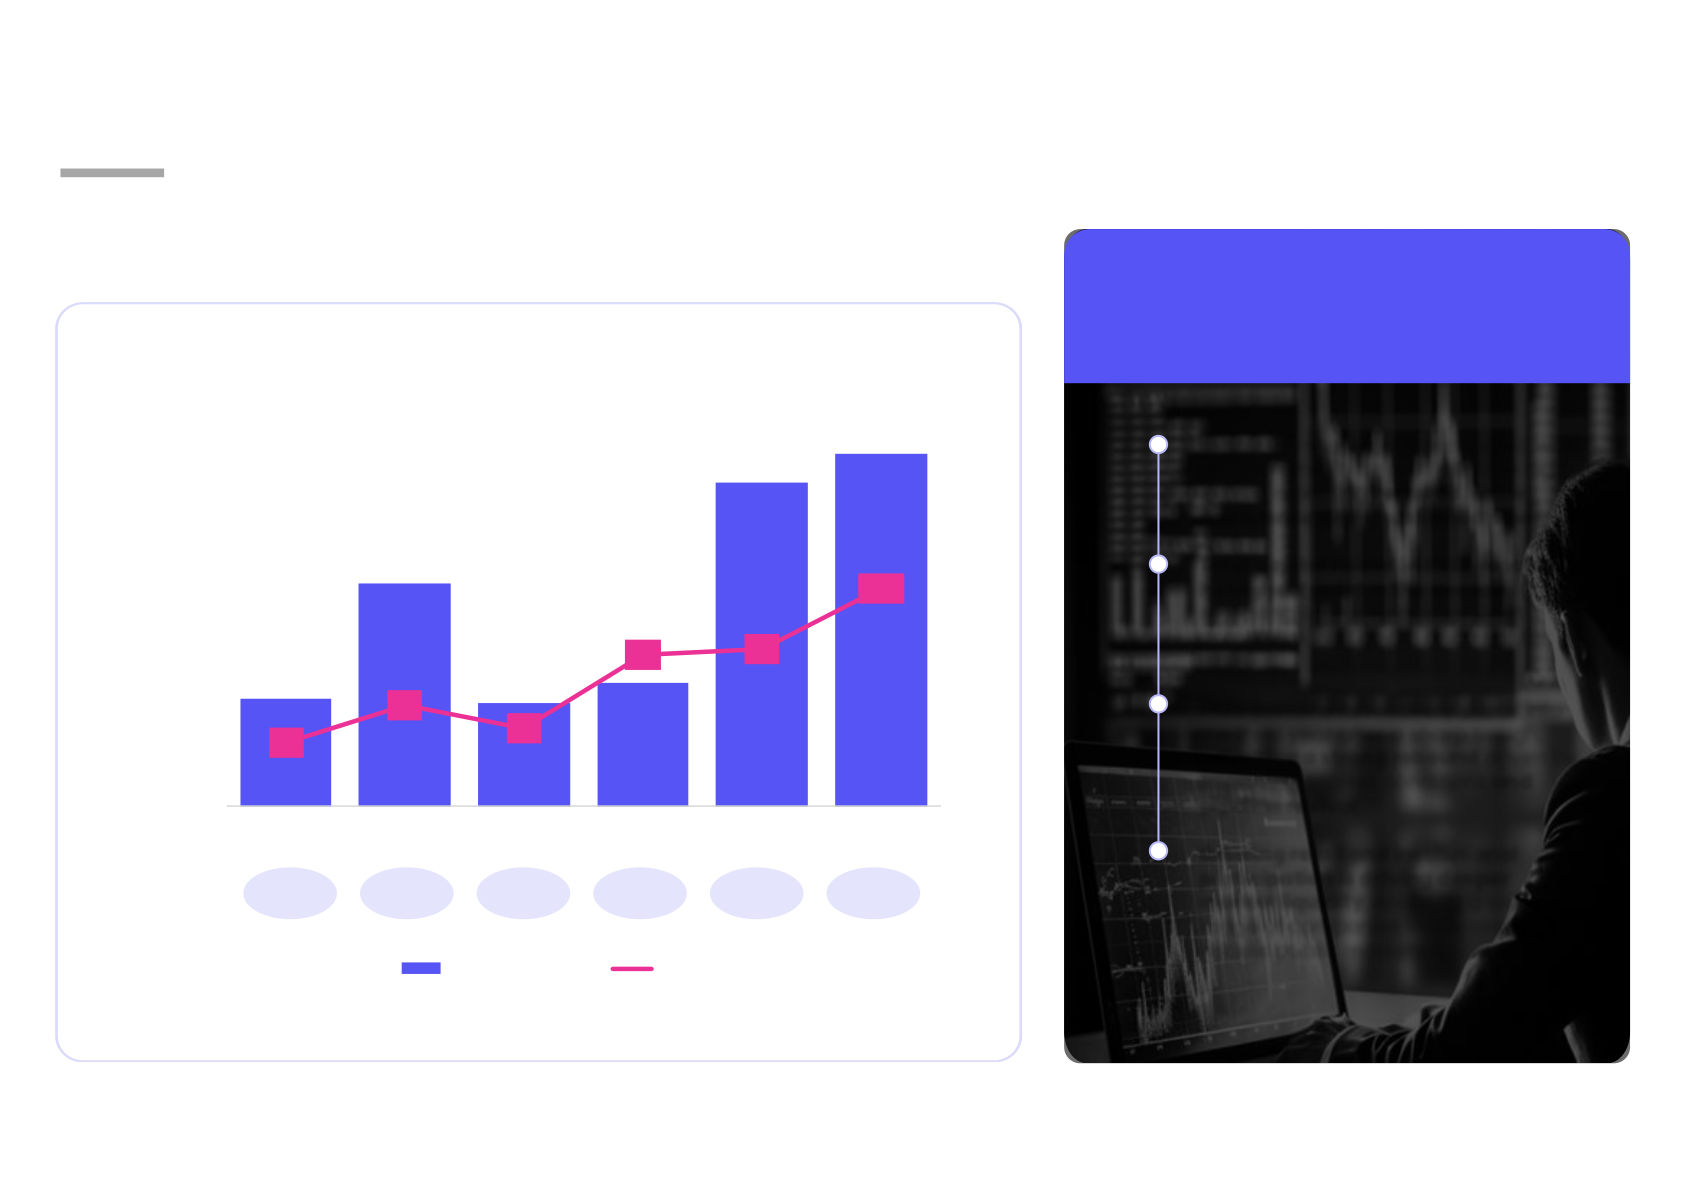
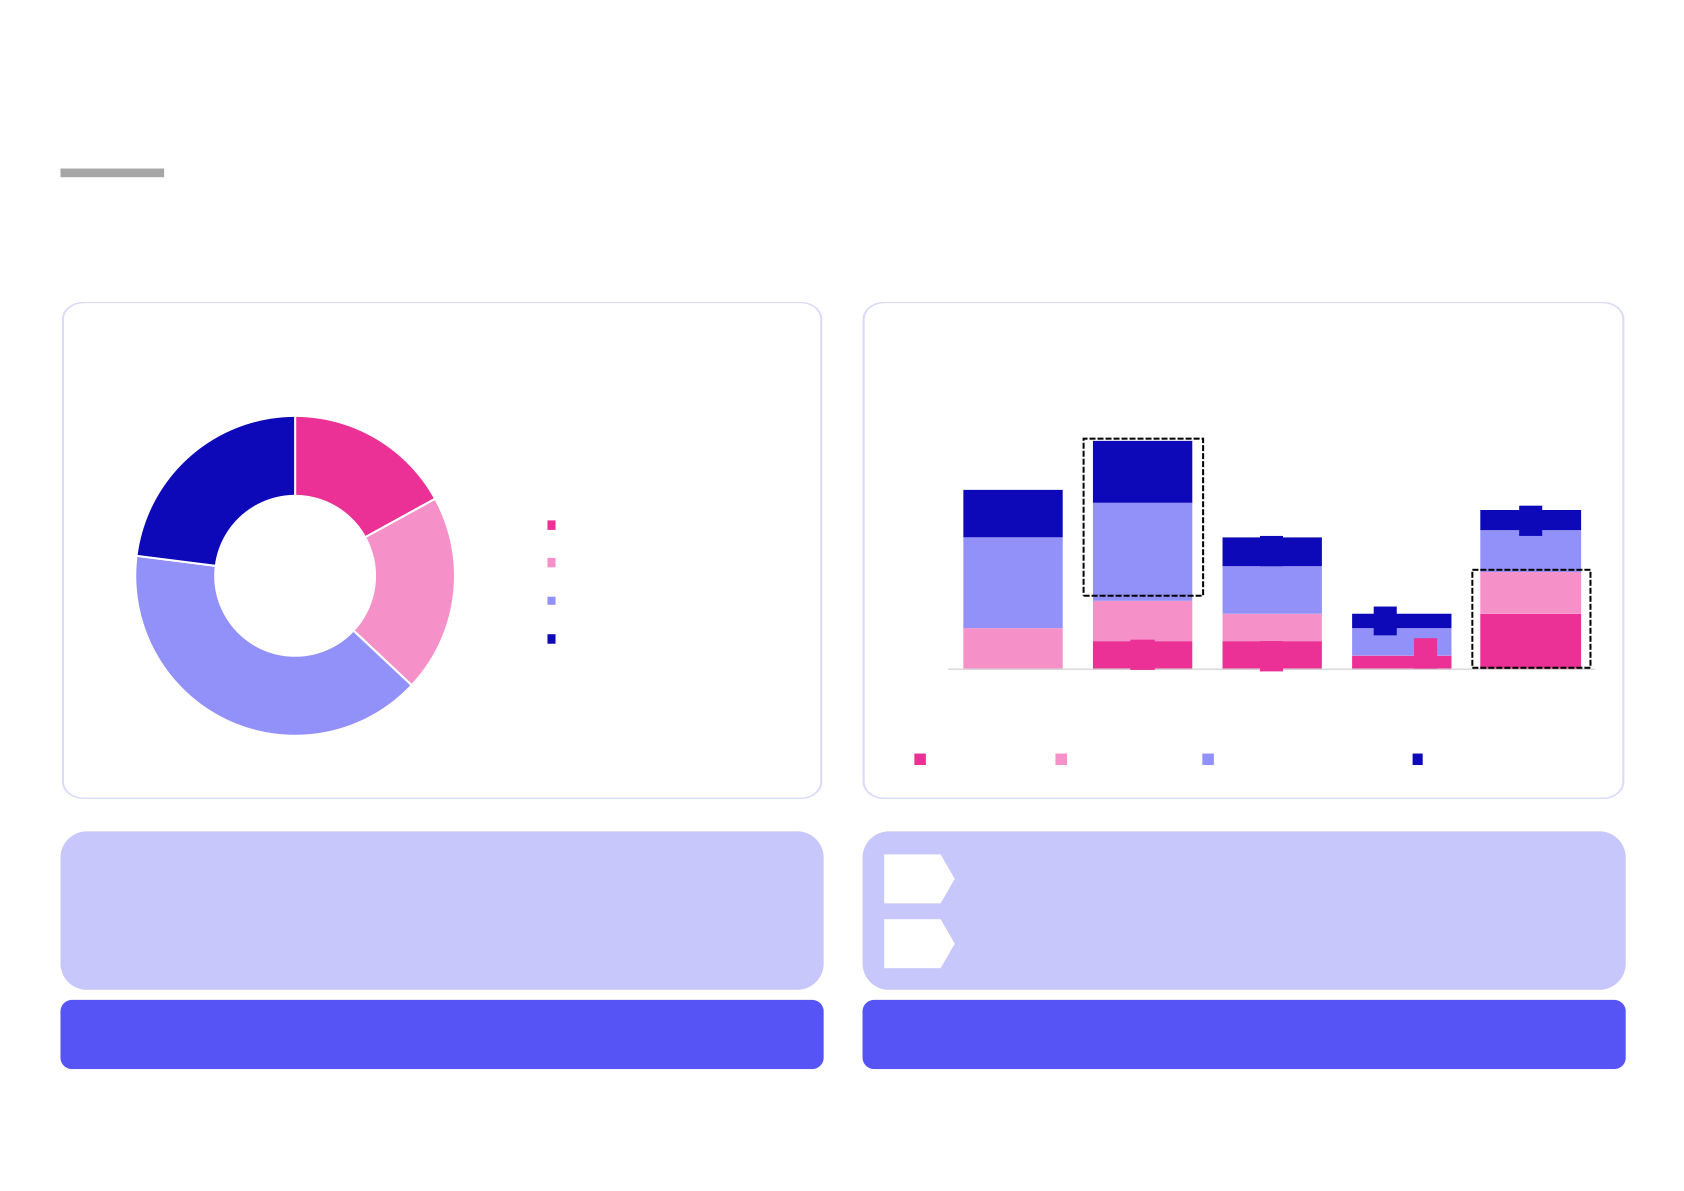
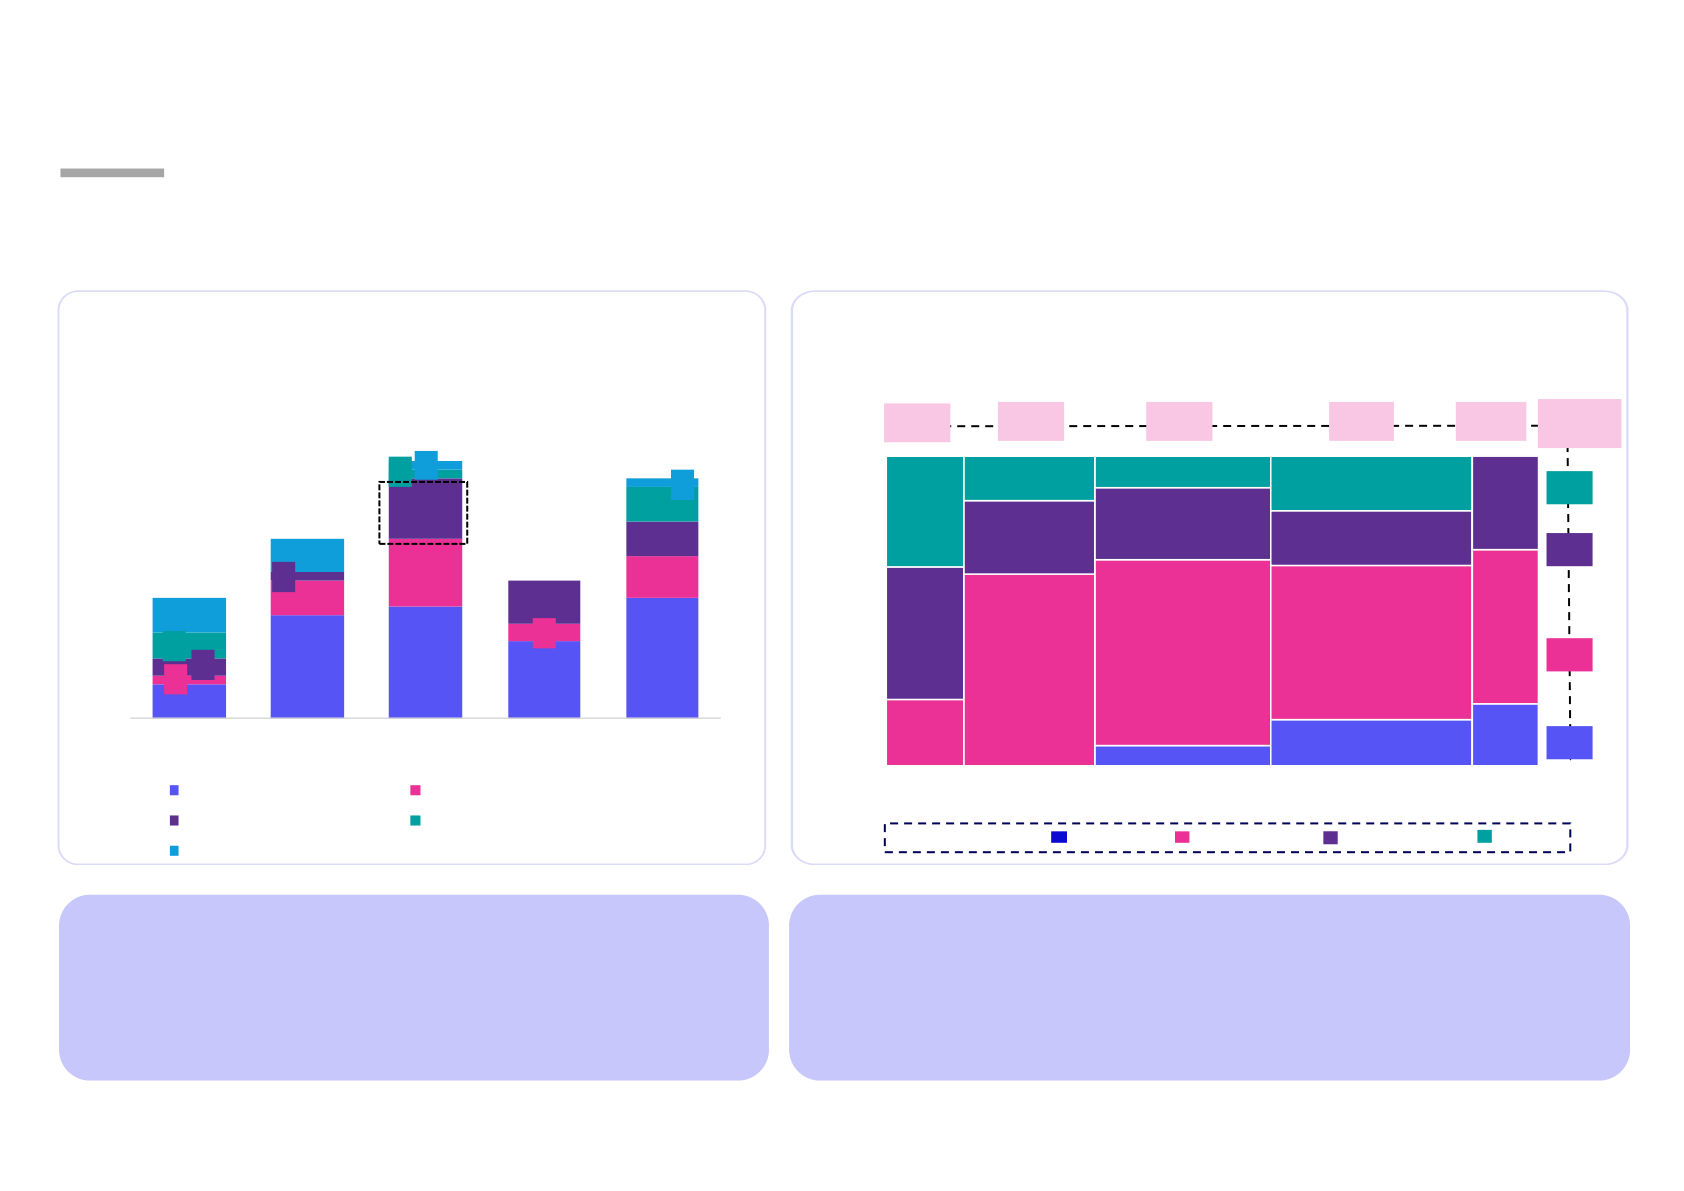
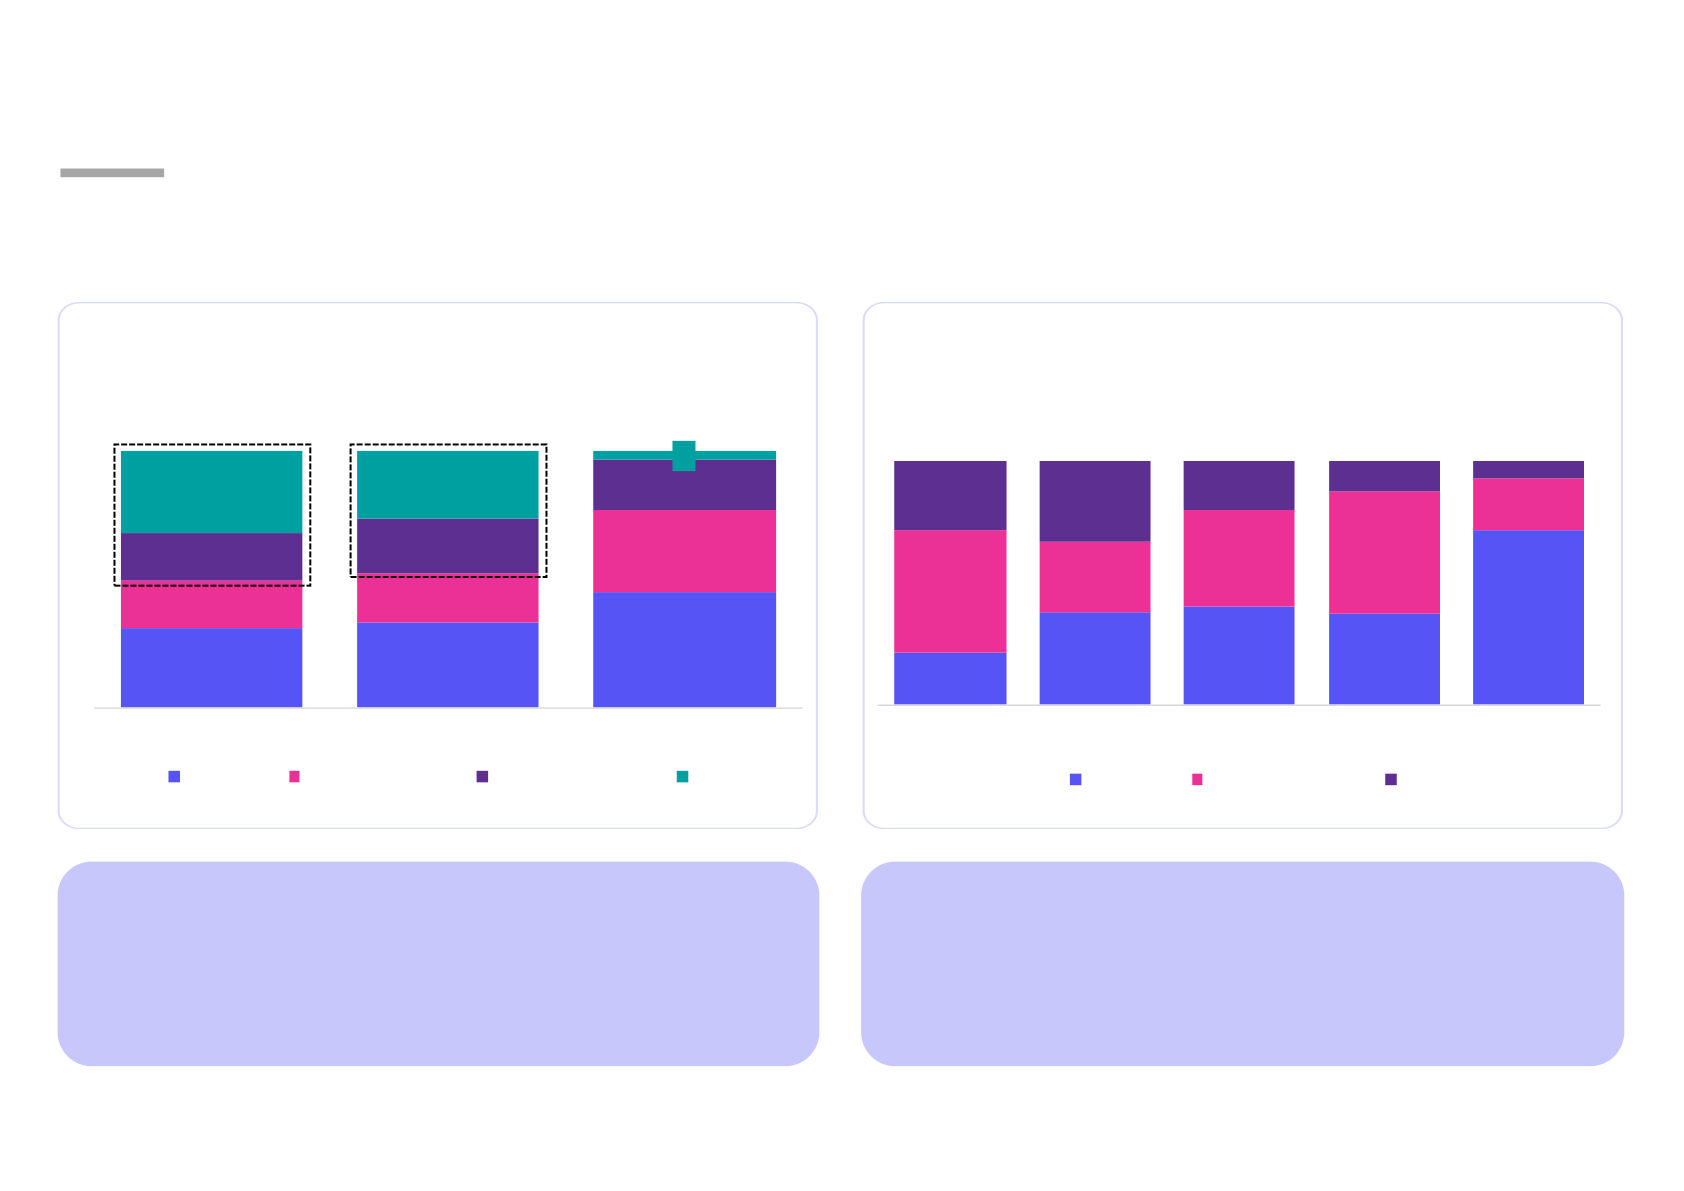
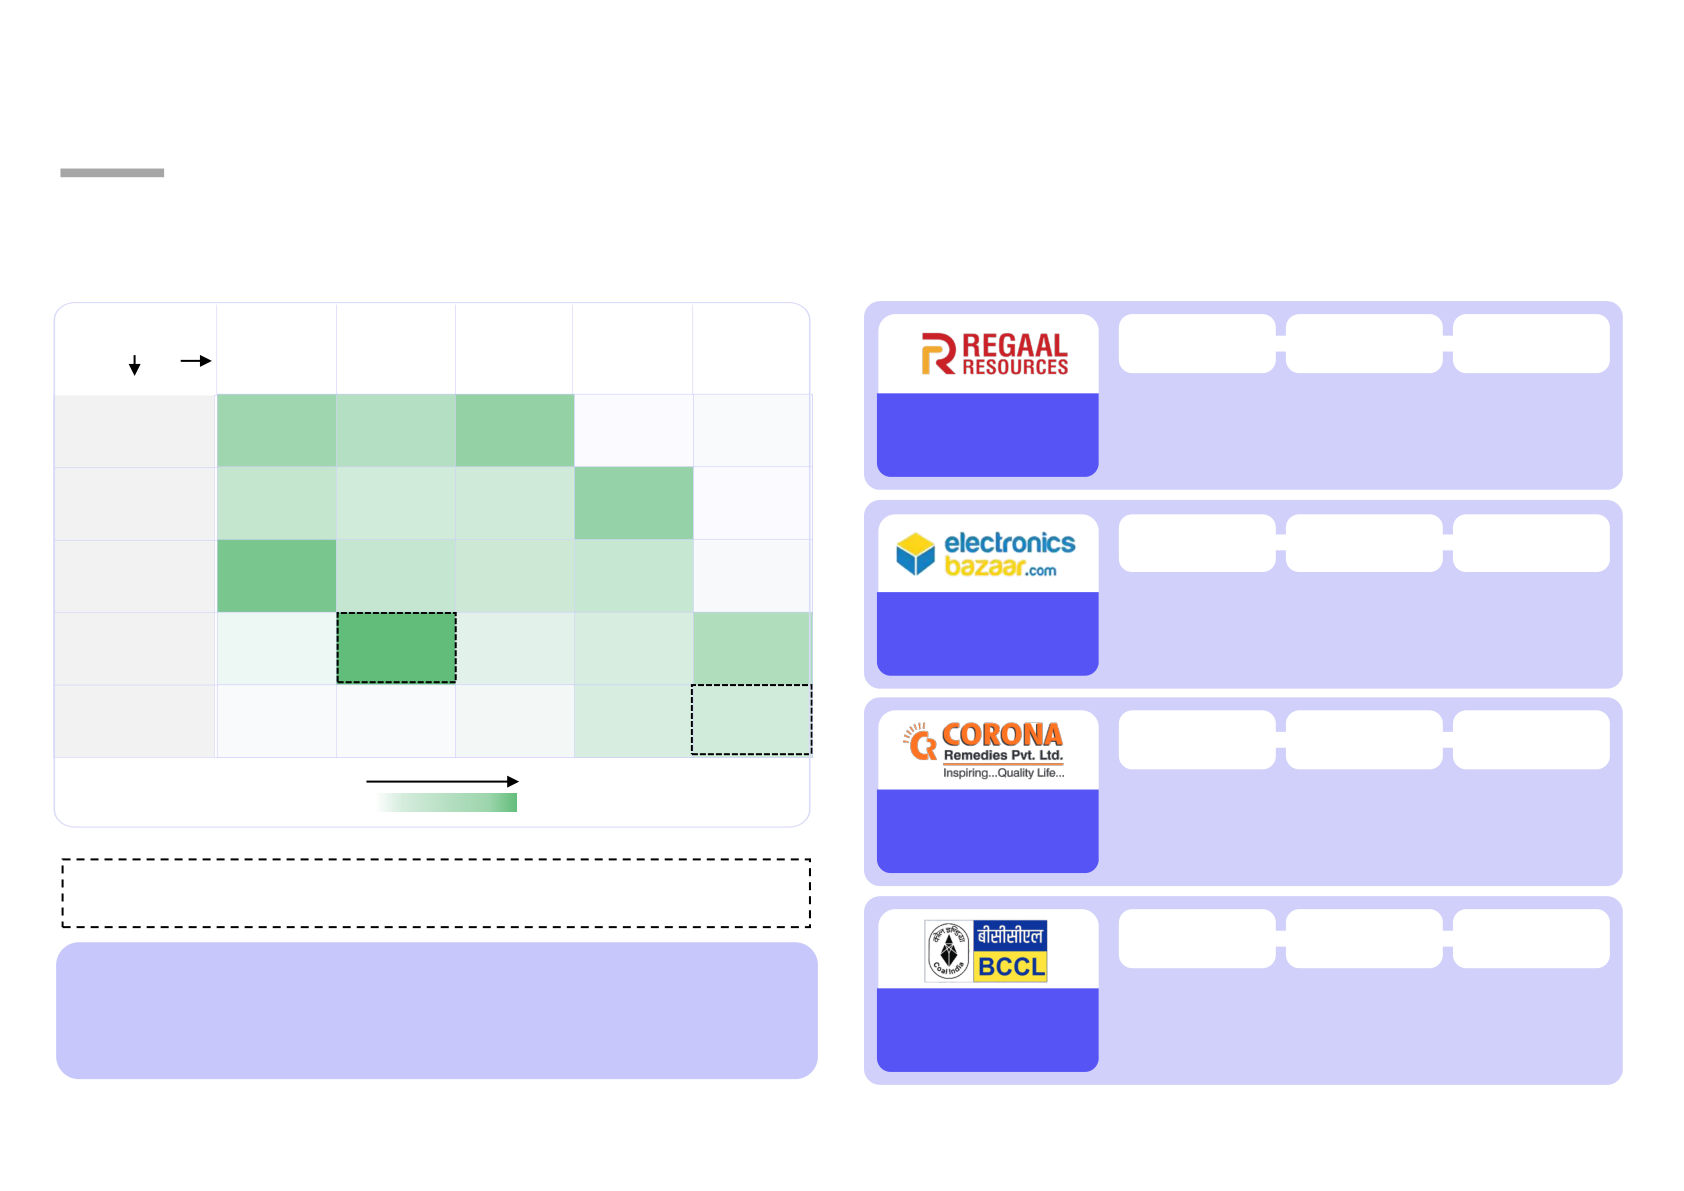
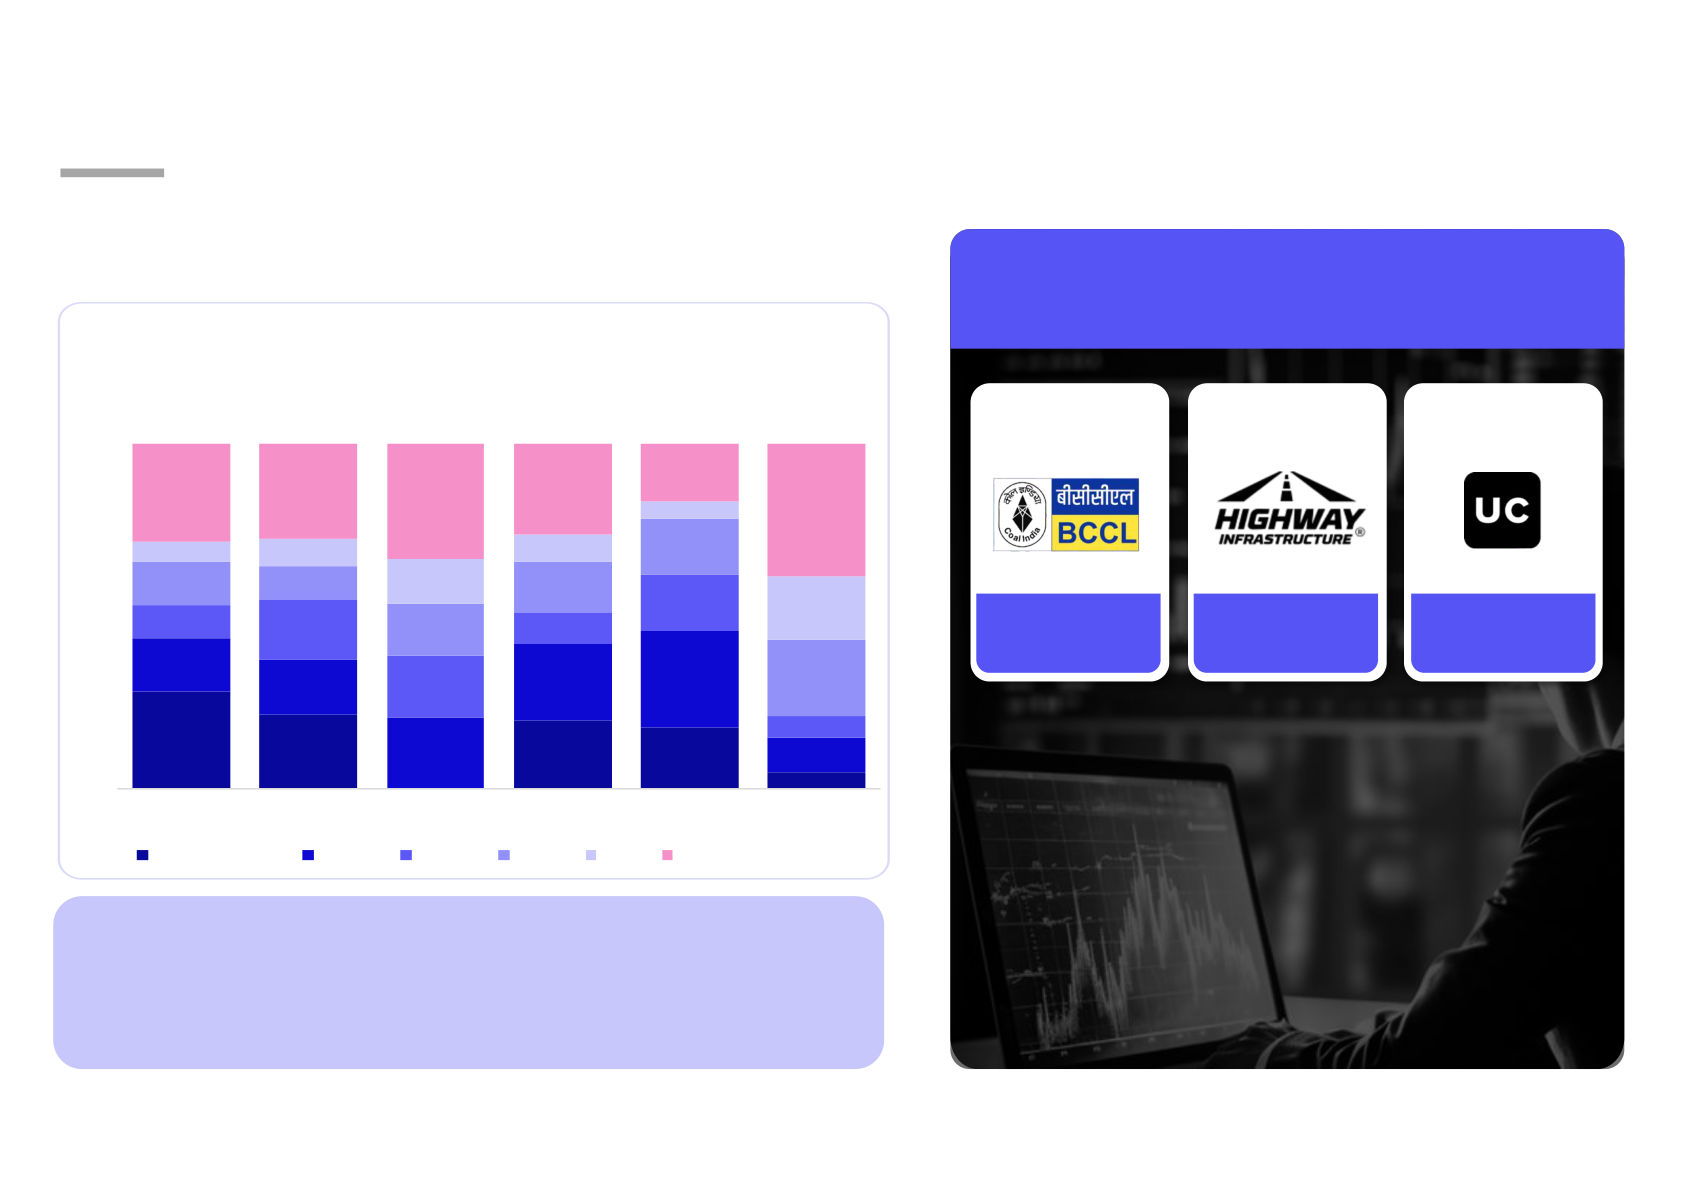
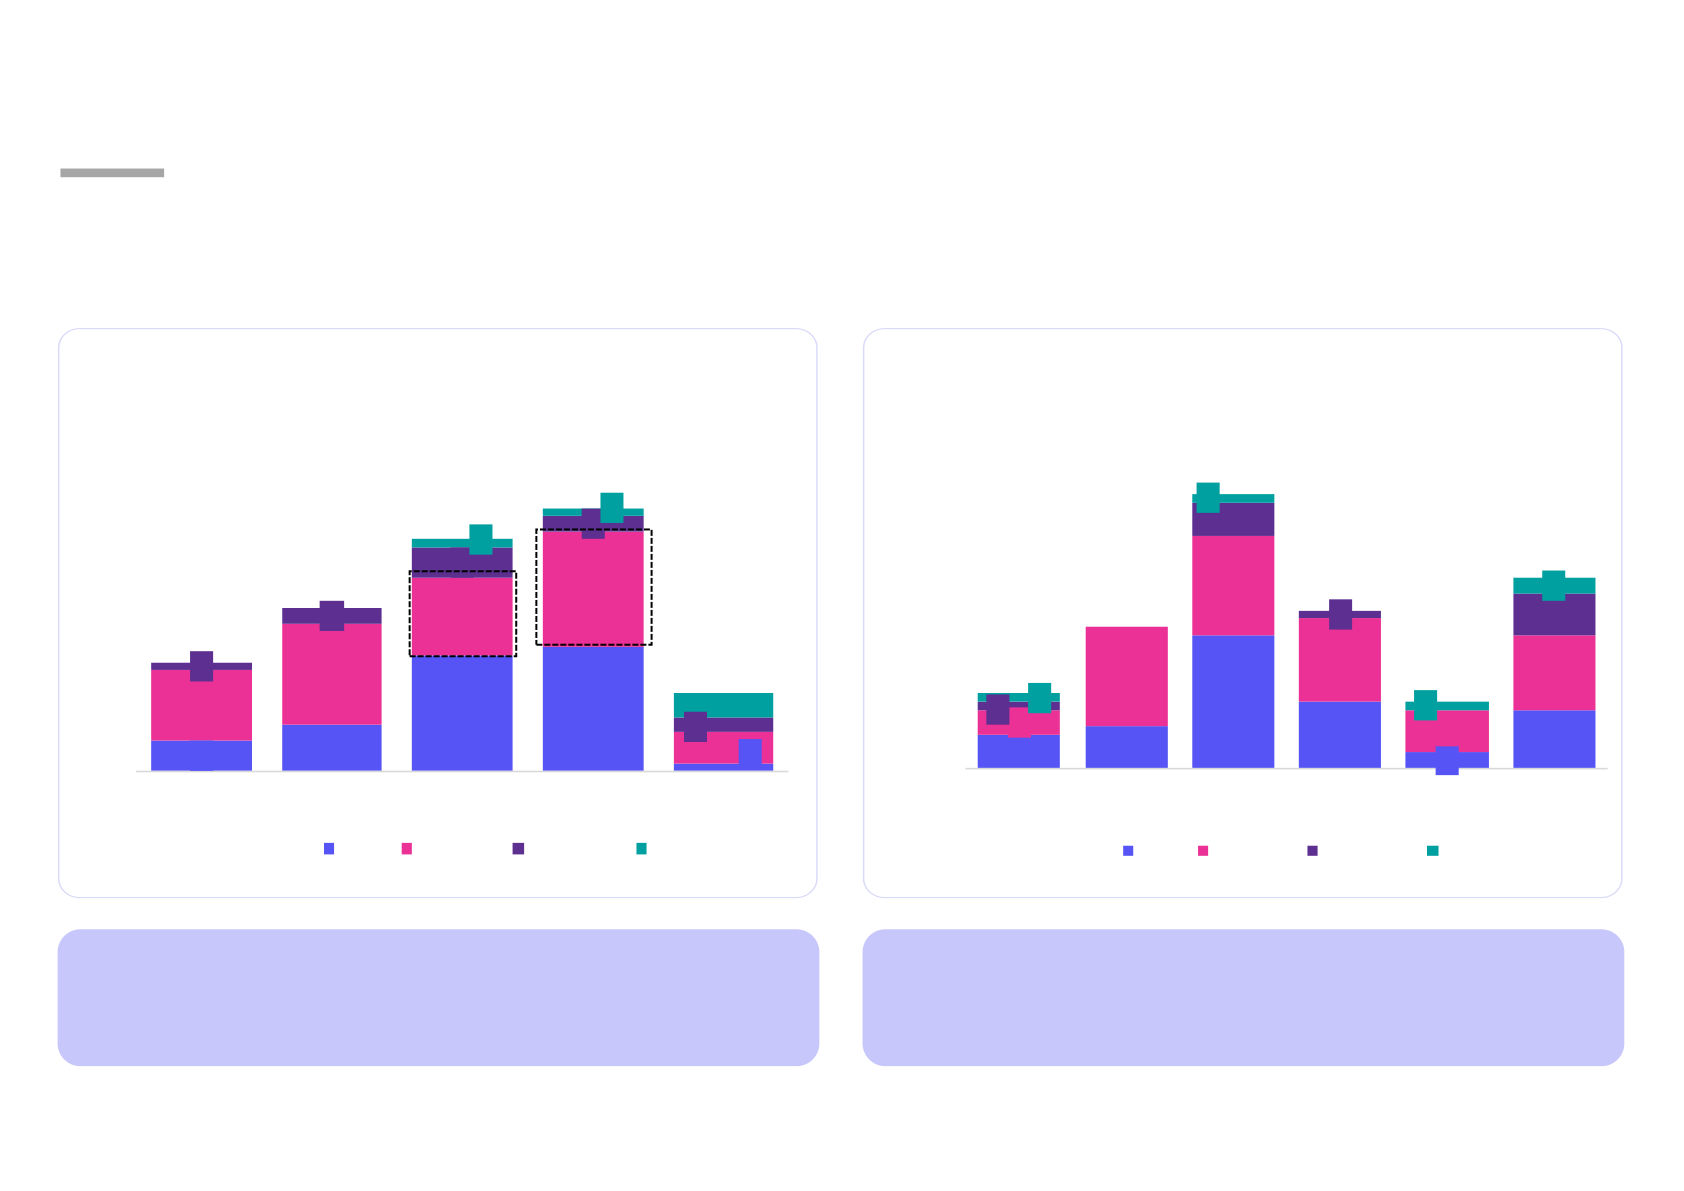
Foreword The IPO market remains a key route for capital raising, liquidity, and price discovery, with investor focus firmly on fundamentals, governance, and sustainable growth . Over the past five years, India’s IPO market has shifted from volume - led to quality - driven activity. Investors are more selective, supported by stronger regulations, higher institutional participation, and improved disclosures. In FY 26 , 109 companies raised INR 1 , 77 , 028 Cr, with stable activity driven by domestic and institutional flows . The industrial sector led both in number of IPOs and capital raised, reflecting strong investor preference for core economy businesses . Investors continued to prefer companies with clear earnings visibility and scalable business models, indicating a more disciplined investment approach . With ongoing geopolitical tensions, supply chain disruptions, and Praneet Singhal commodity volatility impacted sentiment, with capital shifting toward safe - Director haven assets like gold, making IPO timing more critical. TI & ECM As FY27 begins, a strong pipeline of 110 IPOs awaiting SEBI approval (out of 214 DRHPs filed in FY26, 104 approved) positions the market for increased activity. As conditions improve, this pipeline is expected to unlock, driving higher IPO issuances and strengthening investor confidence. This report presents a comprehensive analysis of India’s mainboard IPO landscape, covering recent trends, market dynamics, and emerging themes & aims to support decision - making for business leaders, investors, & policy - makers . FY26 saw 109 IPOs raising INR 177K Cr, surpassing FY25 on deal count and capital raised, indicating a resilient IPO market despite a volatile geopolitical environment Parameters FY26 FY25 8 52 Number of IPOs 109 79 Total capital raised INR 177K Cr INR 163K Cr 51,269 44,468 Fresh issue | Offer for 42% | 58% 36% | 64% sale Industrial Goods BFSI & Services Avg. Issue size INR 1,624Cr INR 2,057Cr Avg. total 38x 73x subscription Avg. listing gain 6% 29% IPOs with Positive 61% 84% 19 20 listings 32,406 Best performing IPO Consumer & Retail (Listing gains) 40,108 Bharat Coking Coal Mamata Machinery Tech & Internet (77%) (159%) Mega IPO of the year 10 (Issue size) Tata Capital Hyundai Motor India 8,777 Healthcare (INR 15,512Cr) (INR 27,858Cr) Healthcare Note(s): All values correspond to FY26 and are expressed in INR Cr, with top - right figures denoting company counts across domains © 1Lattice | Source(s): NSE & BSE, 1Lattice analysis 3 FY26 marks a shift in investor preference toward precious metals as global uncertainty moderates equity market momentum Silver leads all asset classes in FY26 as precious metals NSE leads global equity markets across FY21 - 26, outperform amid subdued equity market returns consistently outpacing US and Chinese indices Stock market trends Performance of different asset classes (FY21 - 26) (%, FY21 - 26) 161% 24,659 The Nifty 50 and Nifty Bank have 23,494 taken a hit in FY25 due to the ongoing bear market 22,048 101% 22,322 74% 17,360 17,607 73% 71% 15,010 15,429 16,110 48% 14,702 11,448 43% 39% 42% 29% 21% 34% 13,406 16% 19% 12% 14% 9% 11% 5% 7% 9% 4% 2% 2% 3,531 4% 4,152 3,279 3,014 3% - 1% - 1% - 4% FY21 FY22 FY23 FY24 FY25 FY26 FY21 FY22 FY23 FY24 FY25 FY26 NSE NYSE NASDAQ SSE Gold Silver U.S 10-Year Bond Yield* Nifty Bank Nifty 50 • Silver led all asset classes in FY26 with 101% returns, as industrial • NSE consistently outpaced NYSE, NASDAQ, and SSE across FY21 - 26 , demand from solar and EV sectors combined with growing reaching the highest index value among all four markets and investor interest in precious metals reinforcing India's structural growth premium ** • Nifty 50 and Nifty Bank remained at 4% in FY26, as sustained FII • SSE remained consistent across FY21 - 26 while Indian and US markets outflows and global macro uncertainty extended the bear compounded steadily, reflecting a clear divergence in investor market trend from FY25 confidence across major global economies Note(s): Data for asset classes (excluding U.S 10 - Year Bond Yield) and stock market indices reflects values for the month of March for ea ch year *U.S 10 - Year Bond Yield are based on the yield rate values as of the last trading day of March; **Foreign Institutional Investors Source(s): NSE & BSE, 1Lattice analysis © 1Lattice | 4 India’s primary markets strengthen as IPO volumes and capital reach record highs in FY26 IPO volumes tripled from 32 in FY21 to 109 in FY26, while total capital raised grew 3x to INR 177K Cr FY26 sustains IPO momentum, reaching record highs in deal volume and capital raised Total number of IPOs (INR K Cr, FY16 - 26) India's IPO market has recovered, with deal volumes hitting an all - time high in FY26 reflecting restored issuer confidence and a sustained pipeline Total capital raised in FY26 reached its highest point in the decade , 109 signalling a structural step - up in primary market depth and investor 79 76 interest 51 FY26 sustains its recovery streak into 39 the third year after a sharp trough, 32 reflecting a strong rebound driven by improving market conditions and 54 112 52 62 163 177 pipeline revival FY21 FY22 FY23 FY24 FY25 FY26 Growing retail and institutional participation is driving deeper Average issue 1,691 2,188 1,345 814 2,057 1,624 market liquidity , enabling a wider size (INR Cr) range of companies to successfully access public markets Total issue size No. of IPOs Source(s): NSE & BSE, 1Lattice analysis © 1Lattice | 5 Fresh issue dominance in FY26 signals a structural shift toward growth - led capital formation 23% of IPOs were purely fresh issue, underscoring a clear Lower - profit firms are driving fresh issue IPOs, marking a tilt towards growth capital within the 63% fresh - led mix shift toward growth - led capital formation Split of issue size into offer for sale & fresh issue Issue size split Vs profits of the company (%, FY26) (#, FY26) Total IPOs: 109 33 T otal 109 IPOs were 26 listed during FY26 9 17% 23 23% 19 7 3 100% OFS** 14 4 6 >50% OFS 13 7 8 20% 6 >50% Fresh Issue 6 2 4 100% Fresh Issue 4 8 6 2 4 4 40% Profits: <20 20-50 50-100 100-150 >150 (INR Cr) 100% OFS > 50% OFS > 50% Fresh Issue 100% Fresh Issue INR 20 - 50Cr emerged as sweet spot for fresh issue - led IPOs, • FY26 IPOs were led by fresh issues, reflecting a shift to growth 70% reinforcing growth - stage capital demand capital, while OFS remains indicative of mature, exit - driven listings High - profit companies (>INR 150Cr) skew OFS - heavy, signaling • Higher fresh issue share reduces immediate sell - side pressure, 61% increased promoter/PE monetisation in mature businesses indicating a healthier, growth - oriented IPO mix LG Electronics India and ICICI Prudential AMC had the largest issue size Billionbrains Garage Ventures ( Groww ) has the highest fresh issue of INR 11,607Cr & INR 10,603Cr, respectively, which opted for 100% OFS share among all FY26 IPOs at ~84% of its total issue size of INR 6,632Cr Note(s): *Private Equity; **Offer for Sale © 1Lattice | Sources(s); NSE & BSE, 1Lattice analysis 6 FY26 IPOs led by industrials and mid - sized companies, with broader participation and a shift toward early - stage profitability Industrial goods and services companies lead FY26 IPOs reflect a shift to overall business fundamentals, with no IPO activity across all revenue segments in FY26 losses at lower scale and limited high - margin large - cap issuers Companies by annual revenue Profit Margin Vs revenue of company at the time of listing (#, FY26) (#, FY26) Total IPOs: 109 Total IPOs: 109 Number of 21 30 34 10 14 companies 30 28 1 1 > 20%, 10% > 20%, 14% > 20%, 18% 1 10% - 17 4 20% > 20%, 7 21 10% - 20%, 23% 30% 36% 10% - 20%, 4 10% - 20%, 18% 24% 27 16 4 14 8 1 5 4 5 4 10% - 0% - 2 20%, 10% 0% - 10%, 50% 3 0% - 10%, 60% 56 43% 14 50% 13 2 0% - 10%, 12 1 9 62% 4 0% - 10%, < 0%, Revenue: <250 250-500 500-1,000 1,000-1,500 >1,500 9 21% < 0%, 14% 20% (INR Cr) < 0%, 7% Revenue: < 250 250 - 500 500 - 1,000 1,000 - 3,000 > 3,000 Industrial goods & services Consumer & retail (INR Cr) Tech & internet BFSI Profit margin range <0% 0% - 10% 10% - 20% > 20% HLS • From FY25 to FY26 , IPO volumes increased (79 to 109), with • Number of companies with revenue below INR 500Cr going for listing rose increased participation beyond highly profitable companies, from 28 in FY25 to 35 in FY26 , while mid - sized companies (INR 500 - 1,000Cr) broadening access to public markets increased from 18 to 30 , indicating broader participation • Tech & consumer issuers skew mid - sized (INR 500 – 1,000 • Over 50% (56 out of 109) of FY26 IPOs report 0 - 10% margins, with 16% (17 out Cr), indicating IPOs are being used as growth capital rather of 109) exceeding 20% profitability than late - stage monetization © 1Lattice | Sources(s): NSE & BSE, 1Lattice analysis 7 QIBs dominate higher subscription bands, while retail demand remains strong across both smaller (<INR 500Cr) and mid - sized (INR 500 - 1,000Cr) companies QIBs and NIIs investors show higher subscription Retail demand shows varying intensity, with spikes in status, compared to retail investors select IPOs and more balanced participation across others Subscription status by investor category Subscription status by RII based on company revenue (#, FY26) (#, FY26) Total IPOs: 109 109 109 109 14 21 30 16 28 4 2 2 29 21 6 35 4 7 6 23 35 8 20 12 6 7 21 20 20 49 12 8 6 36 34 3 <250 250 - 500 500 - 1,000 1,000 - 1,500 >1,500 QIBs NIIs RIIs <5x >5x & <25x >25x & <75x >75x <5x >5x to <30x >30x • Strong QIB participation (>75x in 35 listings) indicates robust • High - conviction (>30x) subscriptions skew towards smaller institutional demand, supporting IPO price discovery companies, while higher - revenue IPOs (INR 500 – 1,500Cr) see steadier 5 – 30x participation • QIB and NII subscriptions exceed 25x in 50+ IPOs, while RII participation remains concentrated in lower bands , • Amid market uncertainty , steady retail participation supports indicating strong institutional participation alongside more balanced subscription levels, with fewer extreme oversubscription selective retail demand spikes Note(s): x represents subscription times © 1Lattice | 8 Sources(s): NSE & BSE, 1Lattice analysis Subscription trends indicate selective investor participation, with higher demand concentrated in certain IPOs IPOs in INR 1,000 - 2,000Cr issue size had highest average First - mover positioning and sector dominance drive subscription up to 109x, reflecting high investor demand India's most oversubscribed IPOs of FY26 Revenue (in INR Cr) 191x QIB 357x NII 58x RII <250 250 - 500 500 - 1,000 1,000 - 2,000 >2,000 Issue size (in INR Cr) • India's largest maize - based products Total subscription manufacturer 66x (5) 51x (9) 74x (3) - 2x (1) <250 160x • Strong profitability growth with no listed peer 40x (6) 31x (4) 32x (11) 73x (4) - 250 - 500 266x QIB 226x NII 47x RII 94x (1) 39x (6) 34x (10) 38x (7) 4x (2) 500 - 1,000 • India's largest Microsoft - authorised ICT Total subscription refurbisher 10x (1) 109x (1) 18x (3) 26x (7) 54x (5) • First - mover advantage with no listed peer 1,000 - 2,000 150x in India >2,000 2x (1) 2x (1) 7x (3) 26x (8) 31x ( 10) 294x QIB 220x NII 30x RII • India's 2nd fastest growing pharma company Low High Total subscription • Strong positioning in high - demand 145x therapeutic areas The table shows the average subscription status for listed companies categorised by revenue and issue size, with the number of companies mentioned in brackets (Y) 311x QIB 241x NII 49x RII • Companies with issue sizes & revenue >INR 2,000Cr saw up to 31x • India's largest coking coal producer average subscription across 10 companies, indicating investor Total subscription • PSU - backed with integrated washeries interest at higher ticket sizes 144x & mining Note(s): x represents subscription times © 1Lattice | 9 Sources(s): NSE & BSE, 1Lattice analysis FY26 IPO market saw a rise in discounted listings amid current market volatility, signalling a shift toward moderate and selective listing outcomes FY26 recorded the highest discounted listing across all six years at 39%, coinciding with the highest IPO volume of 109 While PSUs and infrastructure companies dominated FY26, Urban Company distinguished itself among the year’s top listing gains #Companies by listing gains (%, FY21 - 26) Bharat Highway Urban # IPOs = Coking Coal Infrastructure Company 32 51 39 76 79 109 16% 26% 27% 28% 33% 5% 39% 16% 8% 6% 8% 13% 10% 13% 14% 16% 18% 9% 9% 15% 18% 77% 76% 62% 16% 28% 22% 22% 16% 18% • Listing day returns are moderating in current volatile 6% 28% market , with 39% of FY26 IPOs listing at discount, 22% 21% 20% 10% 18% signalling investors to look beyond IPO debuts for 5% outsized return FY21 FY22 FY23 FY24 FY25 FY26 • In the current volatile market, IPOs backed by strong More than 50% 25-50% 15-25% 5-15% 0-5% Listed at discount financials and established market presence are better at delivering listing gains, making IPO selection increasingly challenging • Rise in 0 – 5% listings alongside higher discounts highlights a shift towards • Declining listing gains indicate that fundamentally strong marginal or muted listing performance in FY26 companies are better positioned to deliver value, • >25% listing gains have remained broadly consistent across years (except shifting retail investor confidence towards long - term FY23), but declined in FY26, reflecting reduced upside despite strong IPO allocation over short term gains activity © 1Lattice | 10 Sources(s): NSE & BSE, 1Lattice analysis In FY26, 62% of IPOs (67 of 109) delivered positive listing gains, suggesting broadly supportive investor demand at listing Listing gains of 0 – 25% are concentrated in the Listing performance is concentrated in the 0 – 25% INR 500 – 3,000Cr range, which also accounts for range across profit levels, with less variability among the highest number of positive listings higher - profit companies Listing gains Vs revenue of the company Listing gains Vs profits of the company (#, FY26) (#, FY26) Total IPOs: 109 Total IPOs: 109 33 34 1 1 30 4 2 1 23 4 21 12 19 2 15 17 1 5 2 10 14 10 1 10 9 9 13 12 8 1 16 9 3 1 16 1 15 3 2 5 8 7 5 6 4 4 1 4 2 Revenue: Profit: <0 0-20 20-50 50-100 100-150 >150 <250 250-500 500-1,000 1,000-3,000 >3,000 (INR Cr) (INR Cr) Listing Gains Listing Gains <0% 0%-25% 25%-50% >50% <0% 0%-25% 25%-50% >50% • High listing gains (>50%) are limited and appear selectively • FY25 saw ~46% companies had listing gains >25%, compared to across mid and large IPOs, indicating that outsized returns are ~15% in FY26, reflecting a more cautious investor approach not widespread amid market volatility © 1Lattice | 11 Sources(s): NSE & BSE, 1Lattice analysis Strong domestic flows and policy tailwinds are sustaining equity markets amid global uncertainty and shifting investor preferences Key trends shaping Indian capital market Domestic capital takes charge FII*s remained net sellers through FY26, DIIs** stabilised the markets , signalling a maturing investor base less dependent on foreign flows Policy tailwinds fuel growth Union Budget’s INR 12L tax - free limit, GST cuts on consumer goods, RBI's rate easing cycle & changes in STT*** have collectively boosting disposable incomes, discretionary spending, and corporate earnings visibility Rising interest in precious metals Geopolitical tensions and market volatility are driving investors toward precious metals , with sentiment clearly shifting towards hard assets over equities Retail investors preference shifts Growing household preference for equities and mutual funds over traditional savings is driving a steady rise in SIP inflows , building a resilient and self - sustaining domestic market base SEBI reforms fuelling IPOs SEBI consolidated all ICDR**** - related circulars into a single master circular , improving regulatory clarity, compliance efficiency, and investor protection for issuers and intermediaries Note(s): *Foreign Institutional Investors; **Domestic Institutional Investor; ***Securities transaction tax; ****Issue of Cap ita l & Disclosure Requirements Source(s): Secondary research, 1Lattice analysis © 1Lattice | 12 Despite near - term uncertainty, India's capital markets are primed for growth driven by domestic stability and a robust listing pipeline Future Outlook Domestic capital takes charge • IPO activity in India is currently subdued due to geopolitical uncertainty. However, with 214 companies filed DRHPs in FY26, of which 110 are under process & 104 have received SEBI approval with easing tensions are expected to revive IPO issuance , restore investor confidence , and sustain equity issuance momentum across India’s capital markets in the upcoming years Domestic capital stability • Average SIP inflows of INR 26,458Cr/month in FY26 , along with strong DII* participation , have built a stable domestic capital base , reducing reliance on FII flows and volatility, thereby supporting sustained IPO activity and strengthening investor confidence as capital markets stabilise Capex - driven capital demand • Manufacturing expansion, infrastructure spending, and sectoral growth are increasing capital requirements, directly translating into higher reliance on equity markets for funding corporate expansion and balance sheet strengthening Asset monetisation framework • ~INR 5.8T monetisation under **NMP 2.0 by NITI Aayog is expected to deepen capital markets by increasing listed InvIT *** and REIT**** supply , improving liquidity and price discovery, and strengthening investor participation, thereby creating a more robust environment for IPO activity and stable capital market coming forward Note(s): *Domestic Institutional Investor, **National Monetisation Pipeline, ***Real estate investment trusts, ****Infrastruc tur e investment trusts Source(s): SEBI, Secondary research, 1Lattice analysis © 1Lattice | 13 Why do bankers and businesses rely on 1Lattice for IPO/ ECM support Customized Comprehensive Accurate & Rich Data Credible • Differentiated and rigorous • Custom - made Industry • Public reports launched • Participated in 150+ deals approach by In - house team report basis business in association with in last 2 years across objectives leading industry bodies sectors • Integration of 1Lattice IP, and organizations primary research (including • Flexibility and • Strong capabilities expert calls), secondary and promptness enable • Deep expertise across across buy side and sell company data (as required) deeper engagement with sectors, quoted in various side work the business media publications • Complete adherence to • Dedicated leadership code of conduct • Understand the nuanced • Easy trace - ability of with experienced team in needs of report to research and sources sector and Industry report • Tech - enabled access showcase business making control of client documents, strength and advantages material • Access to knowledge • Alignment to business base and experts • Working - group channel for pace for reports seamless interaction © 1Lattice | 14 What We Do Making organizations effective through data - driven insights, innovative products solutions and proven Vision expertise to enable better decisions 4 200+ To provide technology led solutions that unlock that Offices Annual power of trustable data, actionable research, and Mission in India engagements deep network of experts 130+ 50+ Team Inhouse members research team Technology 1,000+ 2M+ On - ground B2C Panel Data + Accumulated People/ Professionals/ staff knowledge Service providers 300K+ 100K+ B2B Panel Experts & professionals 100% 20% Controlled output Cost savings & timeline Research We are here for you Let us know how we can meet your business requirement? Praneet Singhal Leela Kiran Achanta Senior Director – Technology & Internet and ECM Associate Director – Technology & Internet and ECM E: praneet.singhal@1lattice.com E: kiran.achanta@1lattice.com @1lattice.com For media queries, please contact Corporate Communications E: communications@1lattice.com www.1lattice.com Disclaimer: This material has been prepared by 1Lattice, which is the trade name of Lattice Technologies Private Limited (“1L att ice”, “we” or “our”) with the intent to showcase our capability and disseminate learnings to potential partners/clients. This material can be referred to by the readers on the internet but should be referenced to 1L att ice, if reused or adapted in any form, or medium and on any forum. The frameworks, approaches, tools, analysis and opinions are solely 1Lattice’s intellectual property and are a combination of the collection of the best data we could find publicly, and the 1Lattice team’s own experiences and observations. Any information provided herein is only for informational purposes and you are advised to perform an independen t a nalysis of the same before making any decision based on such information. The information does not constitute any business advice or guidance and is to be construed as a general summary based upon the pu bli cly available information and our interpretation of the same using our resources. For this material, we may have relied upon different sources of information which may be primary sources, publicly available info rma tion, and relevant information available with us. We make no representation or warranty, expressed or implied, that such information is accurate or complete, and nothing conta ine d here can be construed as definitive predictions or forecasts. Before reading further, the Recipient expressly agrees that this might not address any and all risks and challenges facing the Recipient, its busines s, and the markets within which it operates, nor all possible market conditions. Any use of the information provided herein by the viewer shall be at the sole risk of the viewer and 1Lattice or its business partners, affi lia tes, agents, officers or employees shall not be liable for any unintended or adverse effect or outcome from the use of such information by the reader. 1Lattice does not have any duty to update or supplement any information in this document. 1Lattice shall not be responsible f or any business or commercial loss sustained by any person who relies on any information provided herein. Any and all logos of companies used in the information provided herein have been published for information purposes only and 1La ttice does not hold any liability in connection therewith. +91 995 810 0839 praneet .singhal @1lattice.com Delhi NCR | Mumbai | Bengaluru | UAE | KSA | Singapore