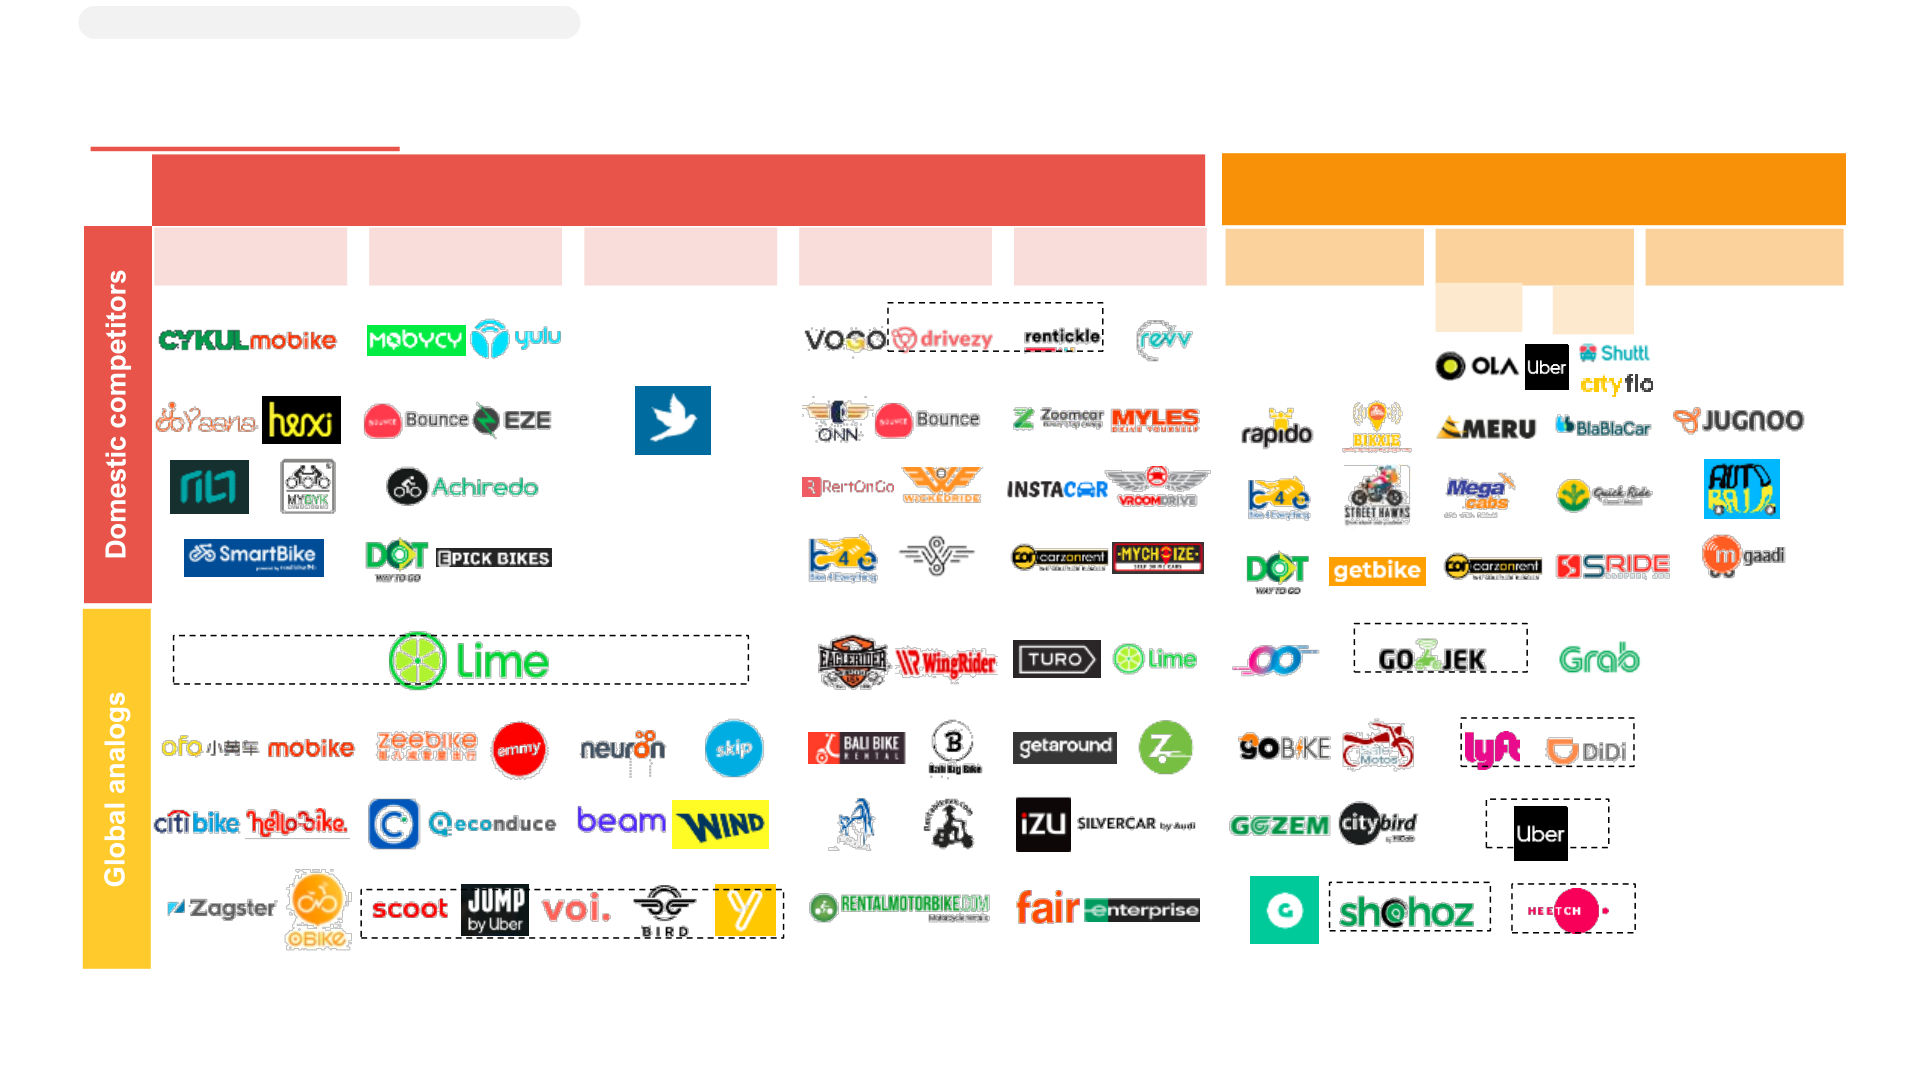
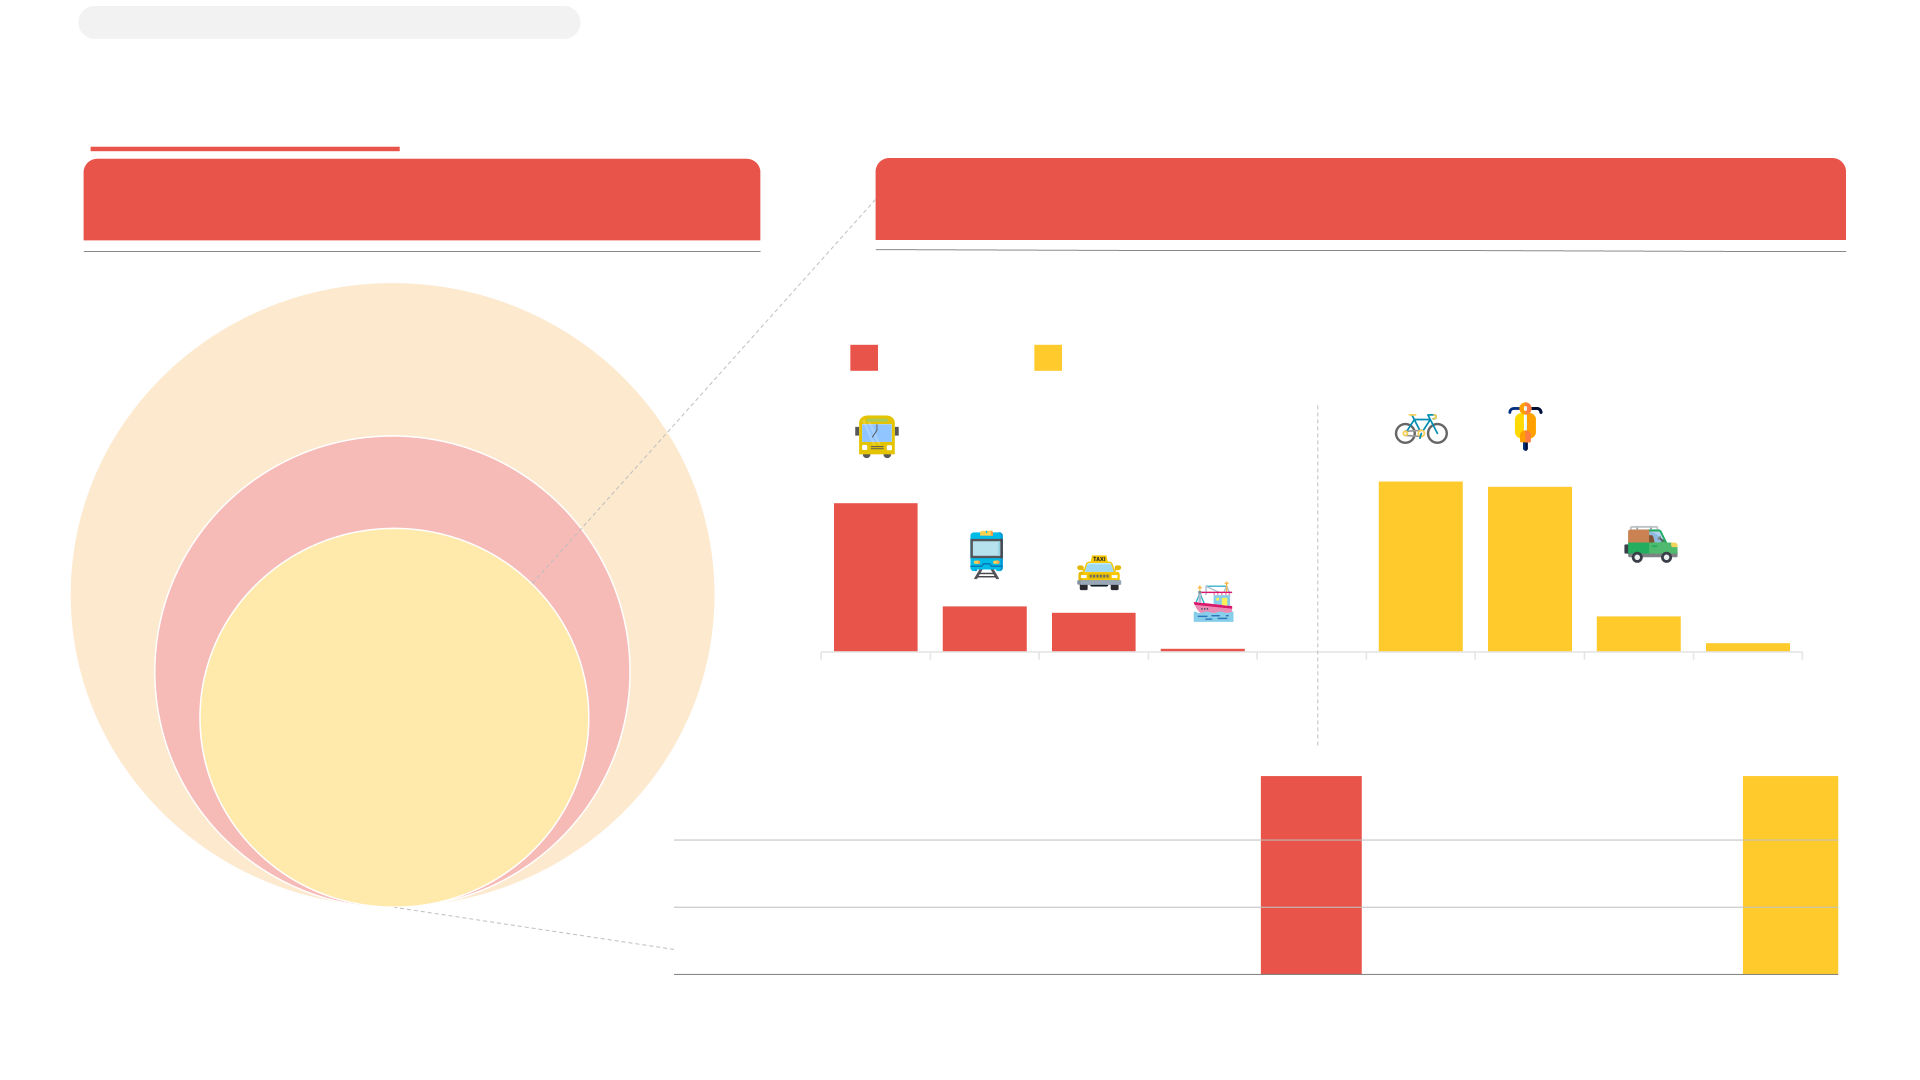
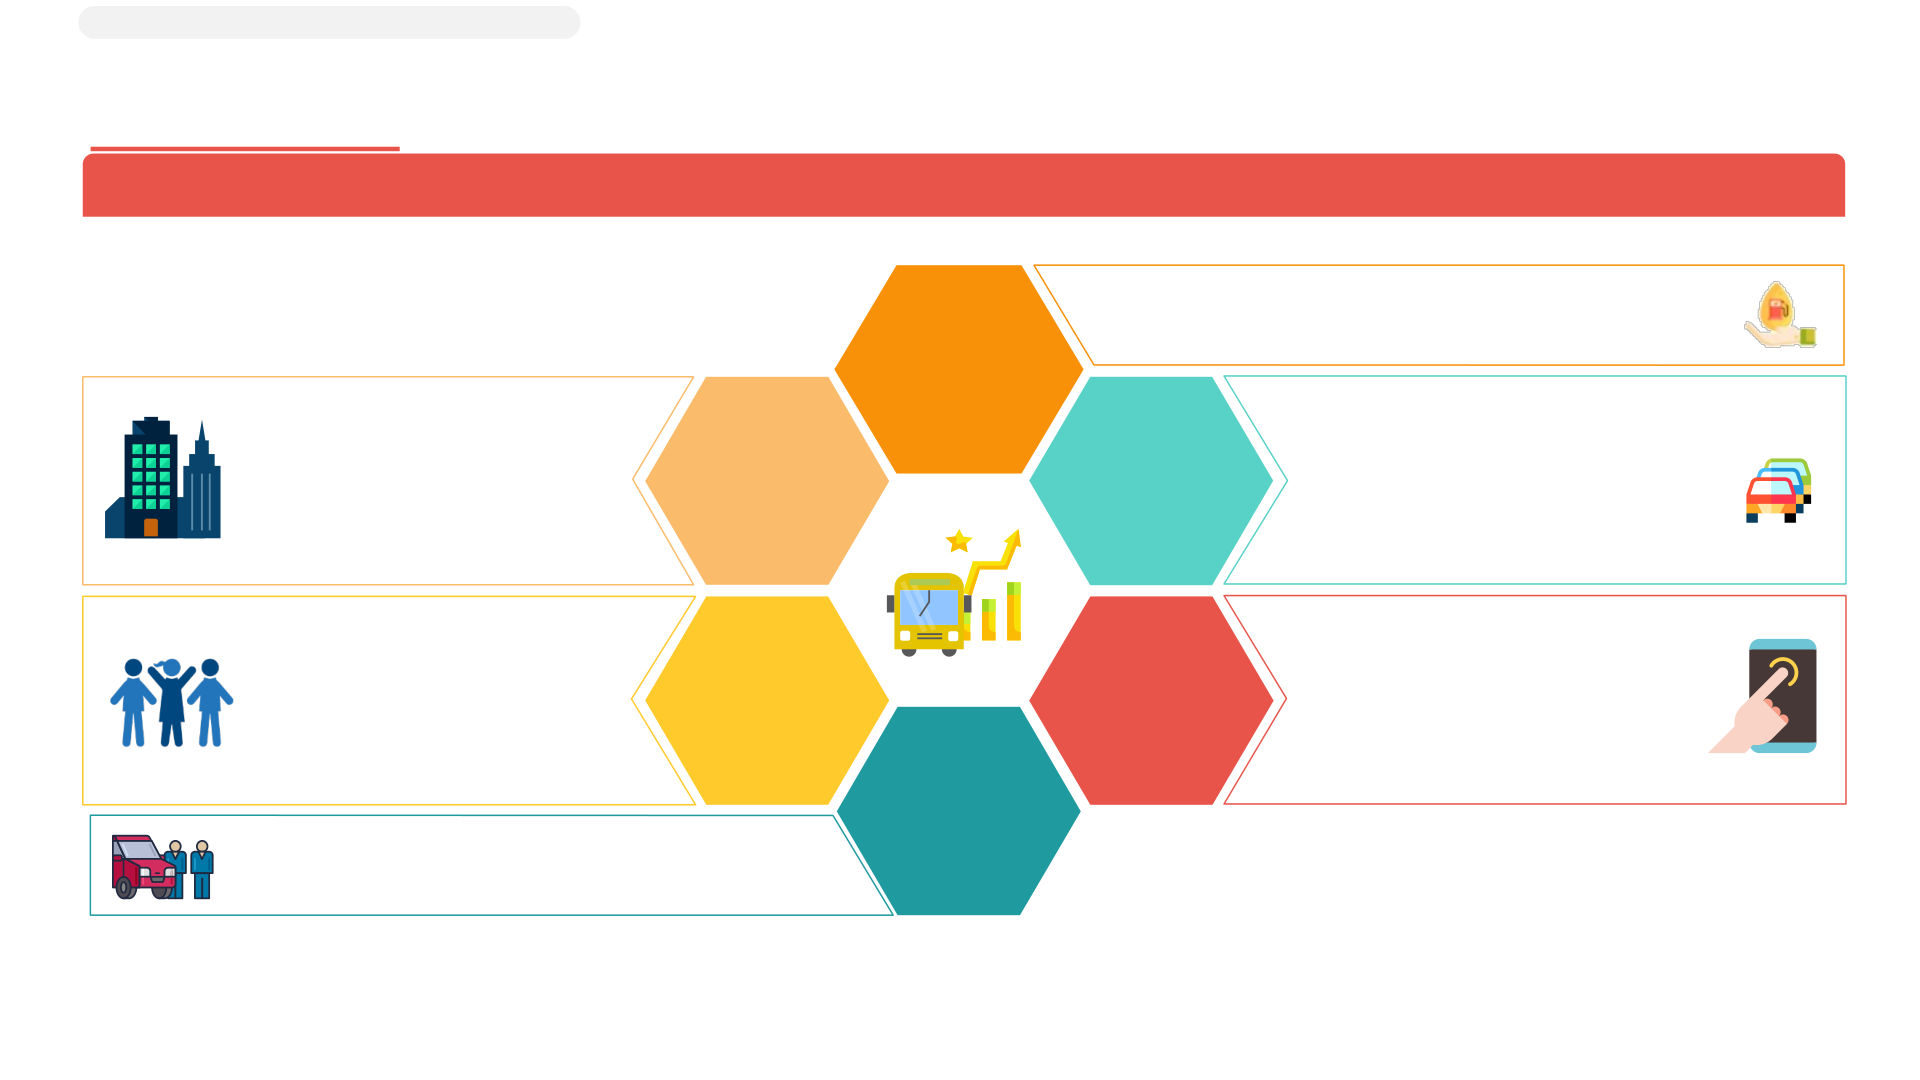
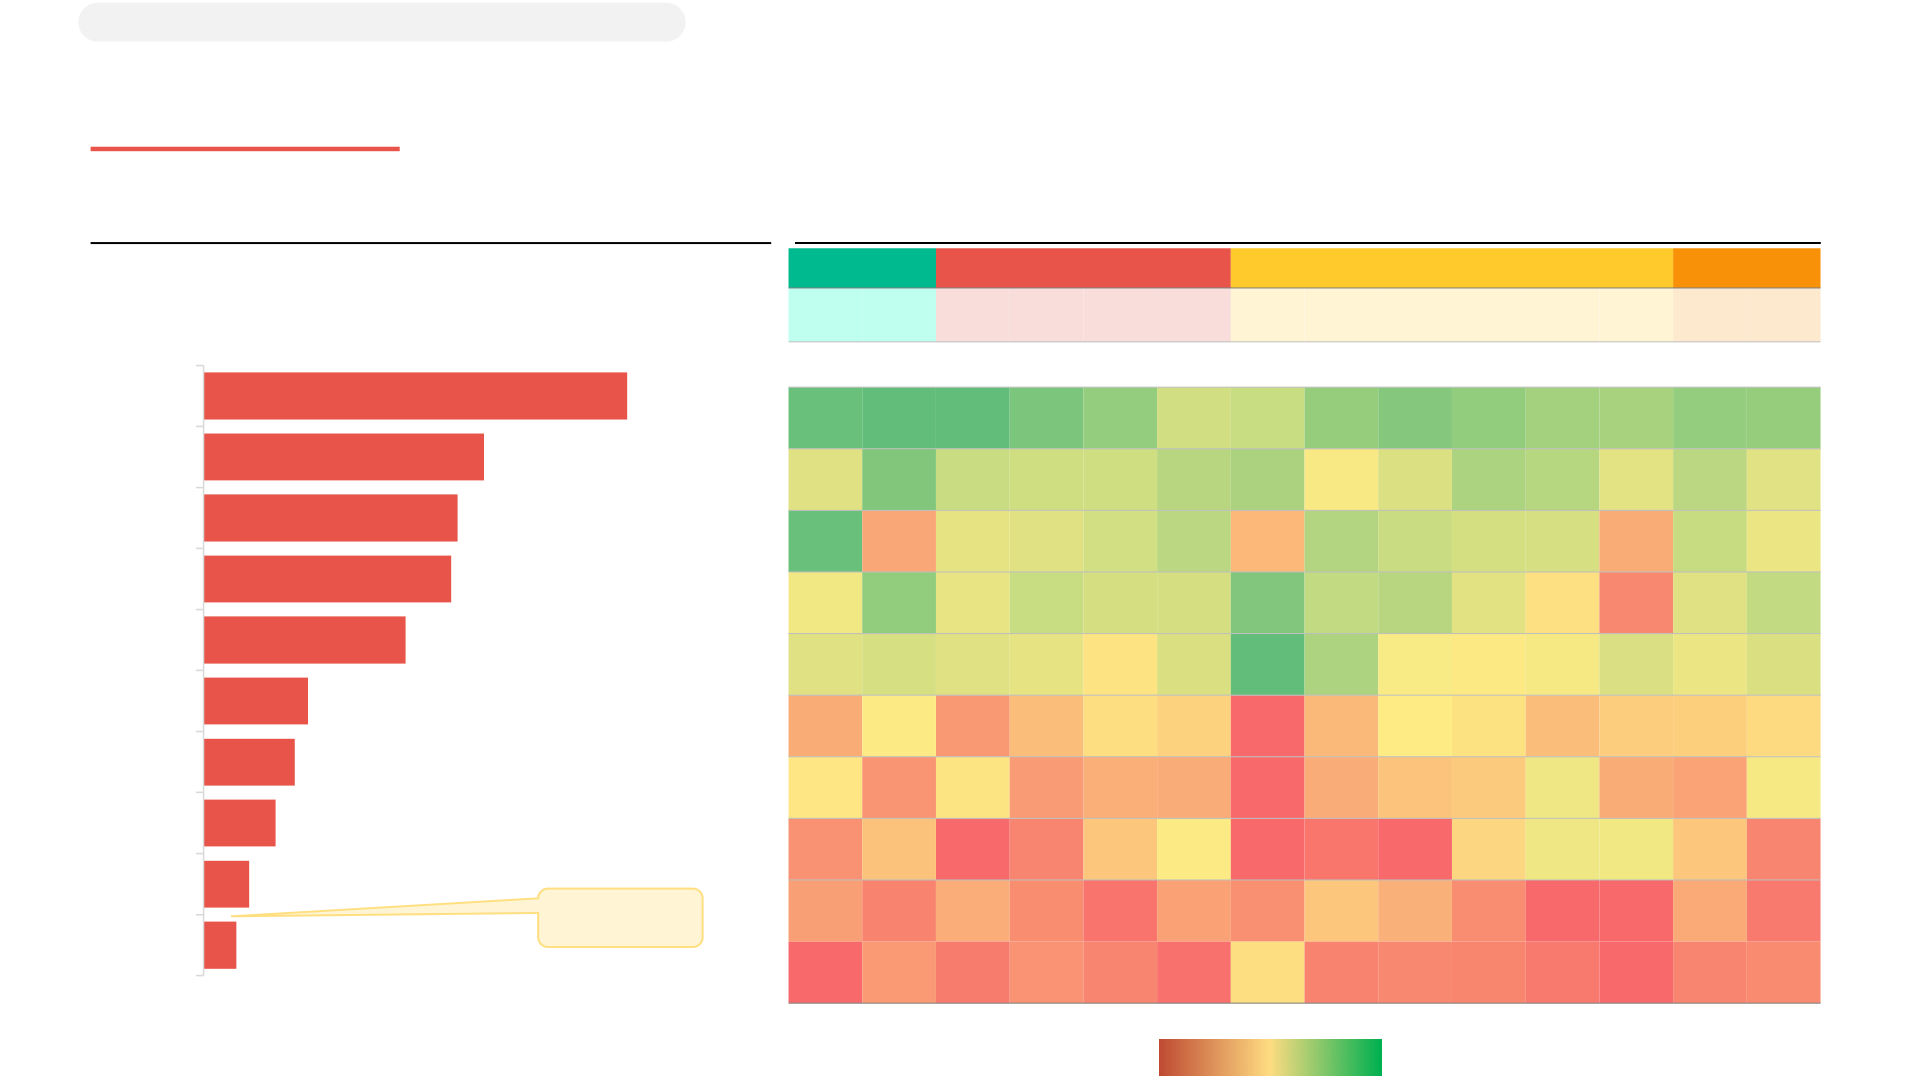
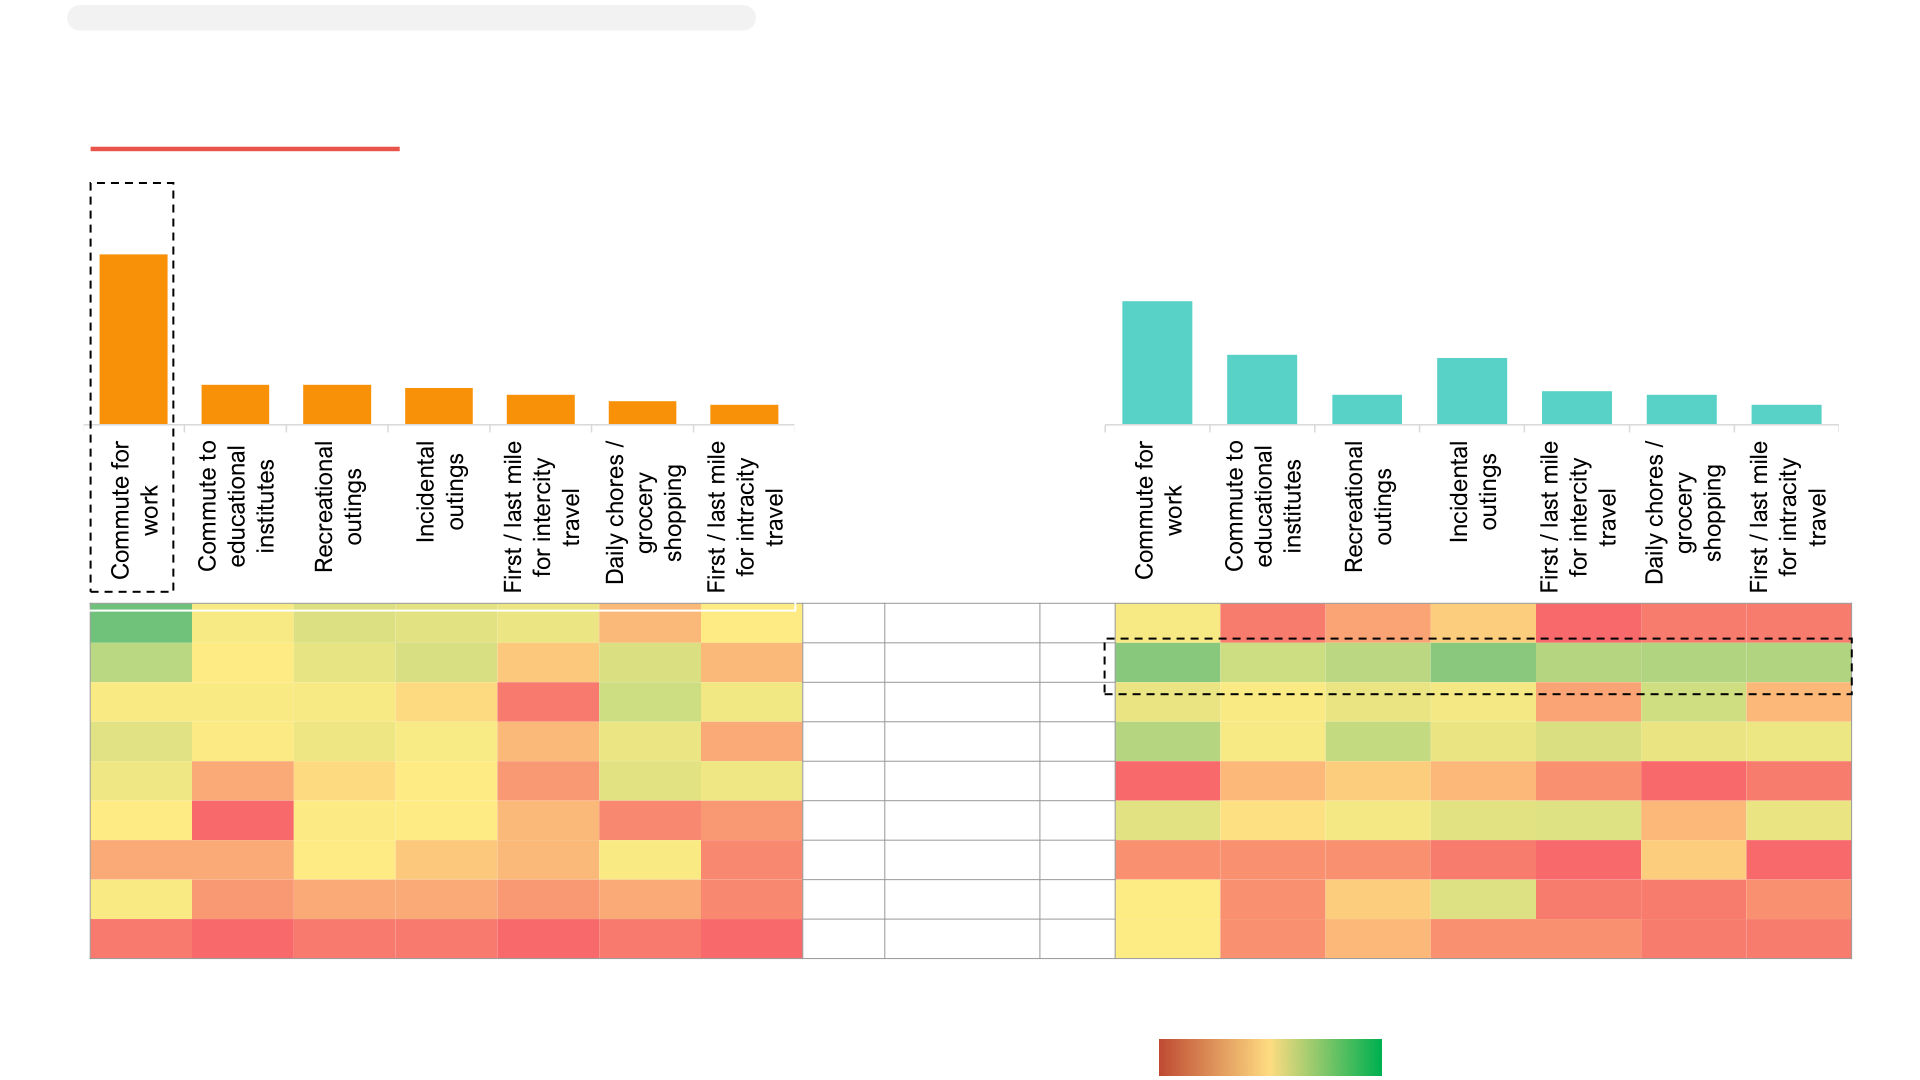
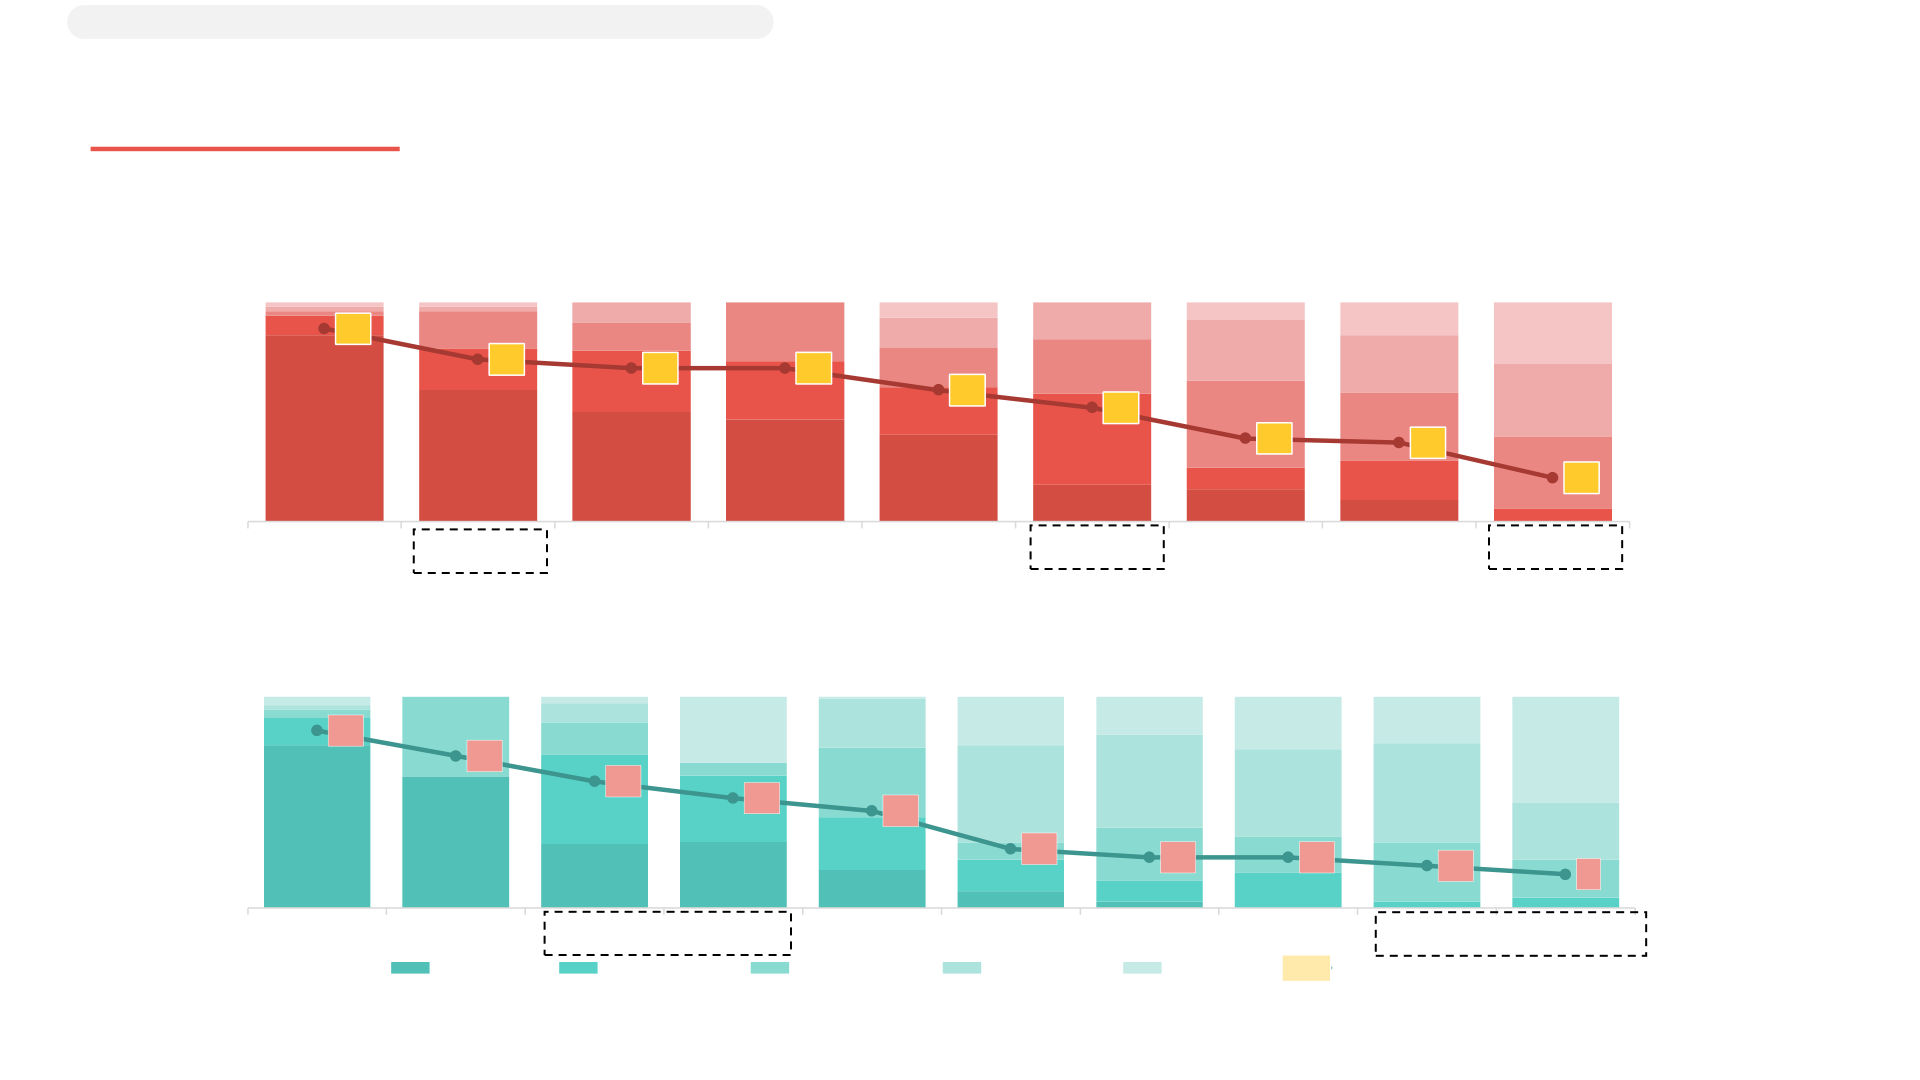
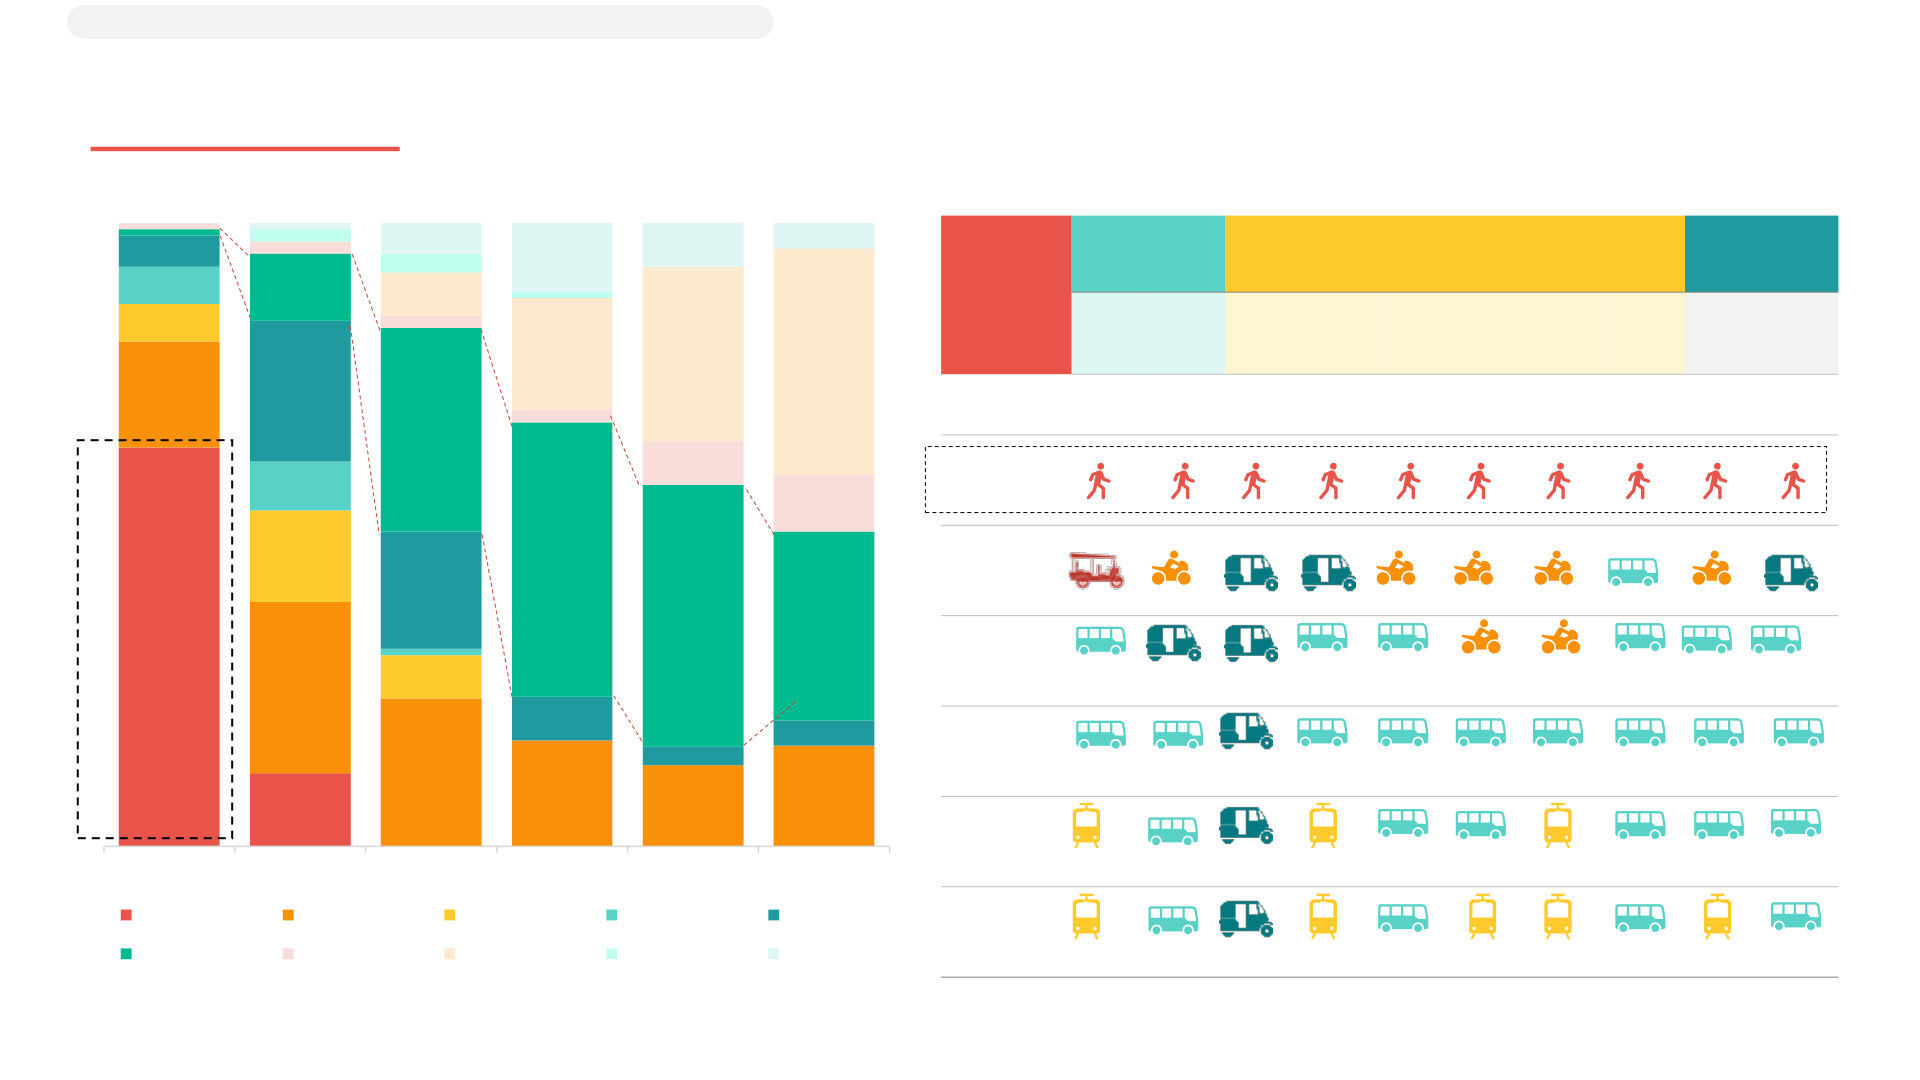
Shared road mobility market in India Growth drivers and underlying opportunities in India's shared mobility ecosystem October 2020 Confidential and proprietary © Praxian Global Pvt. Ltd. Foreword The shared mobility market in India is largely untapped. The huge have covered how the intensity of impact will vary across Q1 - Q4 for population of the country coupled with a rapid increase in the year 2021, and how the employees of the shared mobility urbanization has led to more and more individuals adopting to companies will be affected. We have examined the parameters of various modes of transport, ranging from personal transport to choice for local and outstation commuters, and how that varies with public. The increase in mobile penetration and availability of cheap different modes of transportation. We have also highlighted how the data has led to an advent of several ride - hailing and rental platforms advancements in technology – back - end operations, and route in the country, with affordability as the central offering. Although the planning, ticketing are impacting customer acquisition. An overview penetration of the latter is low, various socio - economic factors such of difference in offerings between organised and unorganised as sustainability act as compelling reasons to make customers aware players gets a mention in the report as well. We have outlined some on shift from personally owned to shared transport. key emerging opportunities that the stakeholders can benefit from. This report is intended to provide various industry stakeholders The situation is evolving rapidly, and some of the expected scenarios including business leaders an overall perspective on the shared might have slight variations. This report reflects our perspectives as st mobility ecosystem in India. In the section on “Consumer behaviour of 1 August 2020. Please contact us for latest updates. – use cases, frequency, spend, KYC”, we have discussed how the customer persona is evolving, and how their needs are changing. We, at PGA Labs, look forward to continuing the discussion with our friends across sectors and exchanging notes as the situation evolves. We also discuss how the current economic crisis is different from previous ones and India’s likely recovery scenario. In the section on “Implications on shared mobility due to COVID - 19 outbreak”, we _____________________ _____________________ Madhur Singhal Aryaman Tandon Managing Director Practice Director, Automotive © PGA Labs | 2 Disclaimer • This report has been prepared by Praxis Global Alliance, which is the trade name of Praxian Global Private Limited (“Praxis”) that presents our point of view on the relevant topic, industry or function . If you have received this report, you agree to indemnify Praxis, its affiliates, employees, directors, suppliers and business partners of all claims whatsoever in connection with this report, and, agree to unilaterally waive all rights to claim any damages from Praxis for the contents in the report . If you disagree with this, please don’t move to the next page and delete this report copy immediately . • The frameworks, approaches, tools, analysis and opinions are solely Praxis’ intellectual property and are a combination of collection of best data we could find publicly and Praxis team’s own experiences and observations . The data presented here are best estimates and we do not represent them to be factually accurate . • We make no representation or warranty, expressed or implied, that such information is accurate or complete, and nothing contained in here can be construed as definitive predictions or forecasts . Before reading further, you expressly agree that this might not address any and all risks and challenges facing any particular industry or player, its business and the markets within which it operates, nor all possible market conditions . • No responsibility or liability whatsoever is accepted by any person including Praxis or its Business partners and affiliates and their respective officers, employees or agents for any errors or omissions in this document . • This document is not complete without an accompanying oral discussion and presentation by Praxis though we are not obligated to do so . Praxis does not have any duty to update or supplement any information in this document . © PGA Labs | 3 Table of content [1/3] 1 Glossary 2 Sources of Input 3 Executive Summary 4 Market Overview 4.1 Context 4.2 Current regulatory framework for shared mobility ecosystem 4.3 Market definition 4.4 Key players snapshot 4.5 Underlying opportunity 4.6 Growth drivers 4.7 Market size & growth Scope Model wise attributes Comparative market size of all modes Segmentation by ride volume, vehicle mode, operation type, region of operation, city type, age, organization, ride fare Segmentation by booking channel (Online / Offline) Mode wise growth rate 5 Consumer behaviour and personas 5.1 Mode wise consumer preference 5.2 Mode wise segmentation by trip purpose © PGA Labs | 4 Table of content [2/3] 5.3 Mode wise spread of ride frequency per month (Metro, Tier - I 5.4 Mode preference by commute distance 6 Segment deep dives 6.1 2W rental and taxis Market tailwinds and headwinds Market size Competitive overview Unit economics for 2W rental Unit economics for 2W taxi Models in 2W industry Case Study - Rapido 6.2 4W taxis Market tailwinds and headwinds Market size Use case analysis for aggregators Product category wise penetration Competitive overview Unit economics for aggregators Models in 4W taxi © PGA Labs | 5 Table of content [3/3] 6.3 4W taxis Case Study – Aggregators 6.4 4W buses Market tailwinds and headwinds Market Size Models in 4W buses Model wise customer satisfaction Model wise tech penetration Competitive overview Value offering comparison between tech players Scope for tech intervention in bus operations 6.5 3W autos and rickshaws Market Overview 6.6 Unit economics for 3W auto 7 Trends and implications 7.1 Investment overview and themes 7.2 Implications on shared mobility due to COVID - 19 outbreak 7.3 Key implications and takeaways 8 Report Credits 9 About Praxis © PGA Labs | 6 GLOSSARY Glossary Term Description Central Business Economic hubs in a city - usually the prime location for offices, factories, shopping complexes, educational institutions etc. District # passenger kms Number of kms travelled by a passenger on an annual basis # seats / ride Number of passengers carried per ride # seats Number of passenger rides Average fare / seat Average fare per seat per ride per passenger Cab aggregator Organization that connects people providing cab services or rentals (like OLA, Uber etc.) with people on an online platform Cost of congestion Economic costs of congestion factoring in productivity loss, air pollution costs, cost due to accidents and cost of fuel wast age Direct revenue Revenue earned from routine activities of the business MaaS Mobility as a Service Organized Organized sector is a sector where the employment terms are fixed and regular, and the employees get assured work Ride sharing Refers to non - commercial services like carpooling and vanpooling Ride splitting Refers to commercial services which enable users to connect with local drivers and share a common vehicle for commute Ride - hailing Services that use online - enabled platforms to connect between passengers and local drivers using their personal vehicles. 2W rental 2Ws rented on hourly / distance basis which are to be driven by self 4W rental 4Ws as taxi service on hourly / rental basis which are chauffeur / driver driven Gross cost model Privately owned, operated buses contracted by Urban Local Bodies (ULBs) and paid on kilometer basis; no private incentive Net cost model Privately owned, operated buses contracted by Urban Local Bodies (ULBs) on a revenue sharing model Shuttle service A transit service that happens between one point to another STU State Transport Undertaking Unorganized Refers to sector where the employment terms are not fixed and regular / are not registered with the government CAGR Compounded Annual Growth Rate st st FY Indian financial year starting April 1 of one year and ending on 31 March of the next year Note(s): Source(s): © PGA Labs | 7 SOURCES OF INPUT Sources of input: We scoured through numerous institutional and company resources and validated our findings by gathering data from surveys, platforms Service providers - Institutional resources Primary surveys Data platforms Company filings, website, mobile applications • Population Census - 2011, • Daily commute survey (N = • Traxcn • Bounce • Uber India 301) across metros (N = • TOMTOM Traffic Index • Yulu • Ola • World Bank Reports 155) and tier - 1 cities (N = • TechCrunch • VOGO Electric • Ministry of Road Transport & 146) • Crunchbase • Onn • Lithium Highways, India (MORTA) • Trip purpose and payment • Pitchbook • Drivezy Urban • International Association of mode survey - Ola, Uber (N • Statista • Rapido Tech Public Transport (UITP) = 518) • Moody’s Analytics • Ontrack • Hippo • Ministry of Urban • Customer sentiment - 2W • World Bank database • Royal Cabs Development, India rental players Brothers • Savaari • Registrar of Companies • Primary conversations with • BikeGo ! • Blu (ROC) private and public bus • Wickedride • Chalo • State Transport Undertaking drivers (N = 11) • ePoolers • Shuttl (STU) websites • QuickRide • Riddlr • Competition Commission of • Ola • Cityflo India (CCI) • Easy Commute • Jugnoo © PGA Labs | 8 Executive summary [1/2] • Modes of transport for daily commute seen across India are 6 in number, in order of decreasing market size: buses (US$ 36B), aut o - rickshaws (~US$ 20B), taxis(~US$ 20B), rickshaws (~US$ 7B), trains(~US$ 1B) and 2 - wheelers (~US$ 0.15B) • 83% of daily commute market is public transport, 75% commute is intra - city with highest mobility seen in age group 20 - 29 years • Fares per ride across all modes lie between US$ 0.1 - 0.4; 75% of market is unorganized, and ~6% ride bookings happen online Market overview and consumer behaviour • Daily commute market grew by CAGR 10% from FY16 to FY19 with highest growth rates across 2W, 4W taxi, auto segments • For distances up to 1 km, walking is the preferred form of commute and buses are chosen for distances >5 km. Personal 2W are hig hly popular across metro and tier - 1 cities with use up to 10 km of distance. Dominant trip purposes are for education and work. • Price per ride is a critical KPC (key purchase criteria) and spend per trip is usually in range of INR 11 - 20 • Largest market share of 2W taxis (US$ 105M) followed by self - rentals which is led by unorganized players (US$ 26M), followed by on - demand instant rental players like Bounce, Vogo (US$ 23M) and mid - term hourly rental players (US$ 0.9M) • Segment is witnessing players like Bounce explore new business models like EV - led mobility solutions and local, kirana partnerships which 2W taxis & rental can chart a route to sustainable unit economics • In terms of competition, Vogo offers the lowest price whereas Bounce has the widest geographical coverage & dockless parking • Largest market share of maxi cabs (US$ 8B) followed by private cabs (~US$ 8B), ãggregators (~US$ 3B), public cabs (~US$ 4B) • Largest use case of aggregator apps Ola, Uber is recreation indicating arrangement of other modes for regular work / educatio n 4W taxis • Emerging business models in electric segment like Lithium, Blu are becoming popular as private cab providers © PGA Labs | 9 Executive summary [2/2] • Intracity commute has grown at a CAGR of 7% for state buses and 10% for private players and is growing faster than intercity com mute which is growing at 6% CAGR • The state is rapidly expanding fleet by PPP models of GCC and NCC; GCC has better customer satisfaction than NCC 4W buses • Various tech players like Shuttl , Chalo are providing value - add services to bus operators and commuters but challenges abound • Auto segment with a market size of ~US$ 19B is dominated by 64% share of 3 - seater autos and rest by 4 - 6 autos; rickshaws with a market size ~US$ 7B is dominated by cycle rickshaws constituting 86% share and rest is constituted by electric rickshaws • Market is highly unorganized; only 5% of autos (entirely in 3 - seater) and 1% of rickshaws (entirely in electric) constituted by organized players 3W autos & rickshaws • Market growth rate is high at 12 - 13% and current key players include Jugnoo , Oye Rickshaw, SmartE , Auto Walle • Ola Electric is an emerging player to watch out for in this segment which is planning to develop and launch a full - stack mobilit y solution led by 3W autos by 2021 • Shared mobility in India attracted a total of US$ 4.4B in private equity funding during 2015 - 19 with 80% of funding received by cab aggregator companies, followed by 2W taxi and rental startups which received 13% of total investment Investment trends and Most crucial investments in the space were made in electric mobility companies like Ola’s Mission: Electric, three leading 2W startups including Bounce, Vogo , Rapido and intra - city mass transit platforms like Shuttl COVID - 9 impact • COVID - 19 has greatly impacted the shared mobility market with companies like Bounce, Yulu recording 40 - 50% drop in rides before suspending operations; future investments and consumer favorability likely to be severely compromised © PGA Labs | 10 MARKET OVERVIEW – REGULATORY FRAMEWORK Barring 2W taxi, regulatory framework for other modes of shared mobility is well - defined and is enabling the growth of the segment 2W rental Regulations for cab aggregators Regulations for buses ! The Motor Vehicles Act, 1988, did not ! There are no specific rules regarding bus Usually, minimum number of vehicles registered recognize cab aggregators as separate entities aggregators or other operators of buses as commercial vehicles required to apply for bike thus leading to lack of clarity and (in some cases rental is 5 Buses can either be registered under the temporary bans) Application for bike rental license needs to be 'City permit', 'State permit' or 'All India submitted to the state - level Regional Transport In October 2015, Ministry of Road Transport Tourist Permit (AITP)' based on their intended Office (RTO) . and Highways issued guidelines for states to region of operation regulate cab aggregators which identified Section 75 of the Motor Vehicles Act 1988 Initiative by Niti Aayog has been introduced to themselves as “on - demand information states that bike rentals are allowed in India post provide model concessionaire agreement technology - based transportation aggregators” receiving the required permissions from the (MCA) for introduction of electric bus fleet in regional authorities Motor Vehicles (Amendment) Bill, 2019 cities Under motor Vehicle Act, 1988 , it is legal for the recognized aggregators as digital states to issue taxi permits for two wheelers Ministry of urban development has marketplaces which can be used by passengers proposed INR 250 billion grant for to connect with a driver for transportation development of electric vehicles for public transportation 2W taxis ! As per the Motor Vehicle Act, 1988, the states may issue permits for taxi including those for two wheelers . Since states have the final authority, only 14 states have made bike taxi legal ! For other states, no regulations have been issued . Hence, there is no clarity on legality of bike taxi Positive regulation ! Unclear ! Prohibitive Source(s): PGA Labs analysis © PGA Labs | 11 MARKET OVERVIEW – MARKET DEFINITION There are multiple modes of transports used for daily commute in India with a total of ~13.6M vehicles plying for the same Auto - Transportation type Bus Metro / local trains 4W Rickshaw 2W Bi - cycle rickshaw (# of vehicles) ( 1,408K) (~1K) (1,519K) (6,075K) (75K) (~3K) (4,435K) • Buses owned and operated Motor cabs ( Kaali peeli / • 4 - 6 seater 100% by STU’s • Local suburban trains • Cycle Phat Phat sewa ) auto • Buses operated by private (Mumbai, Chennai etc.) rickshaw Maxi cabs • 3 seater x x players under supervision • Metro trains (Delhi, • E - rickshaw Unorganized taxis auto of government STU’s (NCC Bengaluru etc.) or GCC model) • Taxi by online • School buses • Organised players (radio E - bicycle aggregators • Corporate owned buses cabs, Meru) rentals by • Bike rentals • Buses leased to corporate x • Unorganised taxis x x private by private players • Taxi by online cab players players • Bus aggregators ( shuttl ) aggregators • Buses owned and operated • Local suburban trains 100% by STU’s (Delhi, Mumbai, Chennai • Maxi cabs • Buses operated by private etc.) x x x x players under supervision • Metro trains (Delhi) of government STU’s Organised players (radio • Buses owned and cabs, Meru)* operated 100% x • Unorganised taxis* x x x x by private players • Taxi by online cab aggregators* © PGA Labs | 12 Note(s): *represents the cabs / taxis used in metro cities for transit from one city to another (Delhi NCR, Mumbai and Thane etc.) Source(s): PGA Labs analysis MARKET OVERVIEW – KEY PLAYERS SNAPSHOT Apart from own transport and public transport, consumers now have several options for commuting through app - based ride hailing and rental Rental Ride Hailing E - bicycles and Bicycles E - kick scooters 2Ws 4Ws 2Ws 4Ws 3Ws e - mopeds Ride Pool Source(s): Secondary research, Tracxn , Praxis analysis © PGA Labs | 13 MARKET OVERVIEW – UNDERLYING OPPORTUNITY Shared mobility accounts for a small share of travel by Indian worker population currently and presents a huge untapped opportunity Use of shared transport modes is limited and within shared transport, Of the total worker population, <50% uses a vehicle to travel to work most of the workers rely on buses Mode of transport for workers who travel (% people) Total worker population of India Shared Mostly non - shared Total = 95M outside agriculture & household industries = 200M 28% 27% Workers who 24% n eed to travel = 140M 7% 6% 6% Workers who use 1% 1% a vehicle to travel (i.e. who do not travel on foot) Bus Train Taxi / Water Bicycle 2-Wheeler Car / Any other = 95M auto transport Jeep / Van # people (M) 21 7 6 1 35 27 26 6 1 60 Average spend 0.6 1.7 1.9 NA 4.2 0 0.3 1.9 NA 2.2 per ride (US$) Total spend (US$ 3.8 3.4 3.2 NA 10.4 0 2.1 2.7 NA 4.8 B) Source(s): TOMTOM traffic index , Population census, PGA Labs analysis © PGA Labs | 14 MARKET OVERVIEW – GROWTH DRIVERS There are inherent tailwinds in the market that will make shared mobility a way of road transportation in the future Drivers for shared mobility market in India • Reduction in number of vehicles used for solo travel can reduce fuel consumption as well as overall emission Environmental consciousness • # cities with population >1M • Budget 2017 - 18 provides optimism has increased from 35 in 2001 to for the roads and highways sector 53 in 2011 Increasing with a total of outlay of US$ 14B . Improved road • Overall share of urban trend of infrastructure • NHDP is being implemented NHAI, population estimated to urbanization under which ~49,260 km of roads are increase from 30% in 2011 to being upgraded 40% in 2030 • ~50% Indian (650M) population <25 years • Smartphone penetration increased Technology • Higher propensity to adopt from 9% to 30% during 2013 - 18 Growing younger technology and new trends (e.g. adoption • Internet penetration increased from population moving away from asset 15% to 35% during 2013 - 18 ownership) Govt initiatives • Govt. has plans to increase proportion of shared passenger kilometres from 10% in 2017 to 50% by 2050 Source(s): Uber, Population Census, World Bank, PGA Labs analysis © PGA Labs | 15 MARKET OVERVIEW – MARKET SIZE - SCOPE Defining scope of daily commute market size Market element In market size Not included in market size • Public – Bus • Maxi cabs • Private cars • Private – Bus (8 – 50 seaters) • Cab aggregators • Private 2W • Metro train • 4W taxis • Flights • Local trains • 4W rentals • Helicopter • Auto (3 seaters) • 2W taxis • Cruise and boats Mode of vehicles • Auto (4 - 6 seaters) • 2W rentals • Walking • Rickshaw and e - rickshaw • E - bicycle – rentals • Private bicycle • Car pooling – private • Trains – Inter city • Public owned and operated • Private owned under public • Private owned and operated • Personal Operation type operation • Intra - city • Inter - city for daily commute • Inter - city for other purposes Geography of operations • Office / college • Daily chores (grocery • To and from railway / • Incidental travel within • Recreational activity and business commuters shopping etc.) bus station, airport city (doctor visits etc.) trips outside city Customer type • India • Rest of the world Geography Source(s): PGA Labs analysis © PGA Labs | 16 MARKET OVERVIEW – MARKET SIZE – MODE WISE ATTRIBUTES Shared daily commute market in India is ~US$ 83B; private intra - city bus and rickshaw see highest number of passengers Includes corporate, and aggregator buses Auto - Bus Trains 4Wheeler Rickshaw 2Wheeler rickshaw Intra - city Inter - city daily Taxi Local Aggreg Public Private Maxi 4 - 6 Cycle E Private - Public - Public Private Metro 3 - seater Taxi School Others Rental Total Rickshaw trains ators cabs cabs^ cabs seater rickshaw Stage Stage # # 13,587 347 31 430 172 132 367 0.5 ~0.5 223 30 669 597 2,847 1,588 4,725 750 13 65 8.1 * 14 14 2.5 2.5 4 2 20 15 15 15 4 6 10 10 13 13 30 2 6.1* 49 59 47 33 22 43 389 1,740 2 2 2 13 2 8 1.5 4.5 1 1.25 0.35* 0.15 0.15 0.42 0.83 0.5 0.6 0.46 0.1 1.2 1.1 4 0.5 0.57 0.14 0.14 0.14 0.7 0.9 ~83 13 1.4 7.8 4.3 2.1 6.9 0.6 0.5 3.1 0.35 7.8 8.4 11.9 7.3 4.7 2.2 0.1 0.05 ~83 14.4 12.1 9 1.1 11.3 8.4 19.2 6.9 0.15 ~US$ ~US$ 35.5B ~US$ 1.1B ~US$ 19.7B ~US$ 19.2B ~US$ 6.9B ~US$ 0.15B 83B Note 1: # indicates total buses plying for inter - city commute, indicates passengers using inter - city buses for daily commute, * Numbers mentioned are weighted averages across commute modes, indicates both organized (Meru, Megacabs , TravelHouse ) and unorganized cars Public Transport Private transport # vehicles (‘000) # trips / vehicle / day # passenger / trip / vehicle / day F are / passenger / trip (US $) Annual revenue by vehicle mode (US $ B) Revenue by sub - category (US$) Revenue by vehicle Source(s): MORTH, Census 2011, UIPT India, Ministry of urban development, PGA Labs Analysis © PGA Labs | 17 MARKET OVERVIEW – MARKET SIZE = COMPARITIVE ANALYSIS Shared daily commute is a US$ 83B market in India with buses comprising a whopping 43% followed by 4W taxis at 24% Market overview by revenue for different modes of transport in % Total ~US$ 83 B (# of vehicles, FY19) 2W Rental, Intra city – Contract private and aggregators, 12% (172K) 31% Cab aggregators, 16% (223K) (65K) Public motor cabs, 2% (30K) Auto - rickshaw 4 - 6 seater, 37% E - rickshaw, Local (1,588K) 32% Intra city – Contract school buses, 22% (430K) trains, (750K) 41% (~5K) Private motor cabs, 40% (669K) Inter city – Private contract, 20% (367 K) 2W Taxi, 69% (13K) Inter city – Public contract, 6% (132 K) Auto - rickshaw 3 seater, 62% Rickshaw, (2,847K) 68% Metro, (4,725K) 59% Maxi cabs, 42% (597K) Intra city – Private stage, 36% (347K) (5K) Intra city – Public stage, 4% (31K) 2W Trains Taxi Auto Rickshaw Bus © PGA Labs | 18 Source(s): MORTH, Census 2011, UIPT India, Ministry of urban development, PGA Labs analysis MARKET OVERVIEW – MARKET SIZE - SEGMENTATION By revenue, daily commute market is ~75% intracity, ~24% organized and ~35% in US$ 0.1 - 0.4 per ride fare range Daily shared commuter market Passenger rides US$ 83B (280B) US$ 83B US$ 83B US$ 83B US$ 83B US$ 83B US$ 83B 2W, 0.1% 2W, 0.2% <0.5M population , 1% Metro / train , 2.2% Metro / train , 1.3% 0.5 - 1M population 3% >US $ 1 (>INR Rickshaw , 8.3% 50 - 59 years , 10% Private , 17% 70) , 13.6% Rickshaw , 17.7% Inter - city , 25% 1 - 2M population , 20% US$ 0.71 - 1 (INR 40 - 49 years , 14% 49.01 - 70) , 5.3% Auto , 23% Auto , 24.0% 30 - 39 years , 18% Unorganized , 75.5% US $ 0.4 - 0.7 (INR 2 - 4M population , 28.01 - 49) , 46.0% 36% 4W, 24% 4W, 7.5% 20 - 29 years , 26% Public , 83% Intra - city , 75% 4 - 8M population , 23% Bus , 48% Bus , 43% US $ 0.11 - 0.4 (INR 5 - 19 years , 32% Organized - offline , 7.01 - 28) , 34.5% 19% >8M population , 17% <=US$ 1 (<INR 7) , 0.6% Online , 5% # rides by volume Vehicle mode Operation type Region of operation City type Age Organized Fare per ride Source: MORTH, Census 2011, UIPT India, Ministry of urban development, Praxis analysis © PGA Labs | 19 MARKET OVERVIEW – MARKET SIZE – SEGMENTATION BY CHANNEL ~6% of US$ 83B daily commute market is booked via online and additional ~19% of the market is organized Market overview by online and organized play for daily commute in % (FY19) US$ 5B , US$ 17B , 19% US$ 63B , 75.5% 5.5% US$ US $ US$ US$ US$ US$ US$ US$ US$ US$ US$ 13B US$ 12.1B US$ 6.9B 1.2B 2.1B 1.4B 3.1B 2.2B 4.7B 8.3B 8.1B 11.8B 7.2B 10% 40% 75% 100% 95% 95% 99% 100% 100% 90% 100% 90% 100% 100% 100% 24.5% 58% 5.5% 25% 5% 5% 5% 2% 5% 1% Online Organized – Offline Unorganised – Offline Note1: Organized players would be players acting under supervision of a government body (STU etc.) or a private company / LLP Note2: Private player is defined organized if fleet size is >25 vehicles and with infrastructure to oversee daily operations Source(s): MORTH, Census 2011, UIPT India, Ministry of urban development, Praxis analysis © PGA Labs | 20 MARKET OVERVIEW – MARKET GROWTH New categories (like 2W taxi) have been created in the last 4 years Daily commute market size by mode Daily commute market size (US$ B) (US$ B) 89.1 37.2 35.8 83.2 - 3.4% 29 9.5% 62 21.6 20.9 11.3% 11% 14.1 13.7 7.9 16.5% 4.3 10% 95% 1.24 0.85 0.29 0.02 FY16 FY20 FY22E FY16 FY20 FY16 FY20 FY16 FY20 FY16 FY20 FY16 FY20 FY16 FY20 FY22E Overall Auto Rickshaw 2W Bus Trains Taxi Source(s): MORTH, Census 2011, UIPT India, Ministry of urban development, PGA Labs analysis © PGA Labs | 21 CONSUMER BEHAVIOR – MODE WISE CONSUMER PREFERENCE Daily commuters use multiple modes; buses enjoy the highest share of use across city affluence, age, income and gender; personal 2W takes up the second place Bus (65%) is the most used mode, followed by Majority of bus users fall in 18 – 34 years age and INR 1 - 5L income; 2Ws (43%) & trains (39%) Most metro commuters use bus & trains, 2W & autos are preferred in tier 1 City Age HHI (Household Income) Gender Modes used for daily commute < 24 25 - 34 35 - 44 45 - 64 < INR INR 1 - INR 2.1 INR 3.1 INR 5.1 > INR Metro Tier - 1 Male Female years years years years 1L 2L - 3L - 5L - 7L 7L Overall (N = 301) 155 146 78 75 92 56 16 47 78 104 37 19 194 107 Bus 65% Personal 2W 43% Train 39% Autorickshaw 38% Walking 31% 4W taxi 16% E-rickshaw 14% Personal 4W 11% Bicycle 7% Low penetration 2W taxi 5% © PGA Labs | 22 % respondents Source(s): Daily commuter survey (N = 301), PGA Labs analysis Low (0%) High (>45%) CONSUMER BEHAVIOR – MODE WISE SEGMENTATION BY TRIP PURPOSE The most popular mode bus is used majorly for commute to work in metro, tier - 1 cities followed by trips for educational purposes; 2W is popular in tier - 1 cities Use cases for bus – Metro (N = 101) Use cases for bus – Tier - 1 (N = 97) 51% 37% 21% 20% 12% 12% 11% 10% 9% 9% 9% 7% 6% 6% Mode of N N commute 101 Train 16 47 Personal 2W 84 47 Walking 48 39 Autorickshaw 77 32 E - rickshaw 12 18 4W taxi 32 15 Bicycle 8 12 Personal 4W 22 2 2W taxi 13 © PGA Labs | 23 % mentions Note: Overall N for metros = 155; Overall N for tier - 1 = 146 Source: Daily commuter survey (N = 301), PGA Labs analysis Low (0%) High (>45%) CONSUMER BEHAVIOR – MODE WISE RIDE FREQUENCY PER MONTH Personal 2Ws are frequently used in metro cities; public modes - buses, trains are more famous in tier - 1 cities & 4W exhibit lower ridership in tier - 1 than metro Frequency of commute mode use/month: Metro (#, N = 155) 47 47 32 15 101 12 101 39 18 2% 2% 2% 2% 7% 9% 8% 15% 2% 17% 9% 44 17% 27% 14% 28% 13% 28% 37 25% 35 35 18% 19% 26% 28% 27% 30 33% 26 40% 22% 31% 85% 19 42% 18 33% 60% 47% 50% 40% 10% 10 18% 17% 15% 10% 6% Walking Personal 2W E-rickshaw Bicycle Bus Personal 4W Train Autorickshaw 4W taxi Frequency of commute mode use/month: Tier - 1 (#, N = 146) 48 8 97 16 84 13 77 12 32 22 1% 3% 4% 2% 9% 18% 4% 22% 23% 23% 25% 38% 42 31% 13% 15% 50% 36 6% 33% 30 44% 46% 42% 47% 26 63% 42% 23 31% 77% 27% 25% 25% 17% 14 8% 12 12 10 8 30% 31% 15% 28% 18% 18% 17% 10% 8% 5% 3% 3% Walking Bicycle Bus Train Personal 2W 2W taxi* Autorickshaw E-rickshaw 4W taxi Personal 4W > 40 rides 21 - 40 rides 11 - 20 rides 6 - 10 rides 1 - 5 rides xx Avg frequency Note(s): *2W taxi N (=2) is unrepresentative; Walking includes first / last mile commute as well © PGA Labs | 24 Source(s): Daily commuter survey (N = 301), PGA Labs analysis CONSUMER BEHAVIOR – MODE PREFERENCE BY COMMUTE DISTANCE Walking is the most popular form of commute if trip distance <1 km; public form (train, bus) penetration increases as distance increases Most preferred mode of transport (N = 301) 1% 1% 2% 4% 1% 5% 7% 5% 2% City Household income Gender 11% 3% 6% 11% 7% 1% Distances < INR INR 1.1 INR 2.1 INR 3.1 INR 5.1 > INR 6% 2% Metro Tier - 1 Male Female 1L - 2L - 3L - 5L - 7L 7L 18% 28% 36% 23% 17% N 155 146 16 47 78 104 37 19 194 107 2% 33% 7% < 1 km 8% 9% 15% 44% 1 - 2 km 19% 42% 30% 64% 1% 2.1 - 5 km 7% 28% 7% 4% 5.1 - 10 km 3% 24% 17% 16% 13% 12% 10.1 - 20 km < 1 km 1 - 2 km 2.1 - 5 km 5.1 - 10 km 10.1 - 20 km > 20 km Walking Personal 2W E-rickshaw Bicycle Autorickshaw > 20 km Bus Personal 4W Train 2W taxi 4W taxi *Icons indicate preferred mode of transport Note: 66% percent of respondents are bus users Source: Daily commuter survey (N = 301), PGA Labs analysis © PGA Labs | 25 CONSUMER BEHAVIOR - MODE WISE SPREAD OF TOTAL MONTHLYSPEND AND SPEND PER RIDE Personal vehicles (4W, 2W) result maximum expense on monthly basis followed by 4W taxis; majority of population spends INR 20 - 40 per trip Total monthly spend – overall (N = 301) Average monthly spend (INR) N = 34 131 50 117 44 198 15 116 23 1% 4% 2,000 4% 2% 7% 7% 9% 11% 8% 12% 20% 14% 1,693 24% 21% 33% 1,500 21% 10% 14% 35% 18% 12% 52% 1,234 21% 18% 87% 22% 1,000 28% 22% 23% 18% 34% 47% 684 22% 598 557 22% 500 22% 14% 440 413 22% 32% 293 12% 21% 7% 8% 9% 14% 9% 1% 6% 5% 8% 7% 4% 35 0 1% Personal 4W Personal 2W 4W taxi Train E-rickshaw Bus 2W taxi Autorickshaw Bicycle > INR 2,000 INR 1,001 - 2,000 INR 501 - 1,000 INR 301 - 500 INR 201 - 300 INR 101 - 200 < INR 100 Avg spend Spend per trip (INR) Average spend per N = 34 50 131 15 117 116 44 198 23 trip 2% 4% 4% 3% 2% 5% 6% 7% (INR) 216 9% 16% 12% 7% 14% 200 16% 26% 17% 13% 18% 16% Further breakdown : 24% 150 30% 40% 27% 45% 40% 87% • INR 60 - 100: 12% • INR 100 - 150: 21% 17% 45% 100 96 • INR 150 - 200: 9% 71% 27% 25% 14% 18% 21% • > INR 200: 29% 50 49 40% 43 42 18% 16% 10% 31 26 20% 18% 16% 9% 17 4% 10% 5% 4% 3% 2 0 Personal 4W 4W taxi Personal 2W 2W taxi Train Autorickshaw E-rickshaw Bus Bicycle > INR 60 INR 41 - 60 INR 21 - 40 INR 11 - 20 INR 6 - 10 < INR 5 Avg spend per trip Note: Walking as a mode of transport has been excluded since monthly spend is 0 © PGA Labs | 26 Source: Daily commuter survey (N = 301), PGA Labs analysis CONSUMER BEHAVIOR - MODE WISE PRICING PER KM BY TECH PLAYERS We estimated the fare per km per trip charged by various service providers across all modes Fare per km per seat in FY19 (INR) 10 DTC buses are 8.6 cheaper than other forms and hence enjoy higher ridership and market size 6.8 5.5 5.1 5 5 4.5 4.4 4.2 3.7 1.7 Uberpool Ola Taxi-A.C Meru Shuttl DTC- A.C Govt. auto Jugnoo Bounce Vogo Rapido UberMoto Taxi - A.C DTC - A.C Taxi share Taxi rental Private bus Auto 2W rental 2W taxi Uberpool Ola Taxi - A.C Meru Shuttl DTC - A.C Govt. auto Jugnoo Bounce Vogo Rapido UberMoto Average distance 4.5 - 5 13 13 13 20 15 7 7 10 20.5 5 3.5 per trip (KM) © PGA Labs | 27 Source: Company website, PGA Labs analysis CONSUMER BEHAVIOR - USE CASES, FREQUENCY, SPEND, KPC Bus is the most preferred & cheapest public commute mode for longer distances & immune to weather changes; trains & e - rickshaws are better to navigate traffic Parameters Bus Train Autorickshaw E - rickshaw Price / ride fare 55% - 31% - 11% 25% Usability in bad weather 35% 10% 33% 14% - 25% Usability for large travel distance 20% 31% - 38% 12% Ability to cross - utilize travel time 11% 4% 11% Access to transport 9% 1% 19% 7% - 16% Effect of speed on travel time 9% 29% - 7% 8% 17% 3% Safety (proneness to accidents) 11% Number of payment failures 7% - 8% 4% - 2% Availability of transport (wait time) 5% - 9% Customer service 4% 20% Ease of booking rides / tickets 3% - 10% - 7% Effect of route on travel time 2% 14% 6% 5% Availability of subscription plans / passes 1% - 17% - 22% - 18% Comfort 1% 4% 7% 5% Ease of identifying route / schedule 1% - 3% - 17% - 9% Exposure to pollution - 27% - 34% Reliability of transportation - 2% 1% 2% 2% Safety (danger of pickpockets) - 3% - 17% 9% - 5% Representative behavior - 6% - 1% - 10% 0% - 8% Profile of co - riders - 5% - 2% 3% Vehicle condition and quality - 8% 1% 2% 9% Number of payment options - 10% - 11% - 5% - 11% Availability at odd times - 29% - 29% 35% 25% Privacy - 33% - 29% - 3% 0% Availability of seats - 34% - 9% Ability to navigate through traffic - 35% 38% 13% 16% © PGA Labs | 28 Source(s): Daily commuter survey (N = 301), PGA Labs analysis CONSUMER BEHAVIOR - USE CASES, FREQUENCY, SPEND, KPC Among smaller commute modes, 4 W are better long distances & round the clock availability but are costly & parking is a concern for personal 4W Parameters 4W taxi Personal 4W 2W taxi Personal 2W Bicycle Availability at odd times 27% 17% 39% 30% 35% Customer service 27% 26% Usability in bad weather - 33% - 40% - 48% 44% 24% 0% Access to transport 18% Privacy 22% 26% 31% 16% Safety (danger of pickpockets) 0% 17% 23% 12% 29% Representative behavior 0% 12% Vehicle condition and quality 0% 9% 6% 11% 10% Usability for large travel distance - 27% - 83% - 35% 10% 50% Ability to cross - utilize travel time 0% 0% - 11% 6% - 24% - 48% Effect of speed on travel time 27% 24% 4% 26% Safety (proneness to accidents) - 7% - 24% - 4% 2% 6% Comfort 33% 13% 9% 16% 2% Effect on fitness 43% - 47% - 43% Exposure to pollution - 53% Danger of theft of vehicle - 43% - 22% - 15% 48% Ease of parking - 76% 8% Ease of booking rides / tickets - 7% - 4% Effect of route on travel time 20% 9% 25% - 4% 12% Ease of identifying route / schedule 47% - 27% - 4% - 4% - 29% Number of payment options 0% - 6% - 13% Reliability of transportation 0% 9% - 6% 0% Number of payment failures 0% - 10% Availability of transport (wait time) 7% - 16% Availability of subscription plans/passes - 27% - 26% Ability to navigate through traffic 27% 50% 22% - 38% - 26% - 33% Willingness of driver to go destination - 34% - 20% Price / ride fare - 62% - 15% 65% - 36% © PGA Labs | 29 Source(s): Daily commuter survey (N = 301), PGA Labs analysis CONSUMER PERSONAS - SUMMARY Price, time and convenience are the top key parameters of choice for daily commuters; safety is a point of concern for outstation travelers Personas Price conscious, time agnostic Price and time conscious Privileged Pleasure traveller Parameters • Blue, grey collar workers, • White collar workers, Typical profile • Grey - collar workers • Tourists students with low HHIs students with high HHIs • Work in CBD areas; • Work in Central Business • Work in CBD areas, all • Tourism, irregular frequency educational institutions on Trip purpose and frequency District (CBD) areas, all weekdays; recreational depending on age group and weekdays; recreation on weekdays activities on weekends purchasing power weekends Preferred mode of commute • Bus, shared autos • Metro, autos, pool cabs • Private cabs • Autos, taxis Annual income (INR) • 40K - 2.5L • 2.5 - 5L • 8 - 20L • 4 - 8L • Potential rip - off due to lack of awareness of local taxi • Uncomfortable, insufficient • Overcrowding in rush hours • Congestion during peak fares Typical pain points seating • Lack of last mile hours • Lack of credible service • Lack of last mile connectivity connectivity providers causing safety concerns • Driver amenability • Pricing of ride • Skipping traffic Key purchase criteria (KPC) • Convenience • Pricing of ride • Reliability of supply • Pricing of ride • Connectivity of travel mode Extent of tech adoption ◔ ◔ ◕ ◕ ◑ ◑ ● ● Willingness to pay for pain ◔ ◔ ◑ ◑ ◕ ◕ ◑ ◑ point elimination © PGA Labs | 30 Source(s): Industry reports and press releases, PGA Labs analysis Low High ◔ ◔ ◑ ◑ ◕ ◕ ● ● ○ SEGMENT DEEP DIVE – 2W RENTAL AND TAXIS - MARKET HEADWINDS AND TAILWINDS I ndian 2W rental / taxis market faces strong short - term headwinds particularly that of achieving positive unit economics, but long - term growth prospects remain intact Headwinds Tailwinds Use of EV - led mobility solutions to lower operational costs: Bike rental Regulatory hurdles in bike taxi segment: Regulatory challenges companies like Bounce are experimenting with a fleet of electric vehicles including lack of clear regulations at state level on bike taxi to reduce operational costs. Bounce has launched 1,000 e - bikes in operations , and cumbersome process of getting commercial license Bengaluru in 2020 and has seen 3x increase in net earnings of INR 2.5 - 3 for private two - wheelers has created a regulatory grey zone for bike per ride against INR 0.8 per ride on standard bikes . taxi operators. For e.g., in Haryana, only 2,000 yellow number plates have been issued for bike taxis till May 2019, often taking up to 6 Partnership with mom - and - pop stores: Segment is witnessing players months. experiment with newer business models to lower operational costs and Challenge of achieving positive unit economics: While some players expand quickly. Yulu and Bounce have partnered with multiple kirana like Bounce, Vogo , and Yulu have seen tremendous growth in the last 2 - stores (latter has 3,000 partnerships in tier - 1 and tier - 2 cities) which 3 years, segment continues to witness mounting losses with key players act as charging stations and battery changing spots . seeing 9 - 10x increase in losses during FY18 - 19 . Influx of private equity capital: 2W rental space in India has seen Rampant theft and vandalism: Bike rental companies like Yulu and substantial private equity investment in the last 2 years with a total Bounce face repeated instances of fuel theft and asset vandalism investment of US$ 366M made in 2017 - 19 against a mere US$ 5M which cause severe losses for the companies. For Yulu , 300 of its bikes investment in the preceding 3 years . This is expected to give a strong were vandalized, damaged or stolen between January 2018 and boost to this asset - heavy business. May 2019, amounting to losses of INR 40 - 50L. High user preference for 2W as mode of travel to work: A 2016 ICE survey revealed that 36% of Indians in big cities preferred to travel to work using two - wheelers . Key reasons for this behavior include affordability with cost per km for a scooter / bike being ~US$ 0.06 (INR 4.5) and easy manoeuvrability through traffic congestion. Source(s): Industry reports and press releases, Traxcn , PGA Labs analysis © PGA Labs | 31