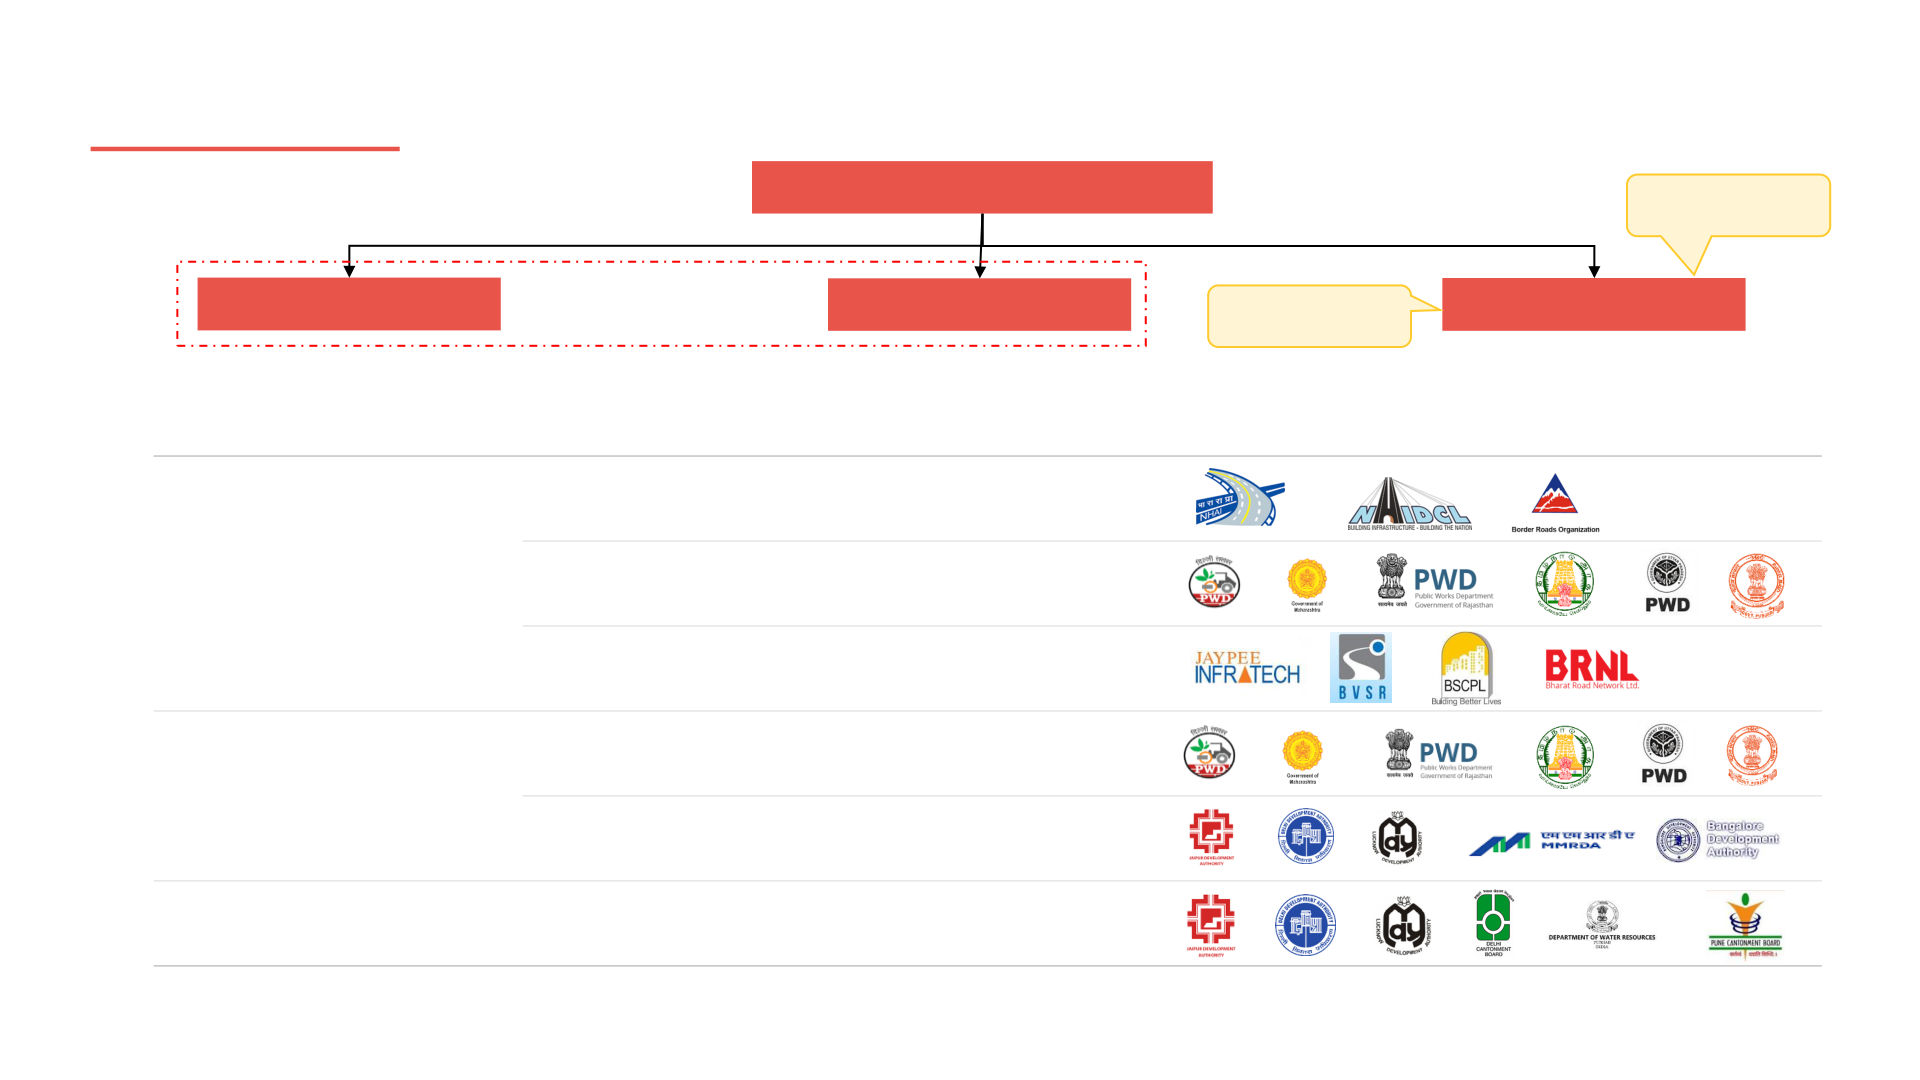
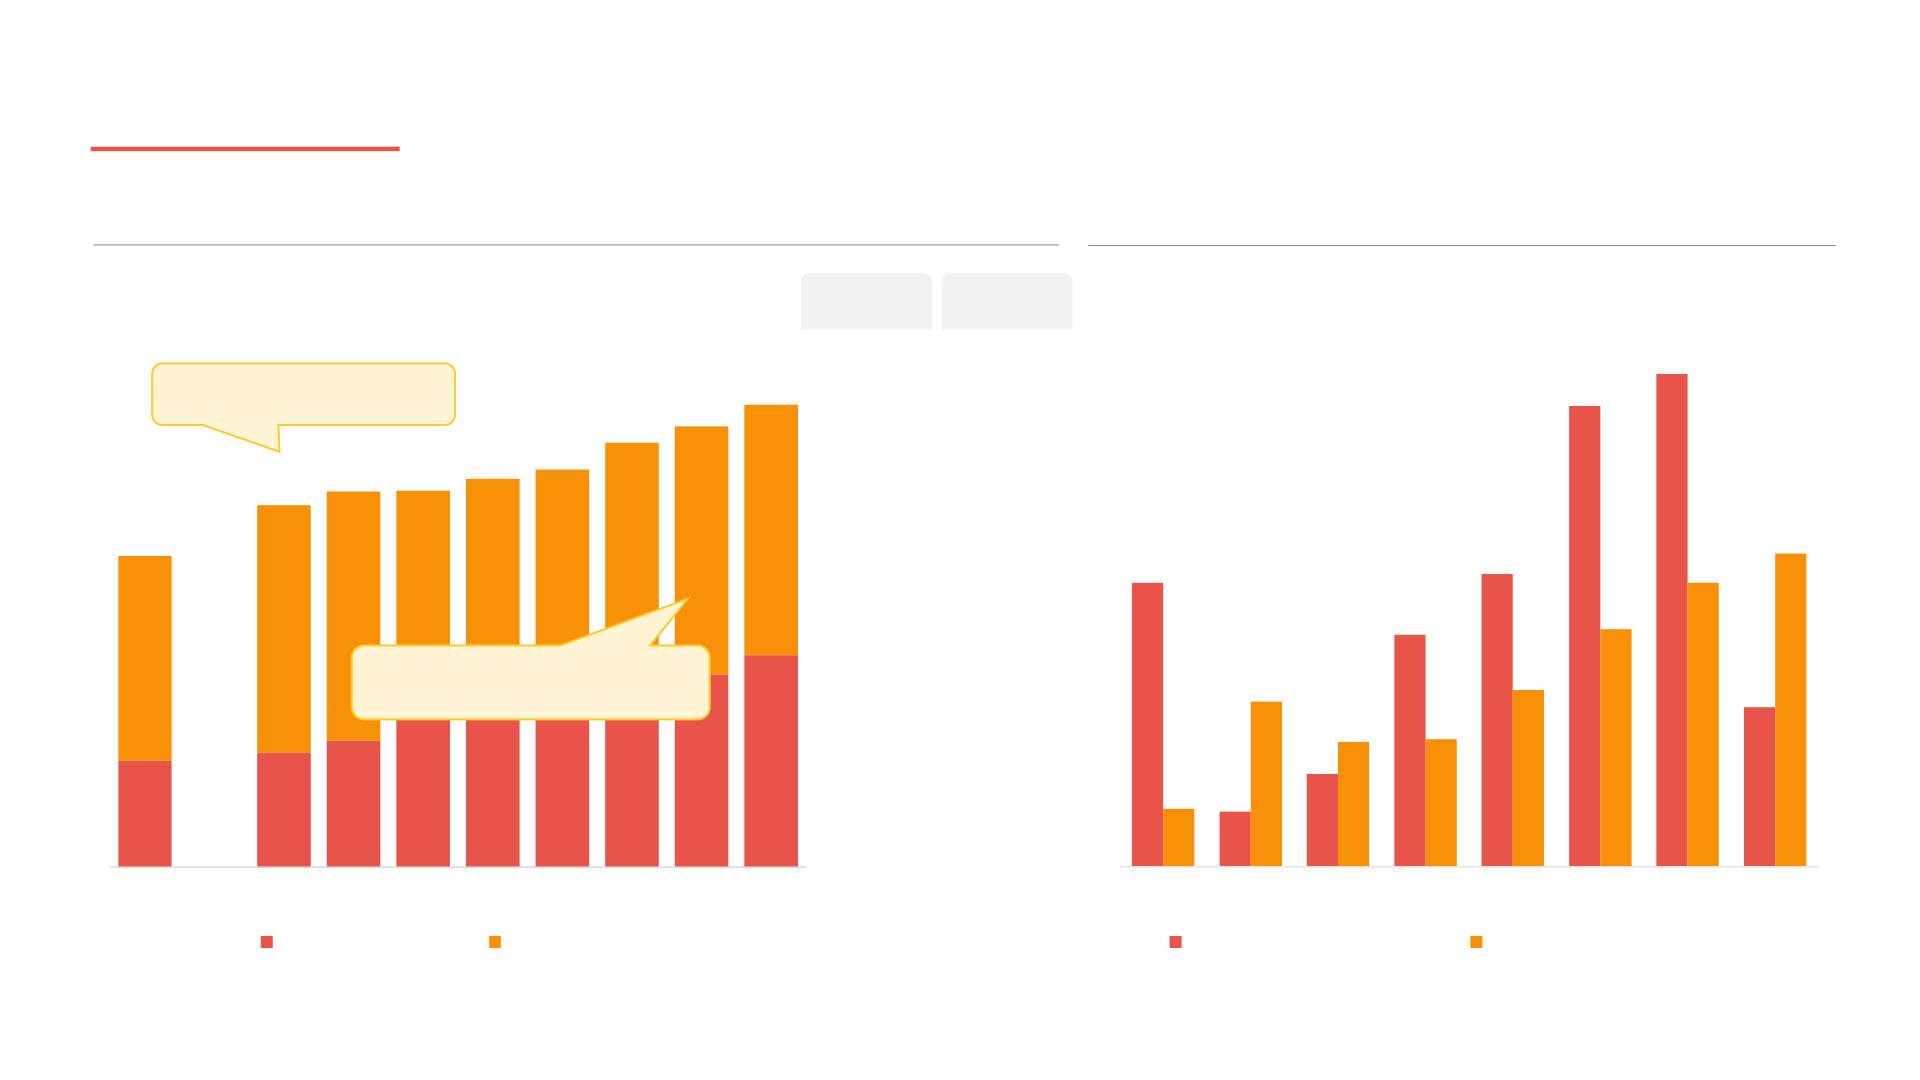
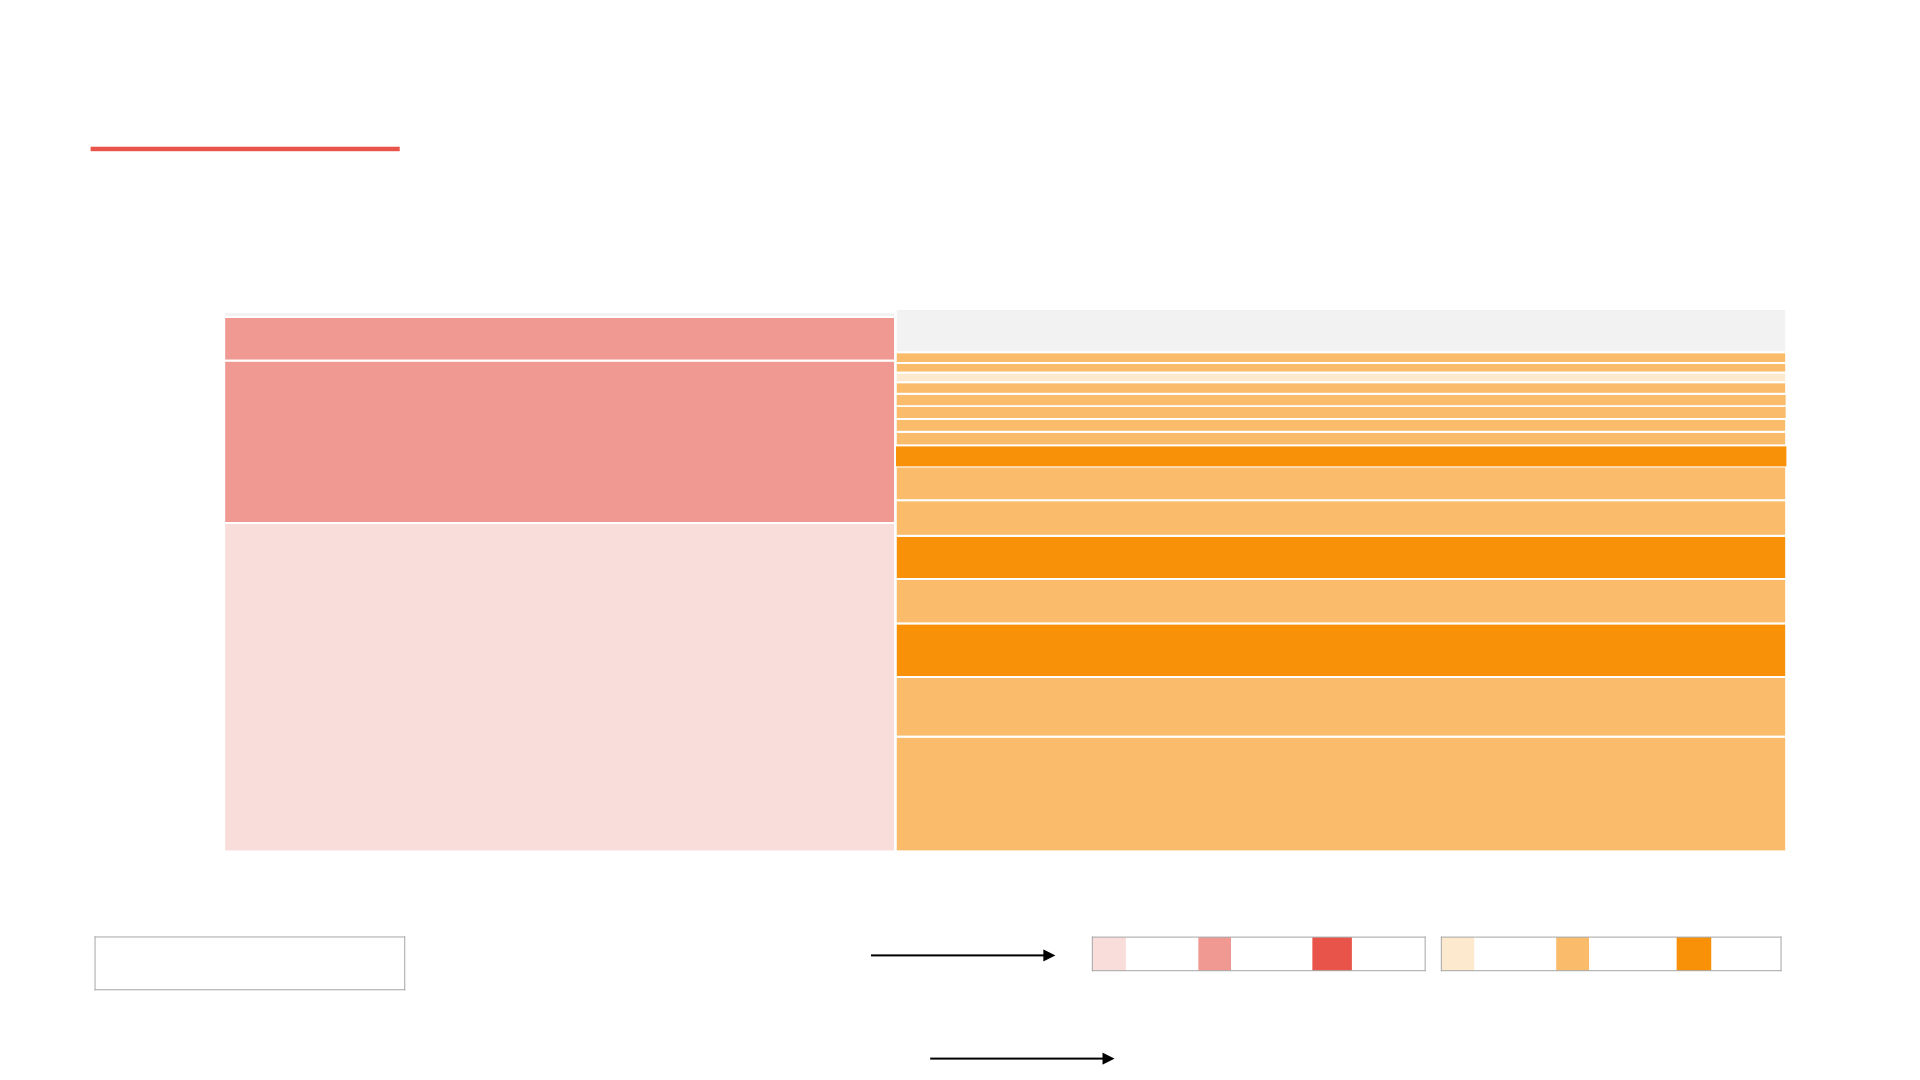
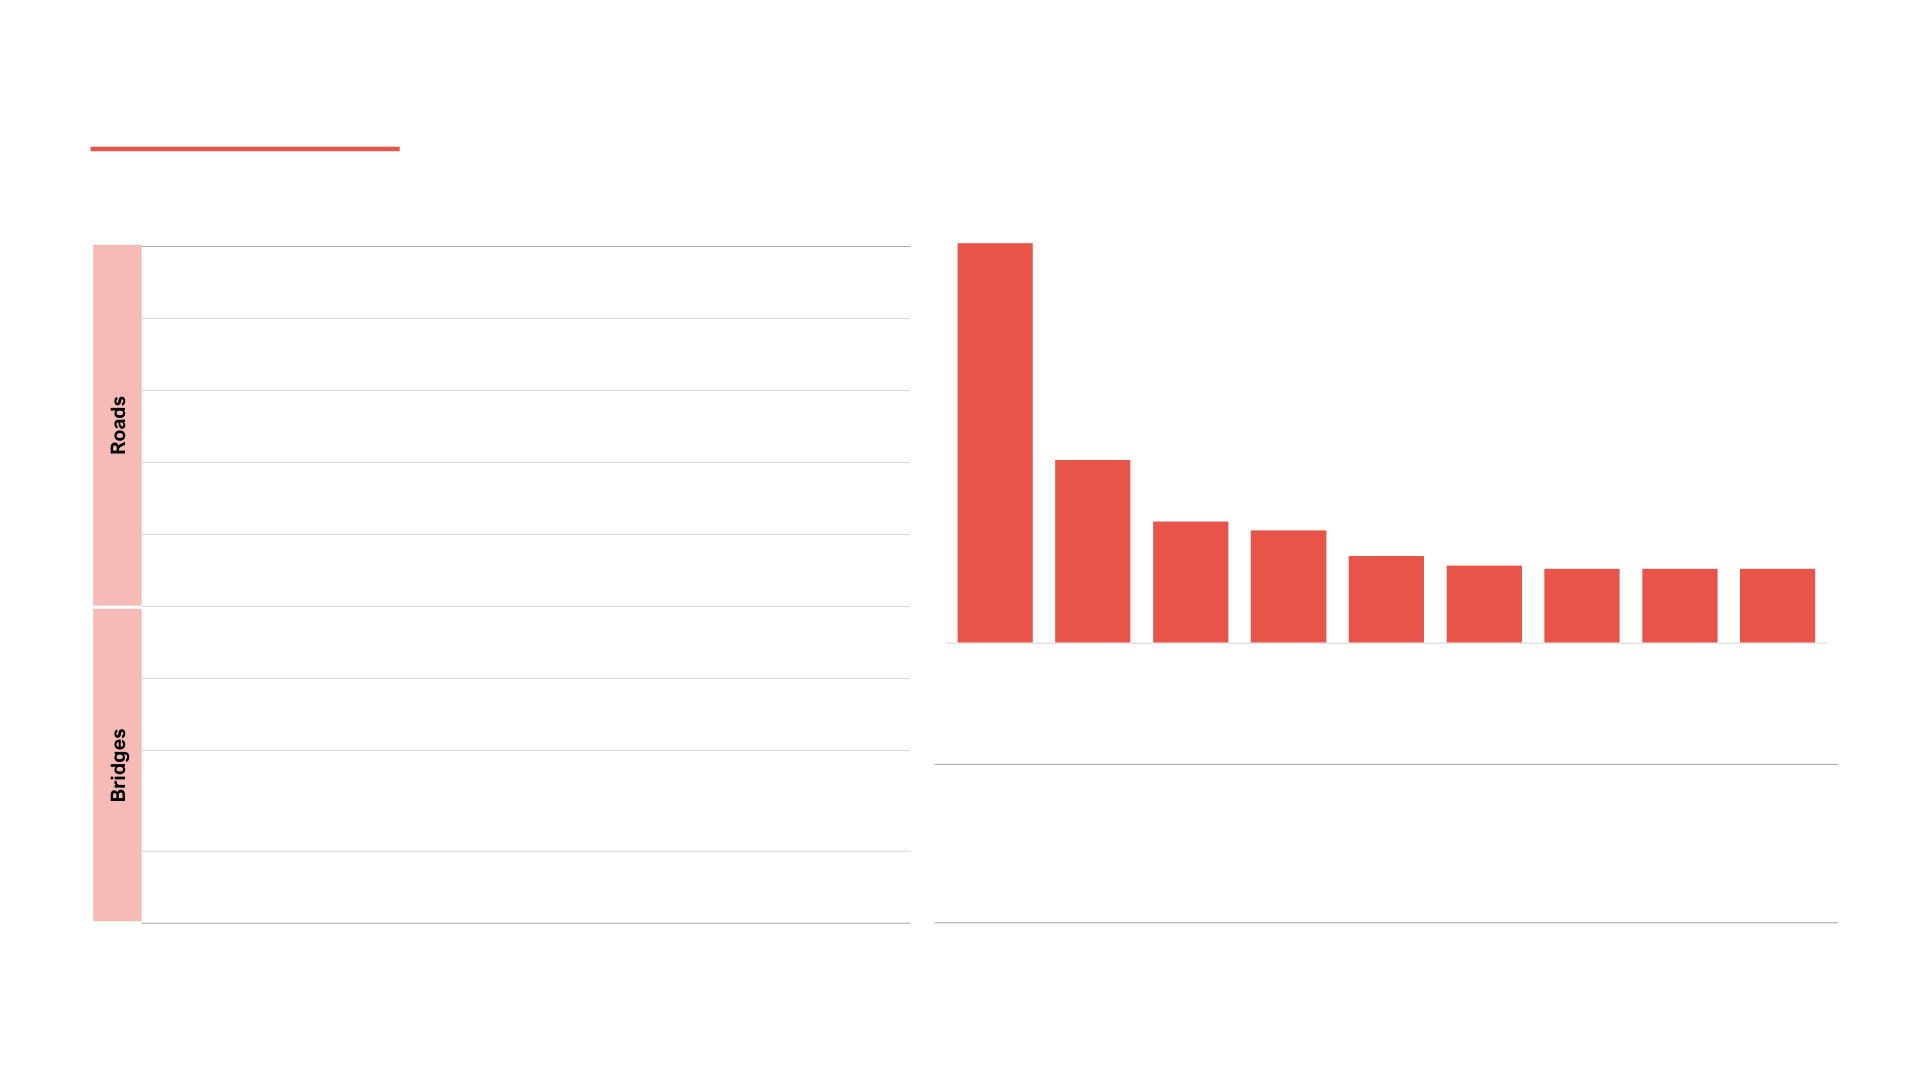
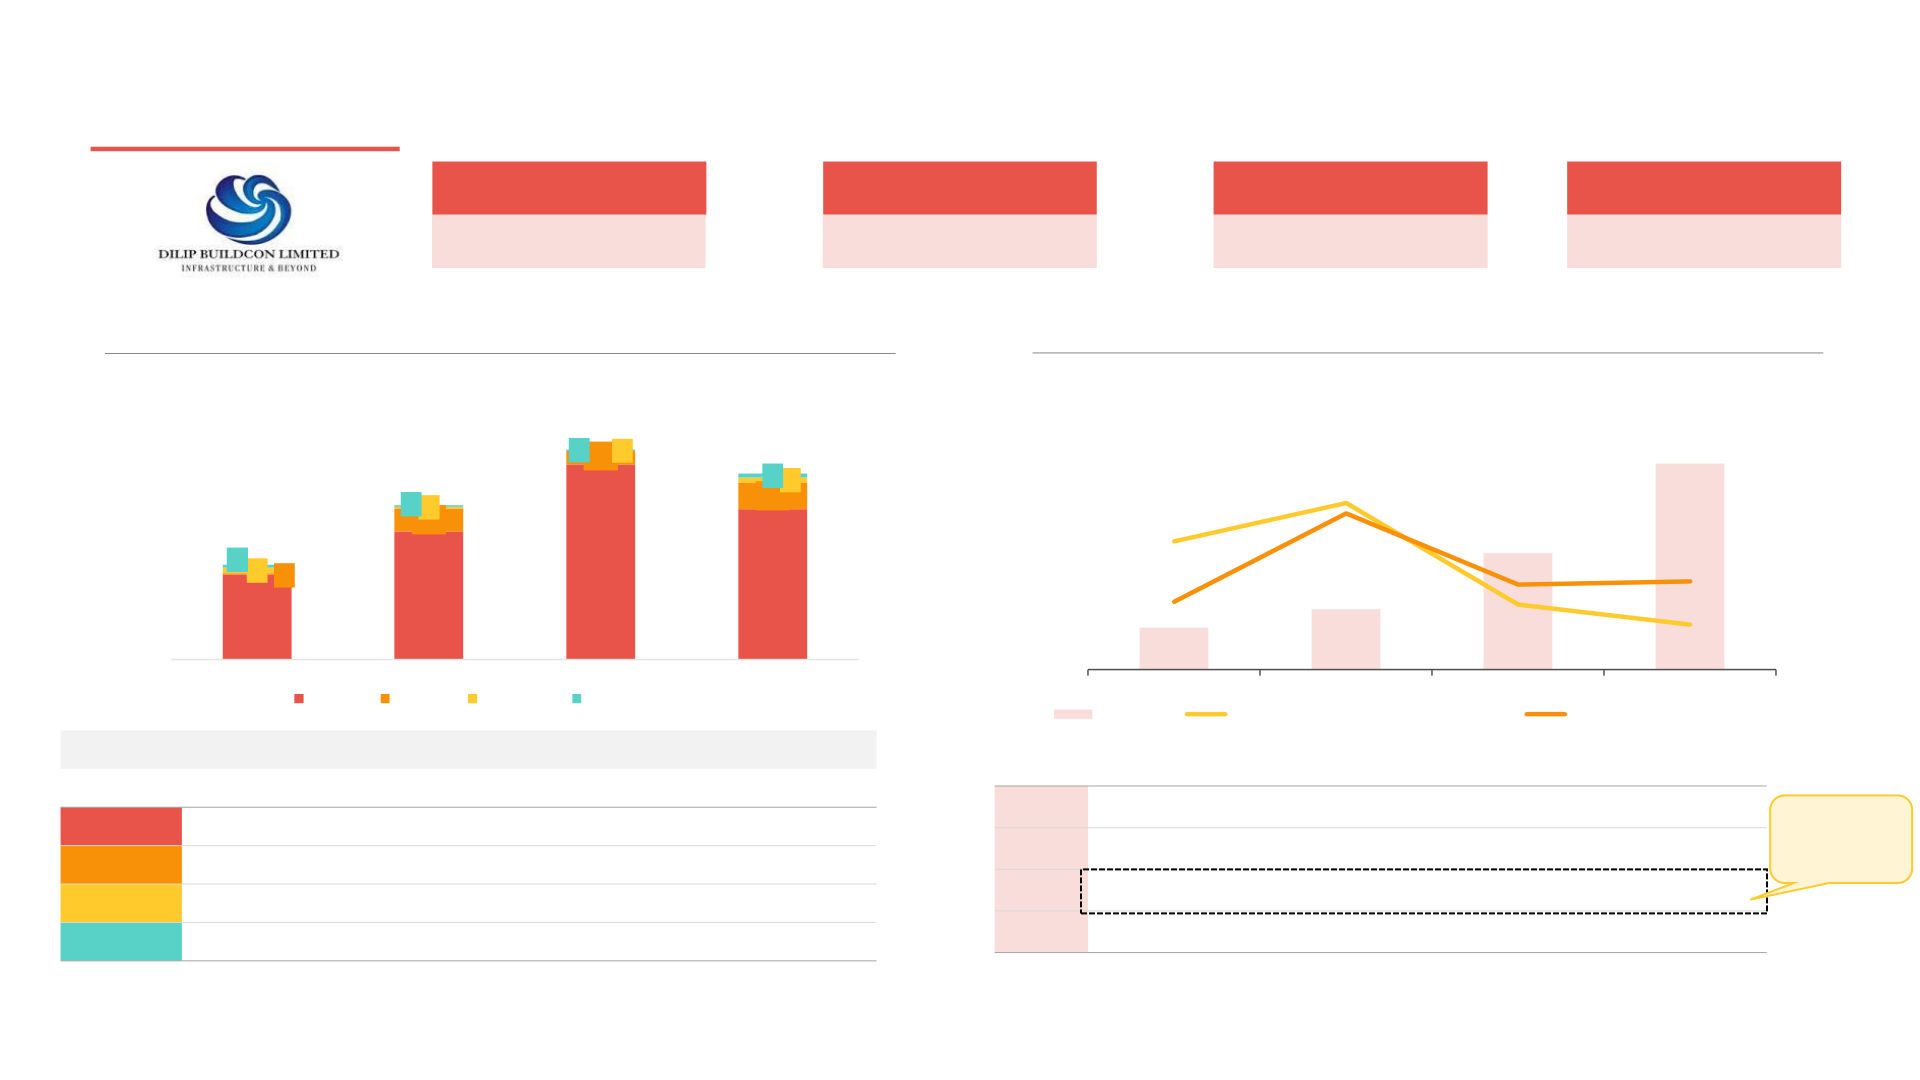
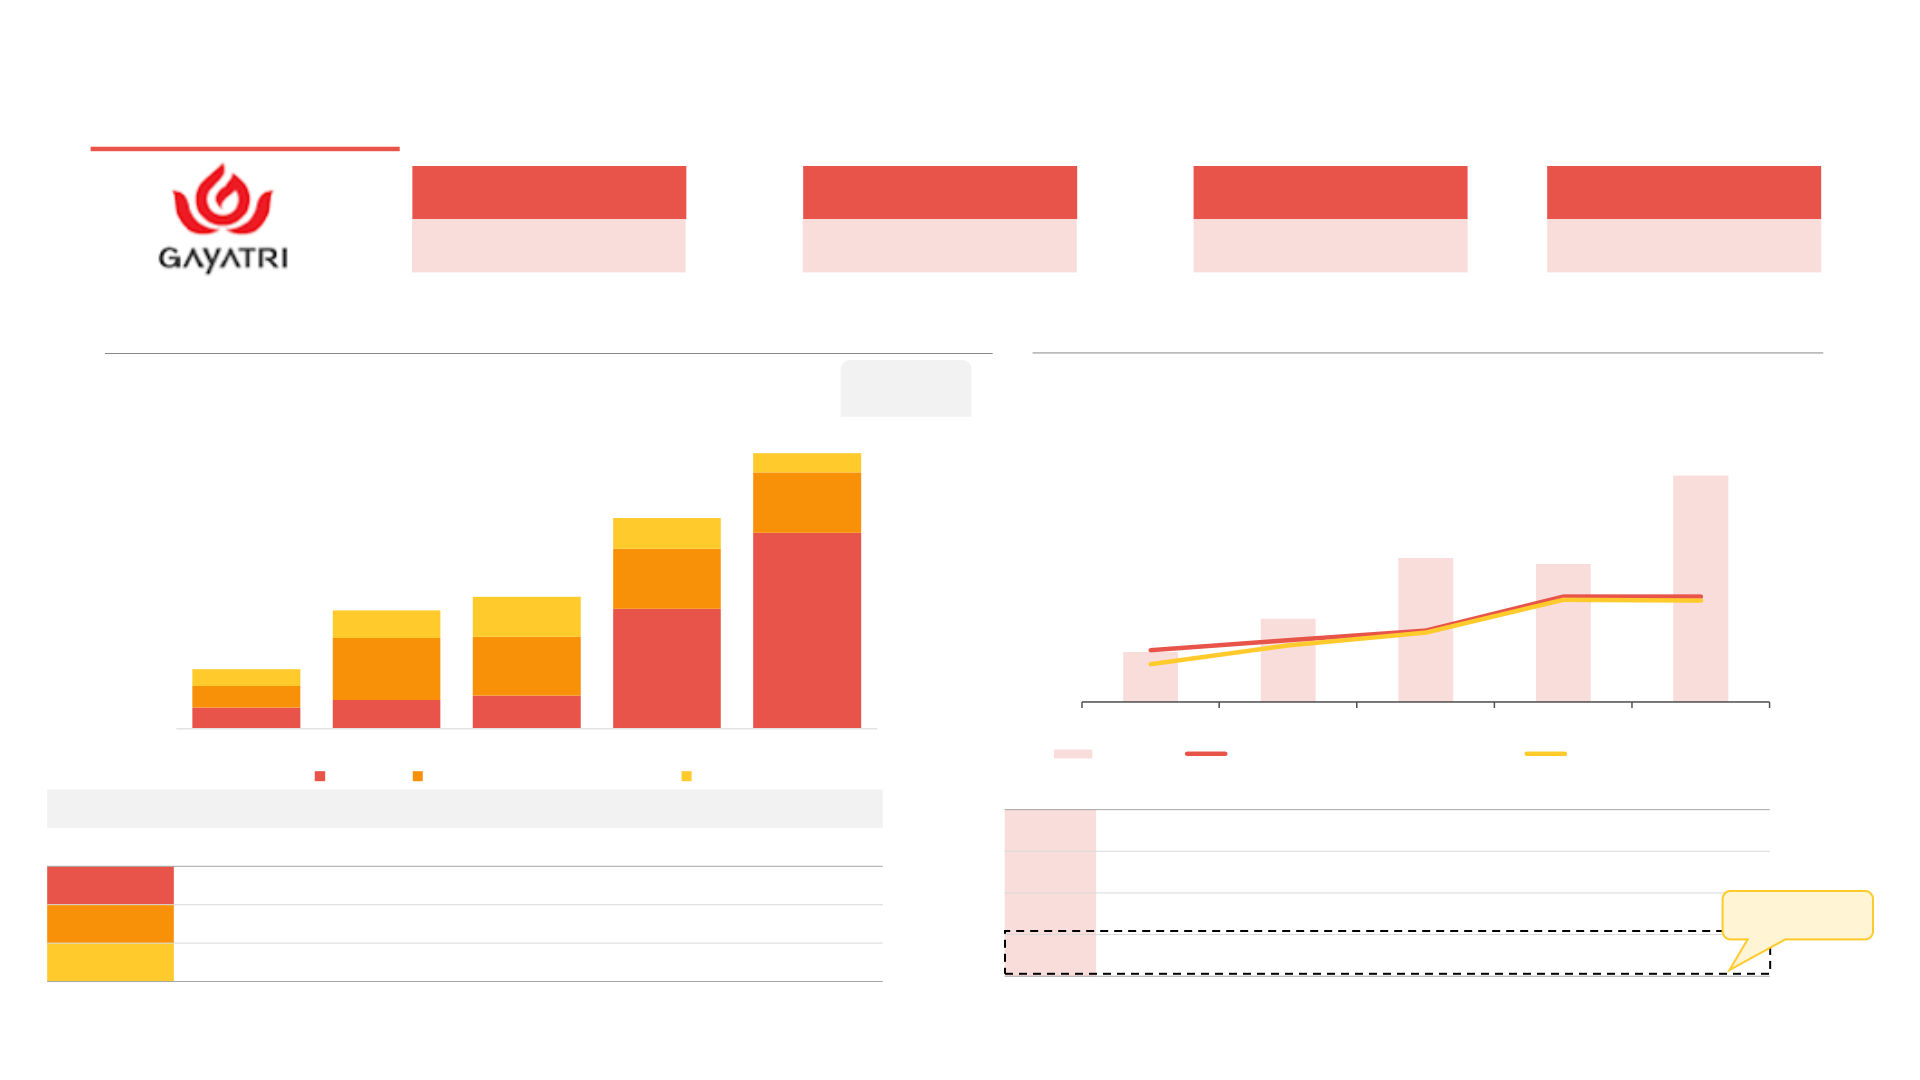
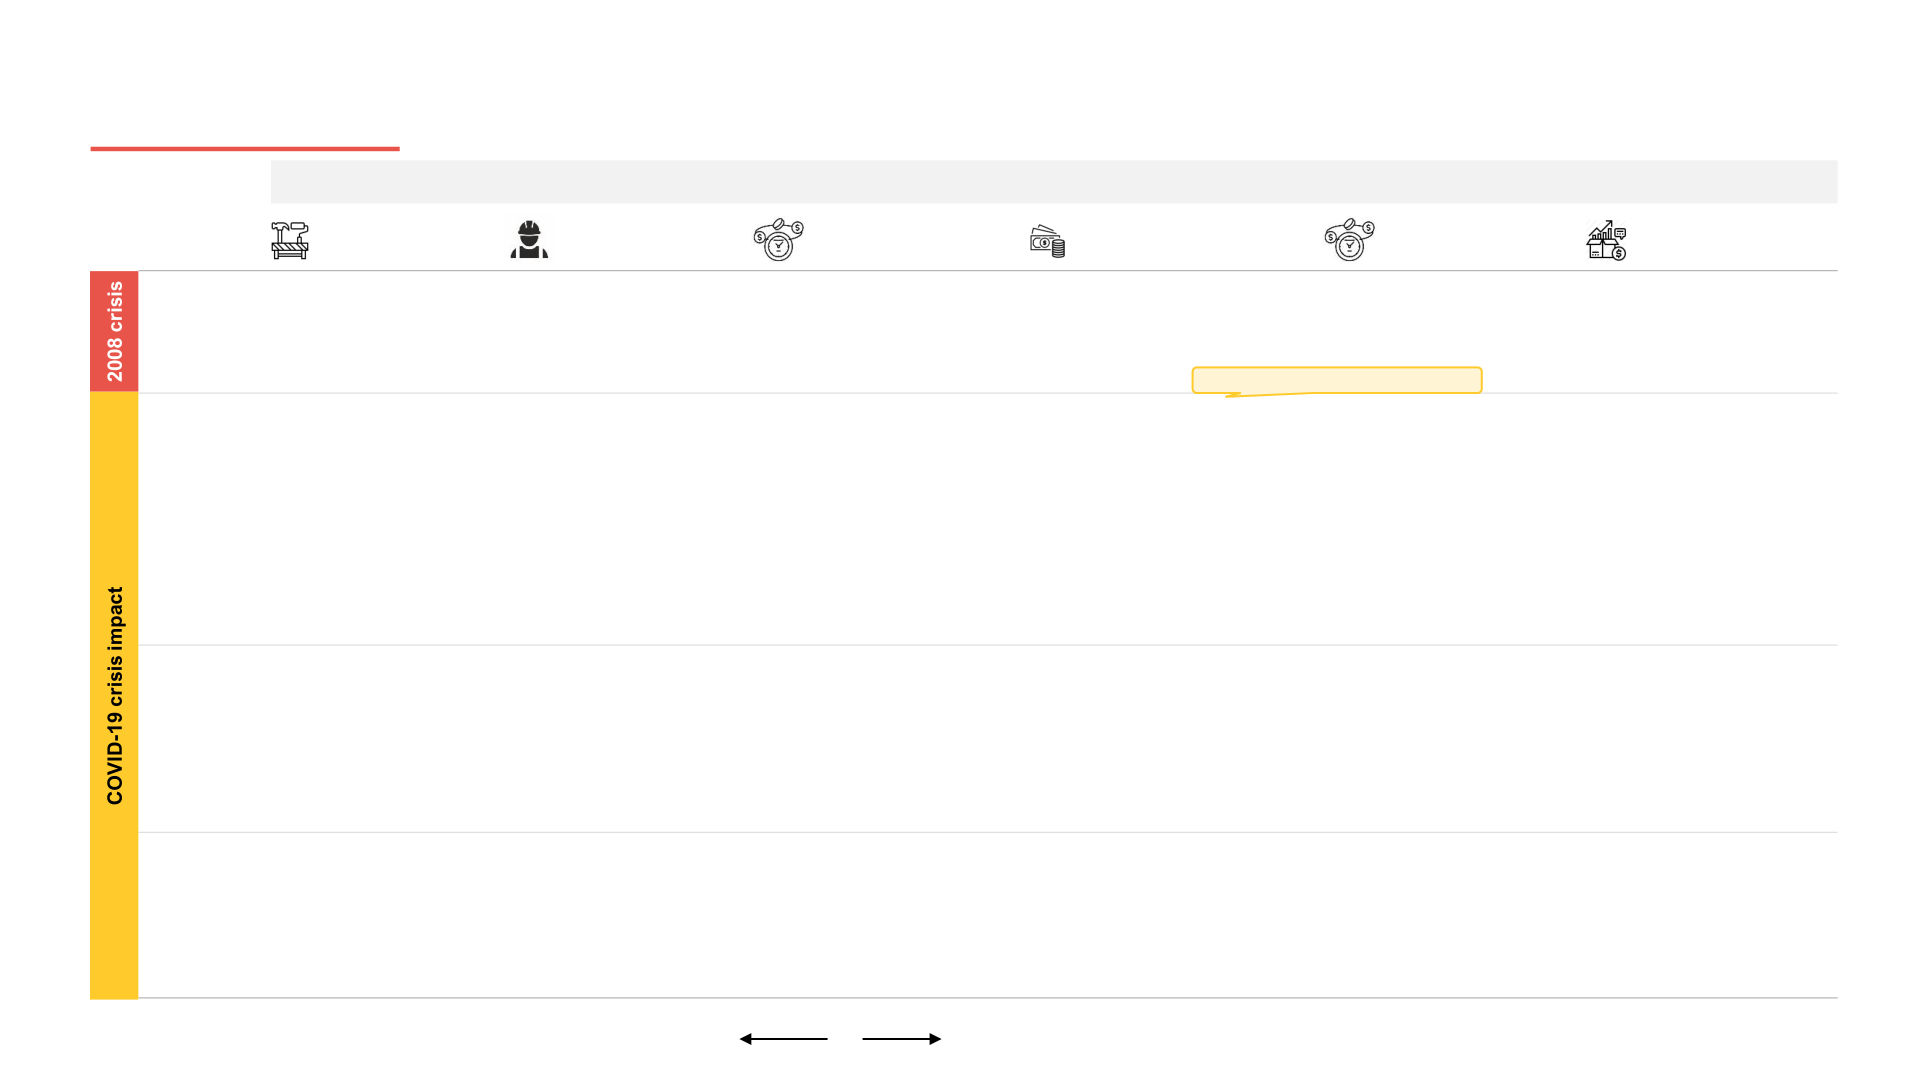
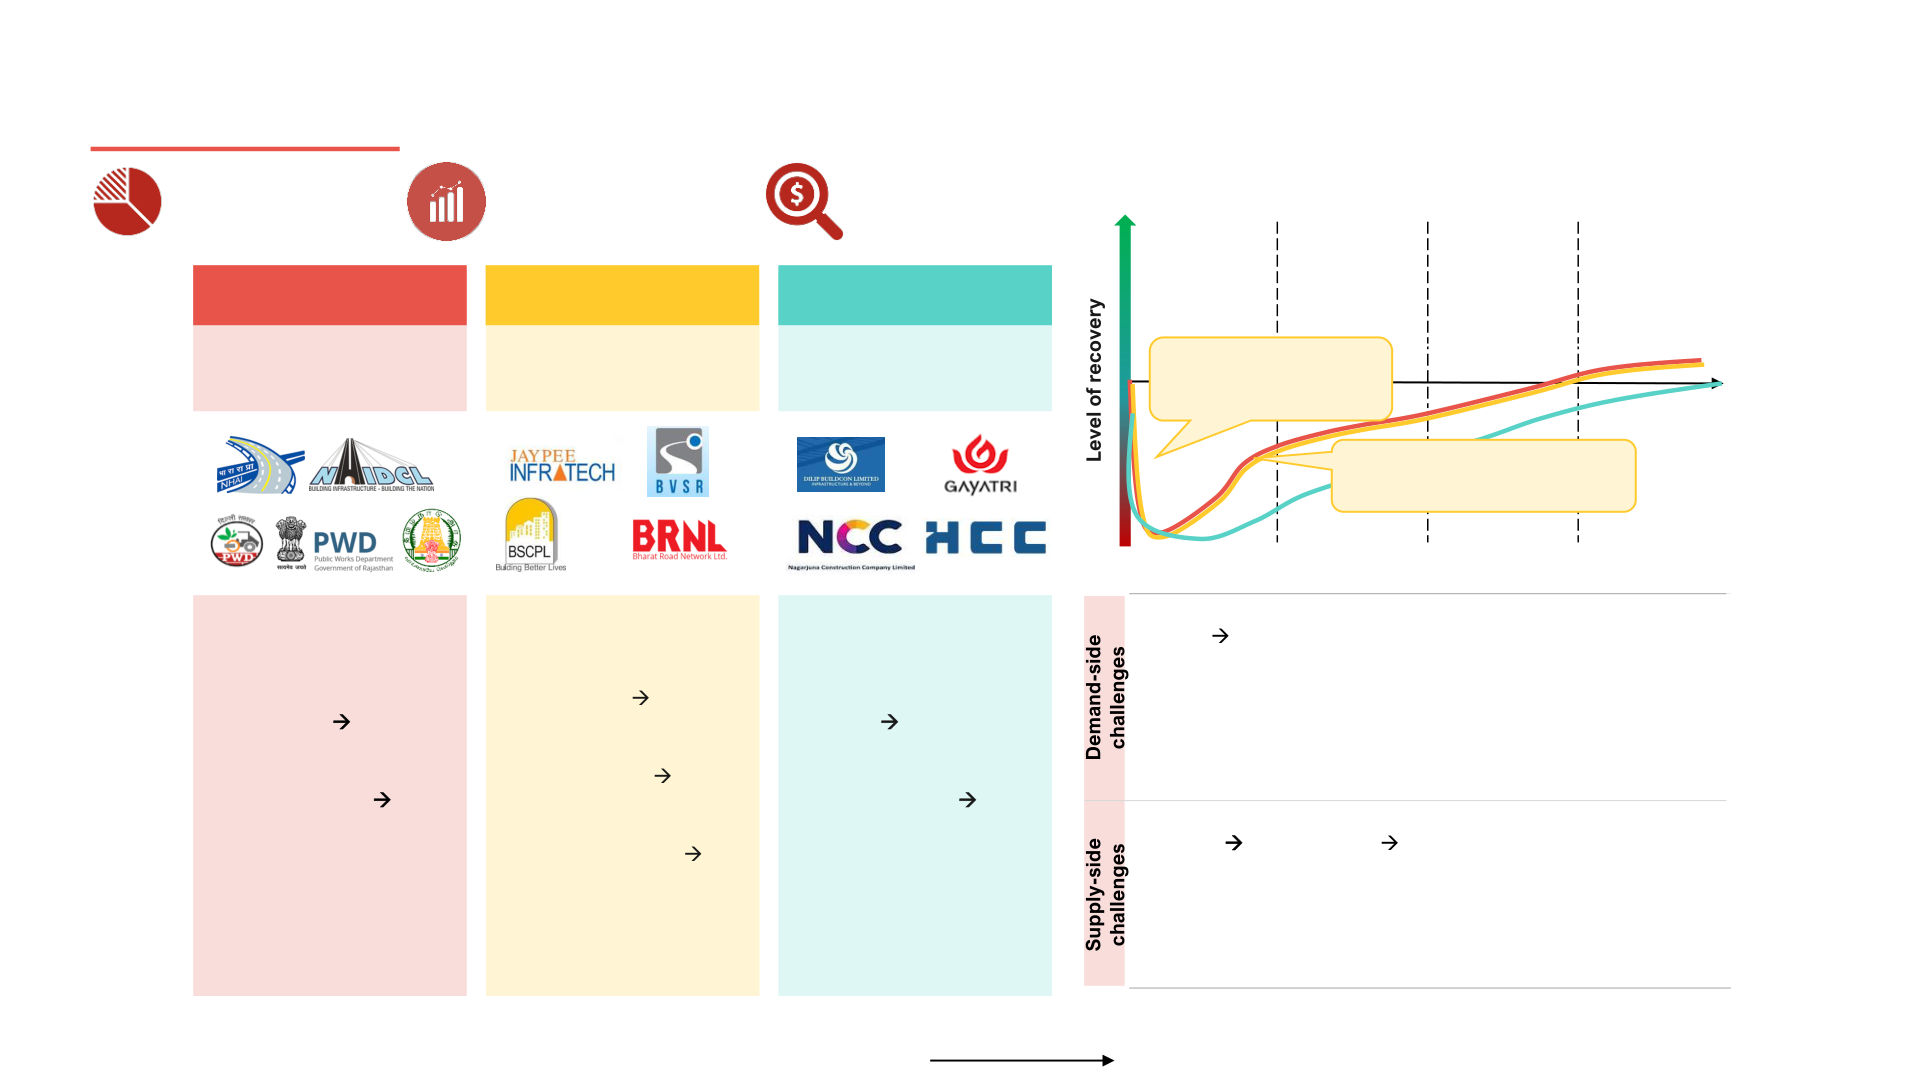
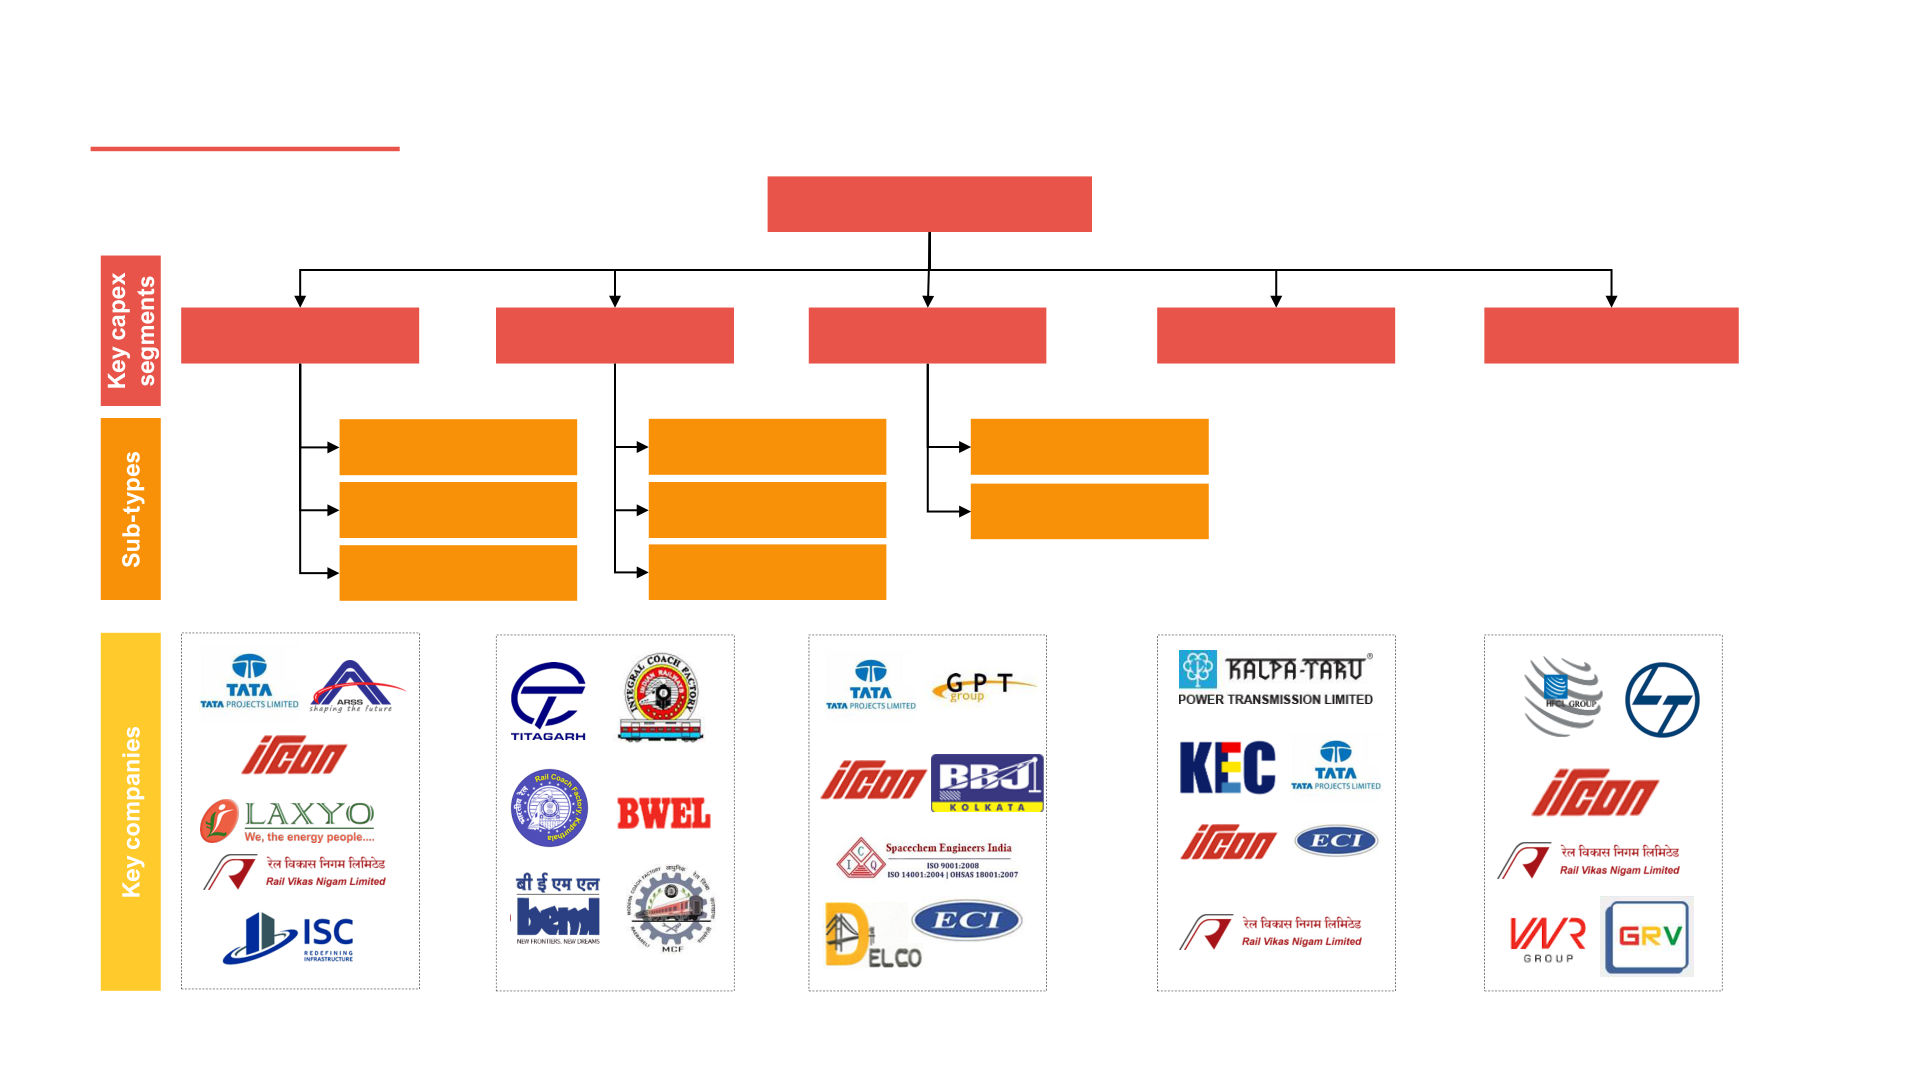
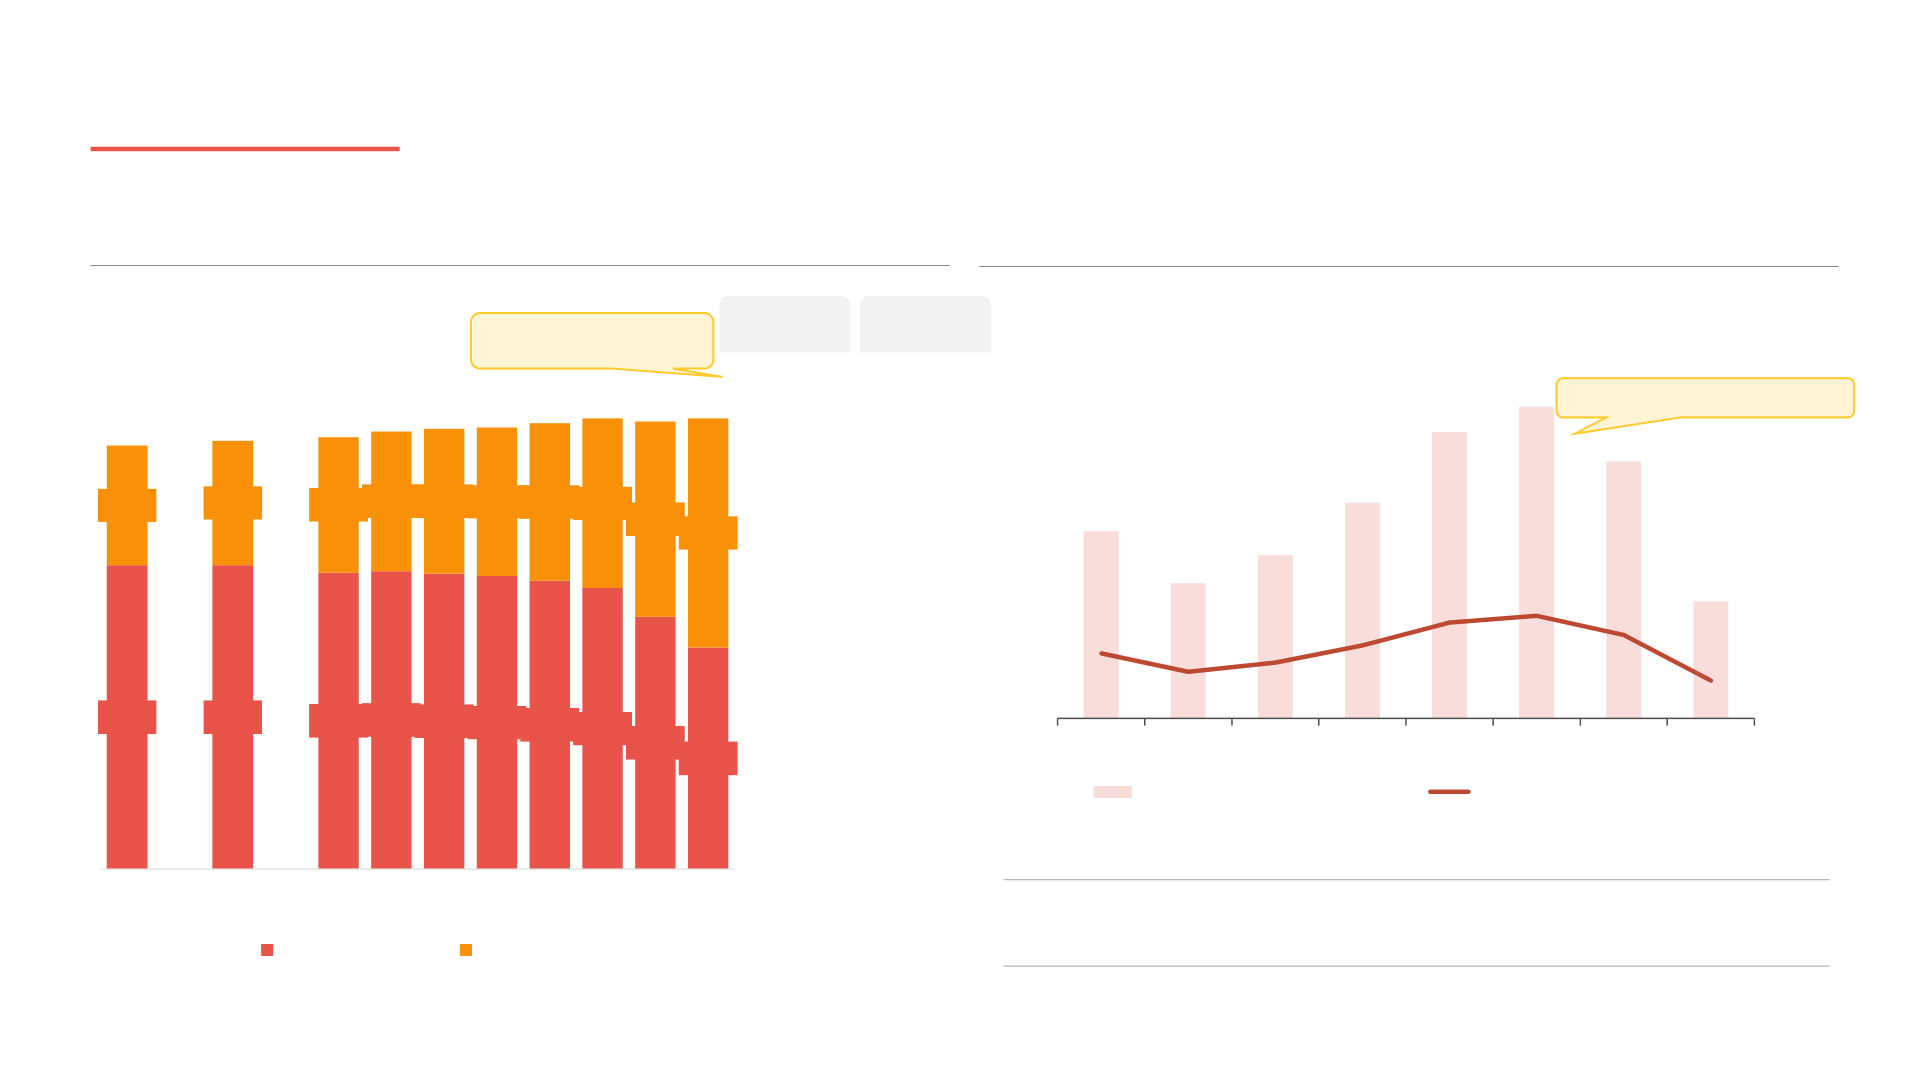
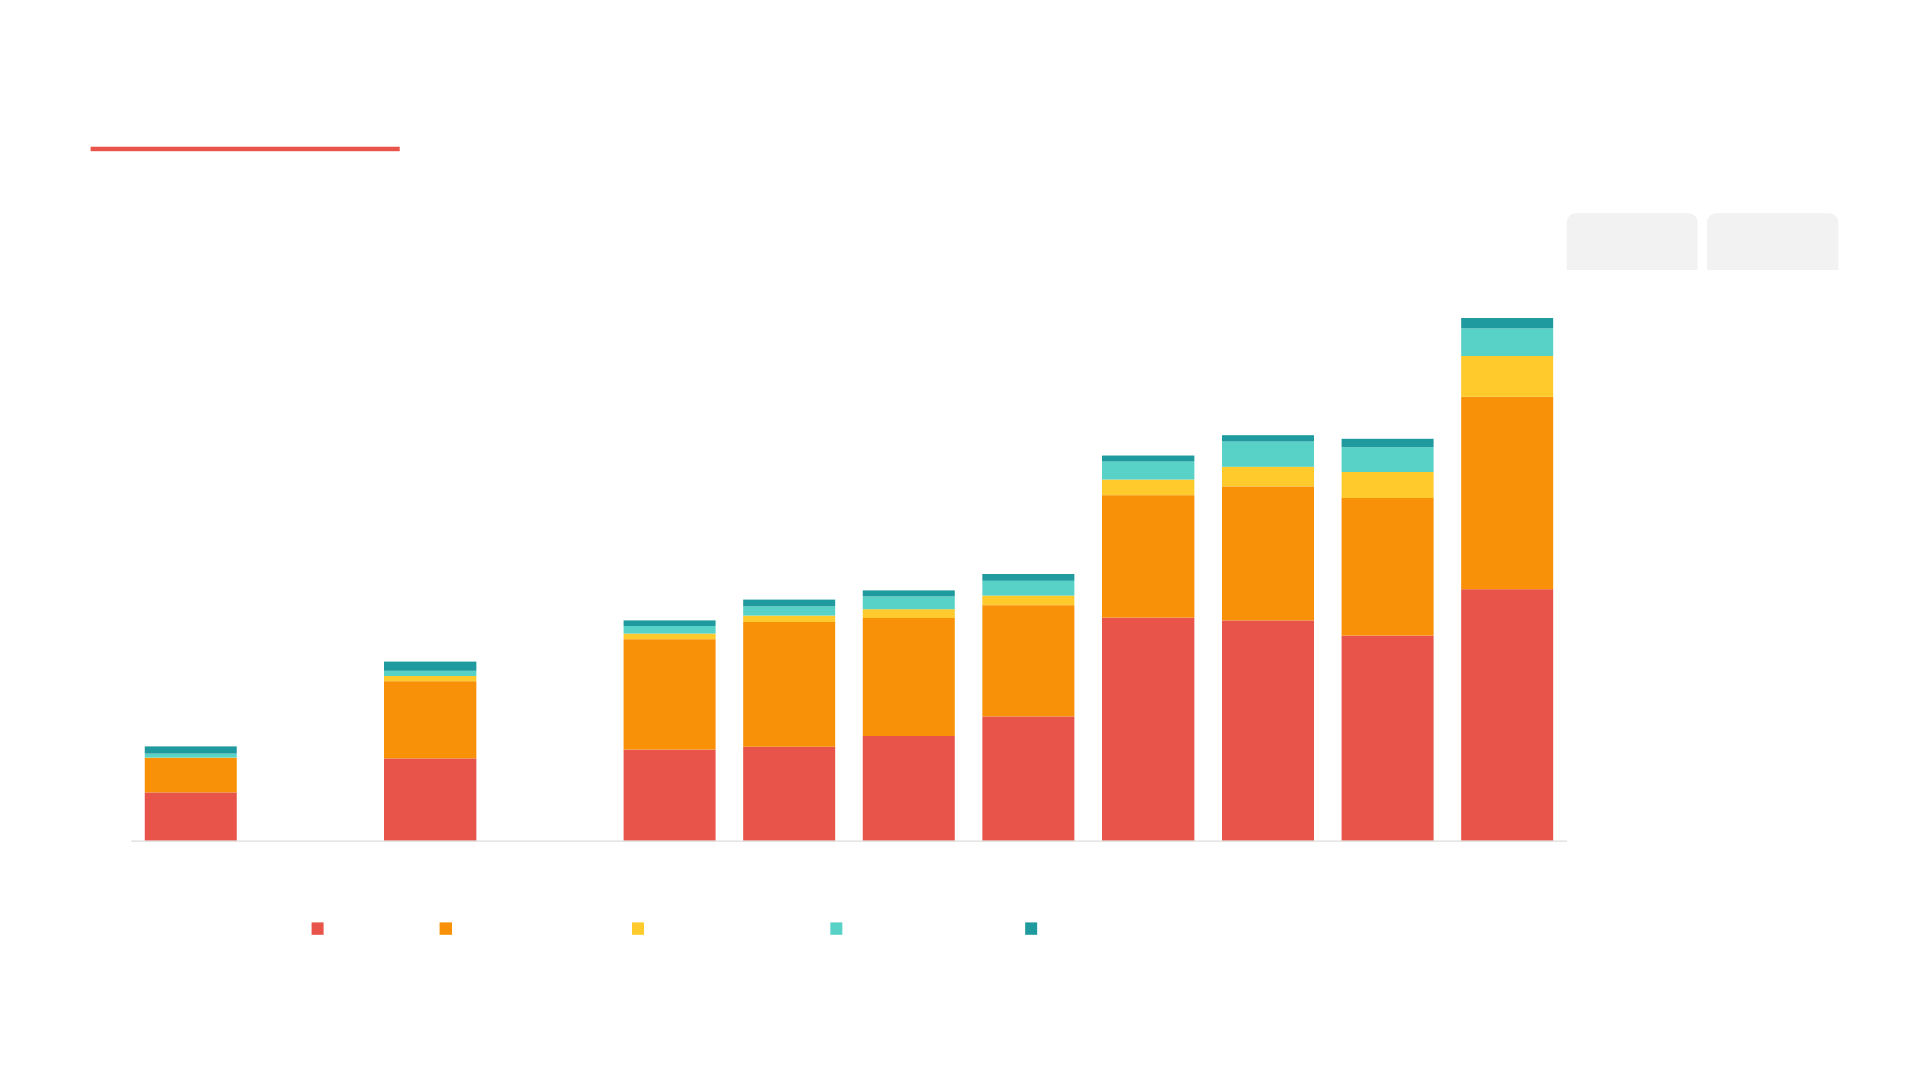
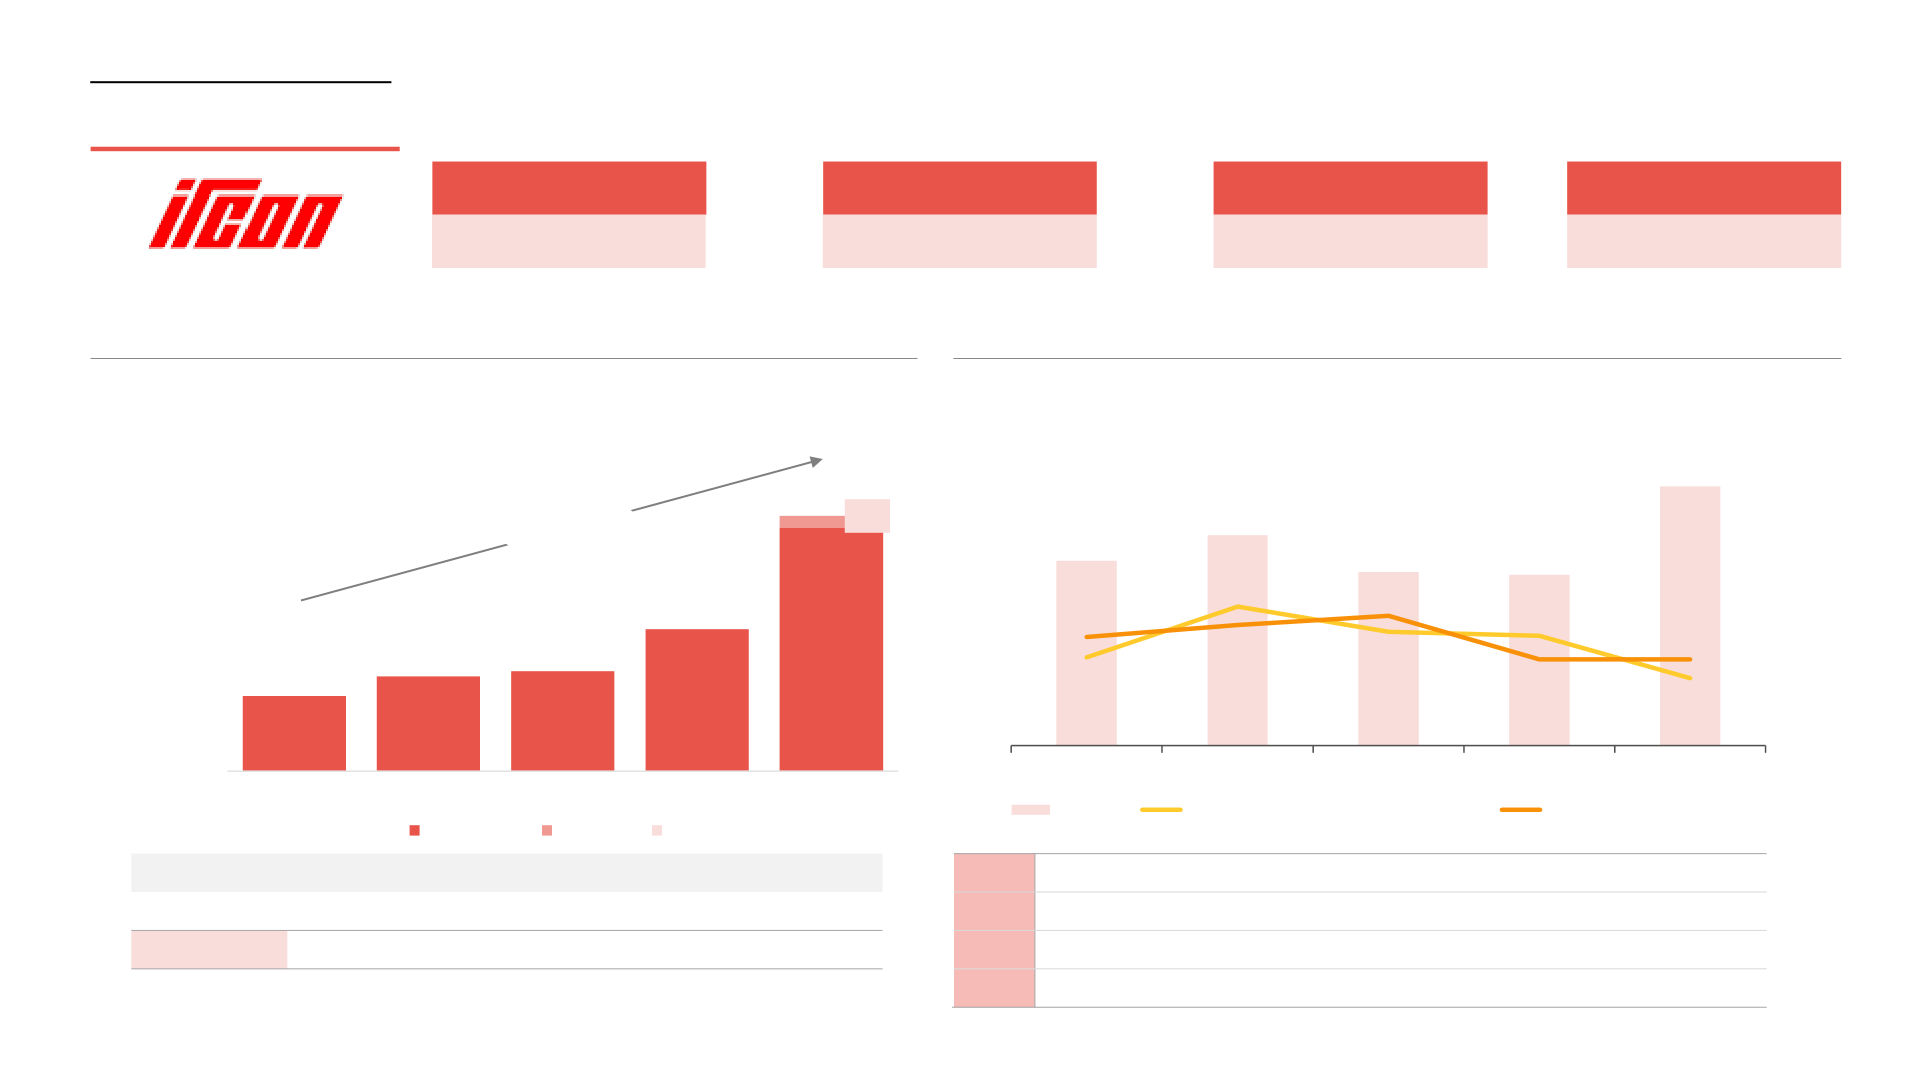
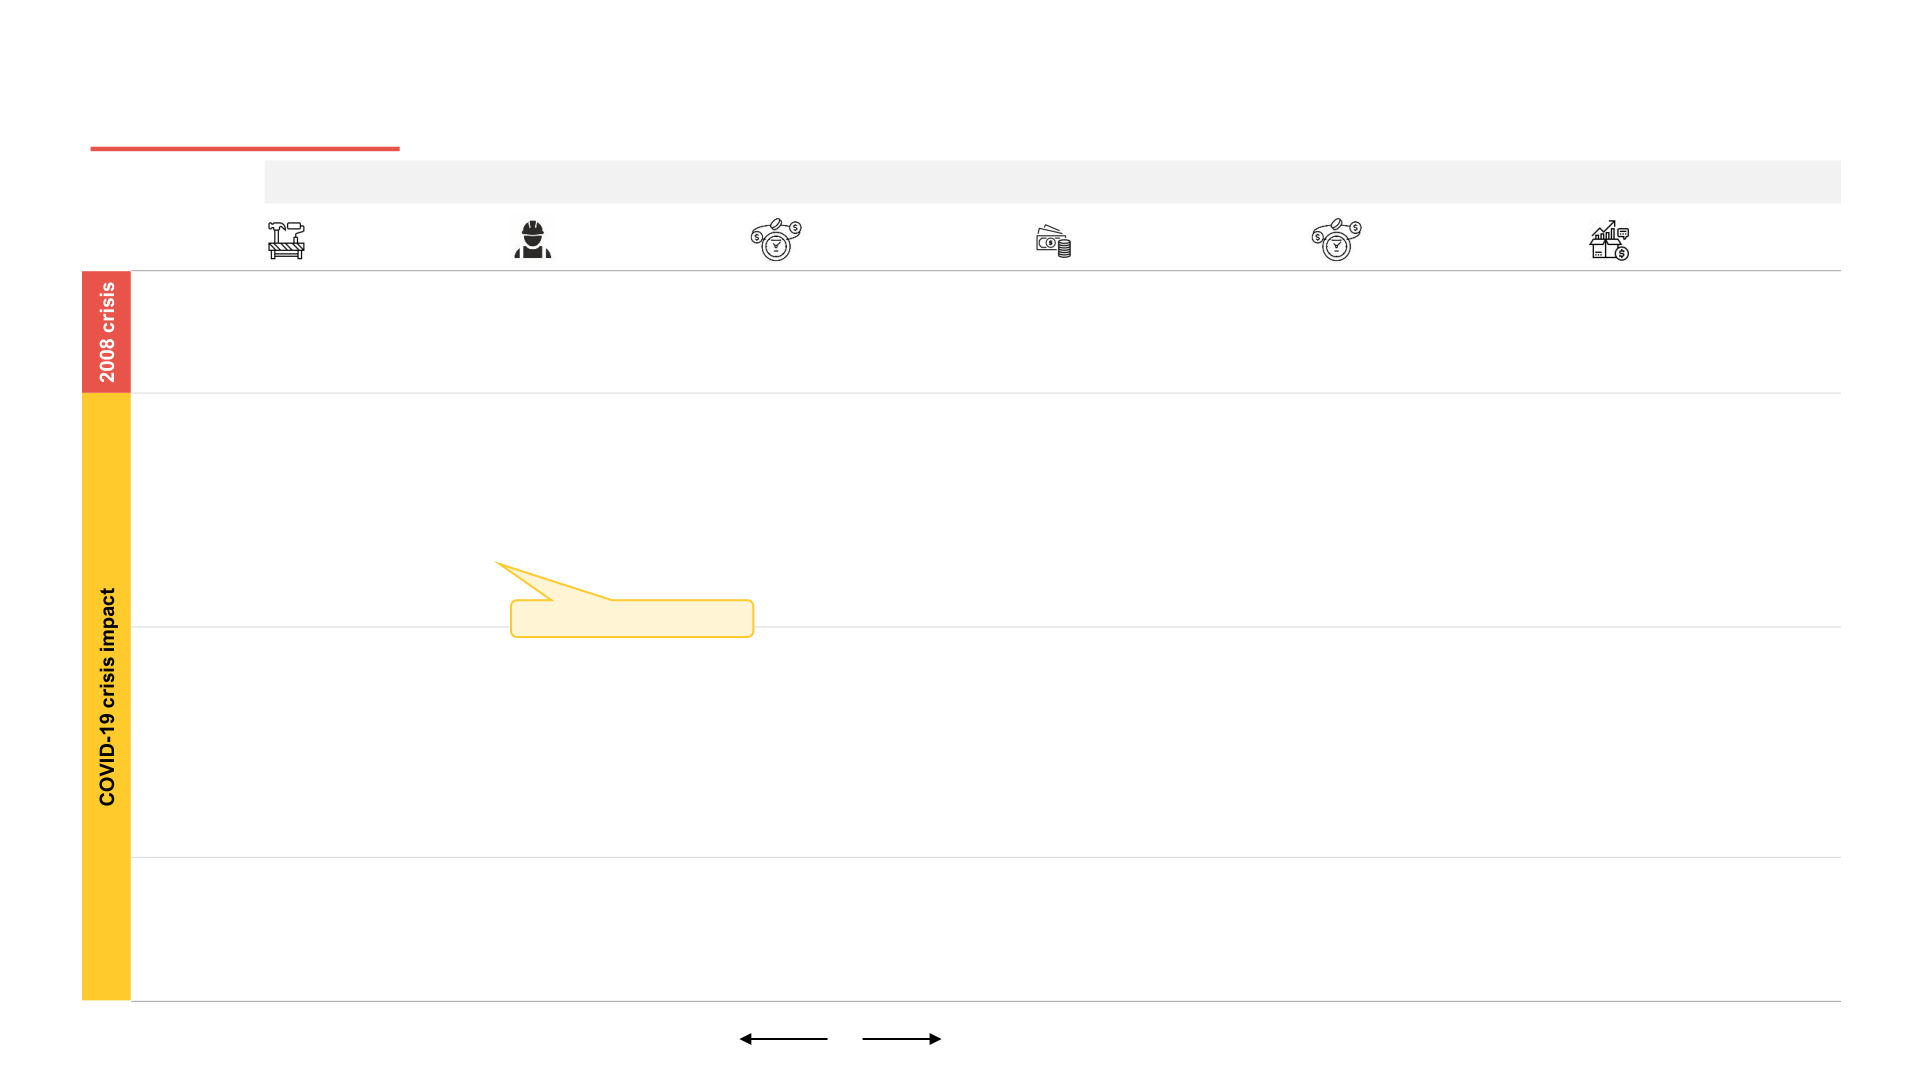
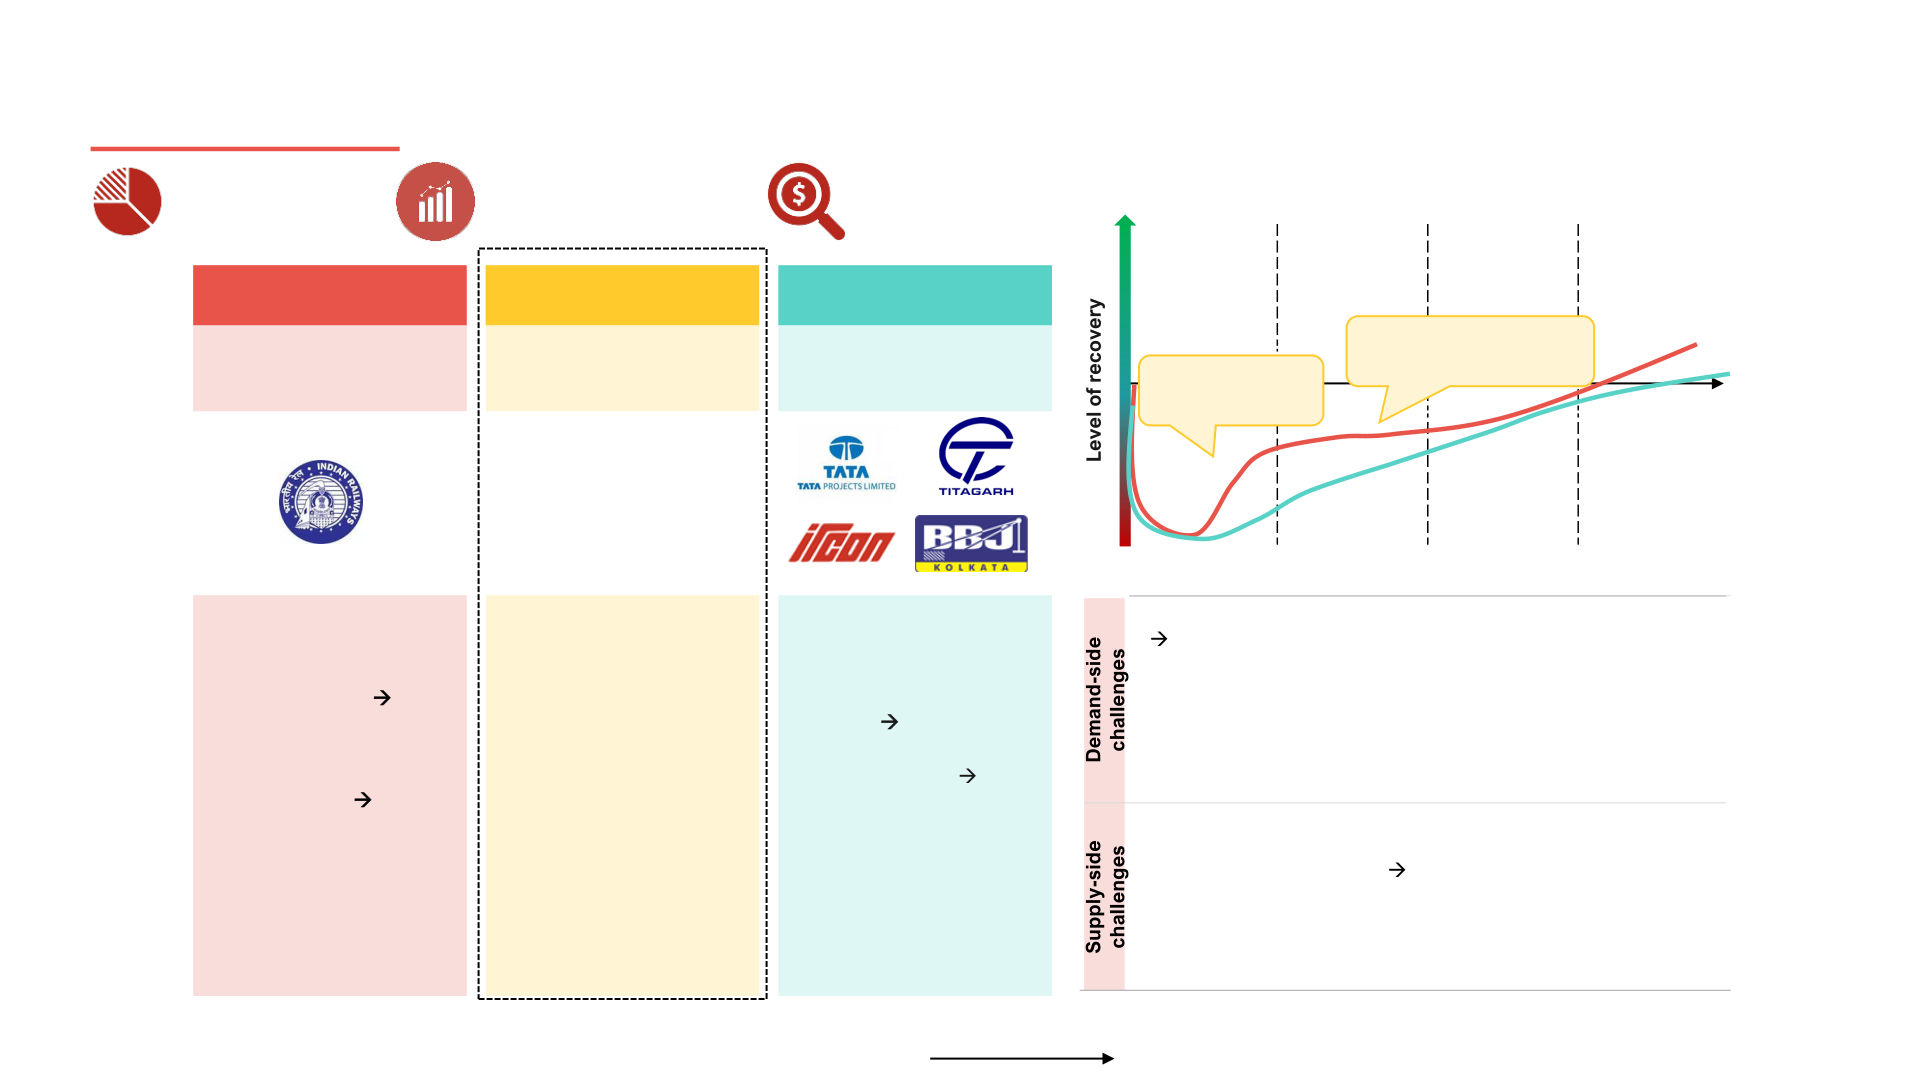
Infrastructure ‘Re - accelerate’ series – Roads and Railways sectors How India’s roads and railways sectors will rebound from COVID - 19 crisis September 2020 Table of contents 1 Executive summary 2 Roads and bridges 3 Railways 4 Policy recommendations © PGA Labs | 2 Foreword The aftereffects of COVID - 19 pandemic will be wide and large. The have assessed how the roads and railways network has grown over pandemic has already affected the economy severely. Although the the past years and how has budgetary allocation evolved for them. recovery is going to be a long - drawn and hard - fought process, In the section on EPC companies, we have looked at the trends of Indian economy is resilient and shall bounce back. receivables and payables for them, along with the impact on various demand and supply factors in short, medium and long term. We have also analysed the likely recovery scenario for all stakeholders Indian economy largely consists of roads and railways sector. in the sector, and what policy measures can the government take to Investments in the sector have gradually increased over the years revive economic activity in the sectors. to improve inter - state connectivity. However, due to the recent unprecedented conditions posed by COVID - 19, daily transportation and freight movement came close to a halt during the lockdowns, The situation is evolving rapidly, and some of the expected shaking up the industry. To re - accelerate, over the coming 5 years, scenarios might have slight variations. This report reflects our Indian Government is set to boost investments to INR 30T in the perspectives in July 2020. Contact us for latest updates. transport sector. And by expanding requirement for faster movement of goods, the sector is poised for long - term growth. We, at PGA Labs, look forward to continuing the discussion with our friends across sectors and exchanging notes as the situation This report is intended to provide various industry stakeholders evolves. including business leaders an overall perspective on the impact of COVID - 19 on the roads and railways sector as the economy starts recovering. _____________________ _____________________ We have identified the growth trends in the roads and railways Aryaman Tandon Madhur Singhal sectors along with the key public and private sector players. We Practice Director, Infrastructure MD, Praxis Global Alliance © PGA Labs | 3 Glossary Abbreviation Full form Explanation (if required) Money owed by a company to its suppliers. AP Accounts payable AR Accounts receivable Money owed to a company by its customers BOT Build Operate Transfer CAGR Compounded Annual Growth Rate Money spent by a company to buy, maintain or improve its fixed assets Capex Capital expenditure Time taken by a company to convert its investment in inventory into cash flow from sales CCC Cash conversion cycle DIO Days inventory outstanding Average number of days a company holds its inventory before selling it DPO Days payables outstanding Average number of days a company takes to pay its suppliers DRO Days receivables outstanding Average number of days an organization takes to receive payments from its customers EBITDA Earning before interest, taxes, depreciation and amortization ECB External commercial borrowing Debt raised by companies from other countries (where interest rates are lower) EPC Engineering, procurement and construction Firms engaged in construction activities in the infrastructure sector GDP Gross Domestic Product NHAI National Highway Authority of India National Highway and Infrastructure Development Corporation NHIDCL Limited NPA Non - performing assets PAT Profit after tax PLR Prime Lending Rate PWD Public Works Department RM Raw material Capital requirement of a business to maintain its day - to - day operations WC Working capital © PGA Labs | 4 Key highlights: Roads and railways Overall Roads Railways • Supported by expanding requirement for faster • Highway accounts for only ~3% of India’s total road • Indian Railways has one of the biggest railway movement and goods, India’s road and railways length, lower than the value for developed countries; network in the world sector is poised for long term growth High long - term growth potential – Railways planning to increase its share in freight movement from 33% to 50% by • PPP participation in roads has been muted in the • Most of NH construction controlled by government 2030, resulting in new infra. projects such past two years and is expected to remain low in the through NHAI as Dedicated Freight Corridor near - term – Government is focusing more on EPC projects - Private players in the sector need stable due to lower capital availability with private road • Station redevelopment , passenger and freight long - term funding for BOT projects developers operations are emerging privatization – In long - term, NHAI may completely turn into opportunities in railways • State PWDs maintain ~60% of the NH stretch in asset monetization firm with NH construction in India, funds for which are allocated by both central PPP mode • EPC firms in the sector have seen healthy WC trend and state governments supported by Indian Railways financial health and • Increase in project cost and slower revenue realization stable supplier partnerships • Railways targeting increased share in freight in recent times movement due to cost advantage over road – WC requirement for EPC firms in the sector has • However, in near term, some new projects might transport increased from 1 to 2 months over FY08 - 19 get delayed due to budgetary constraints because of COVID. Existing projects will also be pushed • COVID - 19 will impact the construction activity in • Toll revenue is expected to recover to pre - COVID back due to labor unavailability both roads and railways in short - to - medium term, level within 9 months ; commercial traffic will rebound resulting in project delays and increased project faster than passenger • Freight revenue is expected to recover within 4 - 5 cost months, but passenger revenue may take more – Uncertainty due to COVID - 19 and • Going forward, private concessionaires will face more than 9 months to recover completely consequent impact on valuation can delay scrutiny due to stressed balanced sheet. NHAI might NHAI’s asset monetization plan also need to explore more alternate financing options Source(s): PGA Labs analysis © PGA Labs | 5 Roads and bridges Roads and bridges primarily consists 3 major components – National highways, state highways and other roads Roads and Bridges Primary district roads and village roads Cater to 97% of total road National Highways State Highways Other Roads length in India Type of road Description Agencies managing the road Managed by central government owned agencies National Highway Managed by state government Public - private partnership Managed by state government State Highway Managed by municipal corporations (for stretches passing through the city) Managed by municipal corporations, Cantonment Boards Other roads etc. Source(s): PGA Labs analysis © PGA Labs | 6 Roads and bridges National Highway project award and construction has increased significantly post FY14 National Highway construction has picked up pace National Highway length has grown at 9% CAGR over FY12 - 19 during FY16 - 19 due to increase in projects awarded National Highways awarded and National Highway and State Highway CAGR CAGR constructed (K km) length in India (K km) FY07 - 12 FY12 - 19 17.0 3.1% 3.6% Conversion of State Highways to 289 15.9 National Highways responsible for 276 increase in NH length 265 249 243 235 235 226 3.9% 0.2% 195 157 10.8 155 10.1 9.8 9.8 162 148 145 143 8.2 8.0 156 155 128 State highway denotification exercise 6.1 5.7 carried out due to Supreme Court’s order 5.5 banning liquor sales near highways 4.4 4.3 3.2 133 1.4% 9.2% 121 104 100 2.0 98 1.9 93 79 72 67 FY07 FY12 FY13 FY14 FY15 FY16 FY17 FY18 FY19 FY12 FY13 FY14 FY15 FY16 FY17 FY18 FY19 National Highways State Highways Length of NH awarded Length of NH constructed Sources: Ministry of Road Transport and Highways, Press Information Bureau, PGA Labs analysis © PGA Labs | 7 Roads and bridges State PWDs maintain the bulk of national highways in India; Maharashtra has the largest network of state highways Overview by operational road maintained % (FY19) Total ~ 289K km 132K km 157K km 100% Others 1% Others 8% PPP 8% PPP 2% 90% Telangana PWD 2% West Bengal PWD 2% Bihar PWD 2% Odisha PWD 2% Kerala PWD 2% 80% Chhattisgarh PWD 2% NHAI Uttarakhand PWD 2% Uttar Pradesh PWD 4% 30% 70% Madhya Pradesh PWD 6% Tamil Nadu PWD 7% 60% Andhra Pradesh PWD 8% 50% Rajasthan PWD 8% 40% Gujarat PWD 10% State PWDs 30% 60% Karnataka PWD 11% 20% Maharashtra PWD 21% 10% 0% National Highway State Highway CAGR over last 5 years National Highway State Highway (FY13 – FY18) 0 - 5% 5 - 10% >10% 0 - 0.5% 0.5 - 2% >2% Confidence level ◑ ◑ Sources: Ministry of Road and Transport, State PWD websites, PGA Labs analysis © PGA Labs | 8 Low High ○◔◑◕● ○◔◑◕● Roads and bridges Maharashtra has the highest length of stuck NH projects in India; delay in land acquisition a primary reason for project delays Stuck NH projects in key states in FY19 (K km.) WIP projects Length (km) Upgradation of NH104 along Sitamarhi – 180 Jaynagar – Narahia section Upgradation of NH85 along Bodimettu – 42 Munnar section Upgradation of Ahmedpur – Jamkhed section 80 of NH548D in Maharashtra 6.3 Upgradation of NH353J on Katol – Warud 41 section in Maharashtra 2.9 Upgradation of Pratapgarh to Allahabad 35 1.9 Bypass road section of NH96 to four lanes 1.8 1.4 1.2 1.2 1.2 1.2 Rehabilitation of 4 - lane MG Setu over Ganga 5.75 river on NH19 in Bihar Maharashtra Uttar Bihar Madhya Karnataka West Bengal Chhattisgarh Andhra Rajasthan Pradesh Pradesh Pradesh Construction of bridge across Zuari river on - NH17 on Panjim – Mangalore section in Goa Key reasons for stuck projects Construction of 6 - lane elevated corridor on 7 • BOT projects stuck due to cash flow issues with concessionaires implementing the road NH 163 to decongest urban limits of project. Hyderabad • Delay in land acquisition due to protest by villagers for fair compensation from the government. • Delay in shifting utilities by concerned government agencies Construction of brisge across river Mandovi at - • Poor performance of contractors Panaji • Contractual issues with contractors Notes: Stuck projects have been estimated based on total stuck project value of INR 2.7 lakh crore and net stuck project leng th of 28K kms, along with value - wise stuck projects in key states; State highways not included due to paucity of data Sources: Ministry of Road Transport and Highways, PGA Labs analysis © PGA Labs | 9 Roads and bridges EPC company: Dilip Buildcon has slowly diversified into mining sector from roads; company has high DIO due to lower reliance on sub - contractors Revenue* EBITDA* PAT* Order book size* INR 94.1B INR 18.1B INR 5.5B INR 211B Order book of Dilip Buildcon has grown at 25% CAGR over Dilip Buildcon has a WC requirement of 3 - 4 months; DRO has declined in FY19 as compared to previous years FY16 - 19; roads contribute 80 - 90% of the order book Order book composition for Dilip Buildcon (INR Trade receivables as % of revenue (%) Revenue (INR B) B) 239 Trade payables as % of cost (%) 211 94.1 1 0 100.0 60% 16 5 176 5 46% 80.0 30 2 2 26 40% 60.0 108 43% 53.2 3 35% 24% 222 6 23% 1 40.0 171 27.6 19% 146 20% 19.1 97 20.0 18% 12% 0.0 0% FY16 FY17 FY18 FY19 FY13 FY15 FY17 FY19 Roads Mining Irrigation Urban development Revenue Trade receivables as % of revenue Trade payables as % of cost % share in order book FY03 FY15 FY17 FY19 FY16 FY17 FY18 FY19 DPO 42 122 91 83 Lower Roads 90% 83% 93% 81% dependence DRO 90 149 64 45 on sub - Mining 1% 15% 6% 14% contractors DIO 76 138 155 115 Irrigation 6% 1% - 3% CCC 124 165 128 77 UD 3% 1% 0.5% 2% Note: * represents values for FY19; Revenue refers to operating revenue; Sub - contracting expenses have been considered as a part of COGS for calculating DPO, DIO and CCC 1 2 3 4 DPO is no. of days taken to pay off the suppliers; DRO is number of days taken to receive payment from customers; DIO is no. of days taken to liquidate inventory; CCC is no. of days taken to convert its investment in inventory into cash flow from sales © PGA Labs | 10 Sources: Annual reports, PGA Labs analysis Roads and bridges EPC company: Gayatri Projects’ order book has increased driven by growth in the roads segment; working capital requirement has also increased Revenue* EBITDA* PAT* Order book size* INR 34.6B INR 7.6B INR 2.1B INR 163.2B Order book has increased at 15% CAGR over FY08 - 19; road DPO has increased with DRO as the portfolio of roads projects has increased; CCC has increased marginally projects comprise 71% of the order book CAGR Trade receivables as % of revenue (%) Revenue (INR B) Order book composition for Gayatri FY08 - 19 Trade payables as % of cost (%) Projects (INR B) 163 14.9% 40 100% 1.5% 11.6 34.6 125 80% 35.7 9.8% 30 18.3 60% 22.0 21.1 78 20 40% 40% 35.5 70 12.7 40% 27% 23.7 24% 39% 16.3 39% 22.3% 115.9 7.6 10 35 20% 26% 34.6 36.7 70.9 20% 22% 9.8 14% 12.8 0 0% 19.8 17.0 12.6 FY08 FY10 FY12 FY17 FY19 FY08 FY10 FY12 FY17 FY19 Revenue Trade receivables as % of revenue Trade payables as % of cost Roads Irrigation and water works Other FY08 FY10 FY12 FY17 FY19 % share in order book DPO 41 65 73 118 125 FY08 FY10 FY12 FY17 FY19 DRO 56 73 83 122 133 Roads 36% 25% 26% 57% 71% Increase in WC DIO 23 22 22 55 54 Irrigation 36% 52% 44% 28% 22% requirement CCC 39 31 32 59 52 Others 28% 23% 30% 15% 7% Notes: Note: * represents values for FY19; Revenue refers to operating revenue; Sub - contracting expenses have been considered as a part of COGS for calculating DPO, DIO and CCC © PGA Labs | 11 Sources: Annual reports, PGA Labs analysis Roads and bridges COVID - 19 is expected to have a high short term - impact across demand and supply factors; demand to increase in medium - term Supply side factors Demand side factors RM and Payment terms and Payment terms and Labor Availability of finance Highway demand equipment costing pricing • No restriction on • No restriction of • Construction activity • Reduction in budgetary • AR increased for • No major impact availability of raw availability of labor was not affected, but allocations for new EPC companies due as traffic materials and for construction the overall speed of projects by government to payment delays movement on Overall ● ● ● ● ● ● equipment construction was highways did not slower reduce Fixed cost due to idle equipment • EPC company: • EPC company: • EPC company: AP to • EPC company: WC • EPC company: • No short - term Limited Labur starts increase due to delay requirement to increase Payments are demand increase availability of joining back in in processing as projects are stalled. milestone - based as traffic volume raw materials due month 2 and 3, payments by NHAI. • Asset owners: Effect Delay will impact is expected to be Short - to supply chain but disruptions RM (steel etc.) cost to on budgetary allocation cash flows. AR lower than normal term disruption. On - continue. decrease to liquidate for new projects by might increase due as people limit ● ● ● ● ● ● (1 to 3 site equipment to Contract labor inventory, but other government. Increased to delay in clearing their movement; remain available, might not be RM (sand, gravel etc.) dependence on pending bills. Only goods months) but transportation available cost will remain raising fiancé from Pricing for project is services will be of new equipment same. No impact on alternate sources fixed during tender fully operational to be affected equipment cost such as InvIT • EPC company: • EPC company: • EPC company: AP • EPC company: WC • EPC company: • Increase in RM and More than 80% start decreasing as requirement reduces as Payments re - start as demand as Medium - equipment laborers join payments resume. projects resume. construction highway traffic term (4 availability back. Contract RM cost starts • Asset owners: resumes, and AR increases with ● ● ● ● ● ● improves. labor starts increasing as Budgetary allocation starts reducing. No ease in to 8 Construction returning to construction resumes remains affected. pricing impact on restrictions months) resumes for govt. construction with a strong push Increased dependence ongoing projects projects sites from the government on alternate sources • EPC company: • EPC company: • EPC company: AP • EPC company: WC • EPC company: • Demand to Full - scale Full labor joins and RM cost back to requirement back to Payments normalize increase in Long - resumption of back and pre - COVID level. pre - COVID levels. but cash flow accordance with term (9 road construction construction • Asset owners: Govt. remains impacted traffic volume ● ● ● ● ● ● to 12 activity back to resumes at pre - renews focus on due to delay. growth and long - pre - COVID - 19 COVID - 19 pace. alternate funding • No pricing impact term construction months) level. sources on ongoing projects plans Sources: PGA Labs analysis © PGA Labs | 12 Increasing negative Increasing positive impact impact ● ● ● ● ● Roads and bridges Road sector is expected to recover with strong government push, but PPP projects to remain impacted in view of capex availability issues Expected annual growth Expected investment Capacity (FY19) Expected industry recovery pattern rate (FY19 - 24) source 289K km 3 - 5% Public sector Highly positive Public PPP EPC Positive Zero toll collection for 20 Market Pre - COVID Oligopoly Oligopoly Oligopoly days in April as per govt. structure levels order Time period Negative Commercial vehicle movement to resume but personal vehicle traffic Highly increase to be slow Players negative AMJ 20 JAS 20 OND 20 JFM 21 • Reduced • Traffic starts • Return to normalcy as road COVID19 traffic increasing traffic increases ◑ ◑ ◑ ◑ ◕ ◕ impact Lower toll • NH collection construction • Higher government • Higher NPAs More • Delay in high - ticket Industry resumes with intervention More focus projects failing to meet debt projects Pushback in outlook govt. push on EPC projects rather than obligations timelines of high - ticket PPP projects projects • Project finance • Impact on capex Lower Increased scrutiny by banks • Cost escalations Delays • Project • New capex • Government to increase terms revenue due to toll for upcoming projects to increase overall project finance sources of PPP projects to compensate suspension and reduced cost • Innovative models PPP Increased More focus for losses during COVID traffic to affect debt raising models such as HAM to get scrutiny for on raising • Government projects lead capacity for NHAI more push to reduce private funds through recovery burden on private players projects InvITs / bonds Sources: PGA Labs analysis © PGA Labs | 13 Low High ○◔◑◕● ○◔◑◕● Railways Indian Railways have five key capex segments – track works, rolling stock, bridge works, electrification, and signaling and telecommunication Railways Signaling and Track works Rolling stock Bridge works Electrification telecommunication New bridge New lines Wagons construction Doubling Coaches Maintenance Gauge conversion Locomotives Source: PGA Labs analysis © PGA Labs | 14 Railways Government funding remains the key driver of urban development in India; area development and urban mobility solutions are the key end uses of funds Track route length CAGR has increased over FY12 – FY19 as Increase in % track length addition post FY13 with increased compared to FY06 – FY12 focus on doubling single track lines to improve route capacity Track length addition as % of running tracks Track route length (K km.) CAGR CAGR More than 50% track length Increase in track length (km) Increase as % of existing track length FY06 - 12 FY12 - 19 electrified 2.0 5.0% 1.8 0.2% 0.6% Dedicated Freight Corridor project 67.4 67.4 66.9 66.7 66.0 65.8 65.4 contributing to the growth 64.6 1.6 64.0 63.3 4.0% 1.5 1.5 1.2 20.9 21.6 22.2 23.6 18.6 25.4 17.9 20.3 3.0% 1.1 29.2 34.3 0.9 0.6% 7.8% 1.0 0.8 2.0% 0.7 1.5% 1.4% 1.2% 1.0% 0.9% 0.5 0.8% 0.7% 1.0% 0.5% 45.4 45.5 0.0 0.0% 44.6 44.3 44.2 43.8 43.1 42.0 37.7 FY12 FY13 FY14 FY15 FY16 FY17 FY18 FY19 0.0% - 4.1% 33.1 Increase in track length % increase in track length Key reasons for variation in % capacity addition FY06 FY09 FY12 FY13 FY14 FY15 FY16 FY17 FY18 FY19 • Thrust on increasing railways network and carrying capacity through construction of more tracks • Increasing demand to serve under - connected areas, mainly in North East India. Non-electrified Electrified Note: Track route length refers to length of a group of tracks on a particular route; track length is the length of individua l t racks running in the country Sources: Ministry of Railway, PGA Labs analysis © PGA Labs | 15 Railways Budgetary allocation for capex projects has grown at 13% CAGR; tracks accounted for ~50% of the amount allocated for key capex items Revised budgetary allocation for key railway capex items (INR B) CAGR CAGR FY06 - 12 FY12 - 19 15.2% 13.1% 765 15.4 - 3.3% 9.1% 40.5 12.4% 20.3% 59.3 51.0% 32.4% 594 588 564 9.5 12.6 36.7 8.9 36.2 26.5 28.7 37.7 22.7 281.1 14.4% 8.2% 391 196.1 179.1 367 201.4 353 10.0 9.0 21.8 323 9.4 18.6 13.9 13.7 8.4 12.6 9.6 11.1 263 8.3 13.8 162.7 7.8 173.0 7.3 182.0 161.5 368.6 11.0% 15.6% 138 112.6 326.6 322.6 300.4 10.4 0.7 5.5 50.1 182.2 153.5 138.2 133.7 121.3 71.5 FY06 FY09 FY12 FY13 FY14 FY15 FY16 FY17 FY18 FY19 Tracks Rolling stock Electrification Bridge works Signaling and Telecommunication Sources: Ministry of Railway, PGA Labs analysis © PGA Labs | 16 Railways EPC company: IRCON’s order book’s CAGR of 14.5% is primarily driven by railway sector projects; trade receivables and payables cycle is consistent for IRCON Revenue* EBITDA* PAT* Order book size* INR 44B INR 6.41B INR 4.36B INR 339B Order book of IRCON has grown at 14.5% CAGR over FY10 – Order book of IRCON has grown at 14.5% CAGR over FY10 – FY19; growth driven by railways sector projects FY19; growth driven by railways sector projects Revenue (INR B) Trade receivables as % of revenue Order book composition of IRCON (INR B) Trade payables as % of cost 50 50% 44 339 40 40% CAGR 36 0.4 16.0 31 14.5% 30 29 30 30% 24% 22% 189 18% 19% 20 20% 15% 133 20% 126 322.7 19% 100 10 15% 15% 10% 11% 0 0% FY10 FY12 FY15 FY17 FY19 FY10 FY12 FY15 FY17 FY19 Revenue Trade receivables as % of revenue Trade payables as % of cost Railways Roads Others FY10 FY12 FY15 FY17 FY19 % share in order book DPO 65 68 93 57 52 Year Railways Roads Others DRO 50 88 83 78 49 FY19 95% 5% <0.1% DIO 53 20 21 21 23 Notes: Note: * represents values for FY19; Revenue refers to operating revenue; Sub - contracting expenses have been CCC 38 40 11 42 20 considered as a part of COGS for calculating DPO, DIO and CCC Sources: Company website, annual reports, PGA Labs analysis © PGA Labs | 17 Railways COVID - 19 is expected to have moderate short - term impact on payment terms and finance availability; sector to pick up pace in the medium term Supply side factors Demand side factors RM and Payment terms and Payment terms and Labor Availability of finance Railway demand equipment costing pricing • No restriction on • No restriction of • No major impact as • No major impact as • Increase in AR for • No major impact availability of raw availability of labor the construction overall project funding EPC companies as as railway materials and for construction activity was not mainly through central government’s movement was Overall ● ● ● ● ● ● equipment affected government funds finances were not impacted stretched • EPC company; • EPC company: • EPC company: Minor • EPC company: WC • EPC company: • Very low Limited Labor starts payment delays might requirement to increase Payments are passenger volume availability of joining back in cause AP to rise. RM as construction is milestone - based (only Shramik and Short - RMs due to month 2 and 3, but (steel etc.) cost to stalled. No major impact AR might increase special trains; term disruption. On - site disruptions decrease to liquidate as projects typically due to delay in goods services ● ● ● ● ● ● equipment to continue. inventory, but other funded by government, clearing pending will be fully (1 to 3 remain available, Contract labor RM (sand, gravel etc.) but some funds may be bills. Pricing for operational months) but transportation might not be cost will remain same. diverted for healthcare project is fixed of new equipment available Equipment cost to purposes during tender to be affected decline in short - term Equipment sitting idle will increase contractor cost • EPC company: • EPC company: • EPC company: • EPC company: WC • Terms – Payments • Increase in RM and More than 80% Supplier payments requirement reduces as re - start as demand as equipment laborers join back continue but AP to construction resumes. construction railway traffic Medium - availability return and start working. remain a bit higher resumes. AR start increases and term (4 to pre - COVID Contract labor than usual. RM and reducing, but cash government ● ● ● ● ● ● levels. starts returning equipment cost back flows impacted due resumes with its to 8 Construction to construction to pre - COVID level as to project delay. No construction months) resumes with sites construction resumes impact on pricing targets National Rail Plan with a strong push targets from the government • EPC company: • EPC company: • EPC company: AP • EPC company: WC • Terms – Payments • Demand to Long - Full - scale Full labor joins returns to pre - COVID requirement back to normalize but cash increase in term (9 resumption of rail back and level. RM and pre - COIVD levels flow remains accordance with ● ● ● ● ● ● construction construction equipment cost at impacted due to passenger and to 12 activity resumes at pre - pre - COVID level delays. No impact freight volume months) COVID - 19 pace on pricing growth Source: PGA Labs analysis © PGA Labs | 18 Increasing negative Increasing positive impact impact ● ● ● ● ● Railways Railways to benefit from government intervention in the long - run as public infrastructure spending increases to re - invigorate economy Track route length Expected annual growth Expected investment Expected industry recovery pattern capacity (FY19) rate (FY19 - 24) source 67.4K km 10 - 12% Public sector Highly positive Public Private players EPC companies Positive Passenger revenues remain subdued (only Shramik and Market Pre - COVID Monopoly No private players Oligopoly other special trains running) structure Recovery aided by levels freight volumes Time period Negative Highly Players negative AMJ 20 JAS 20 OND 20 JFM 21 • Fear of virus • Limited train • Return of normalcy as full - COVID19 stoppage operations scale service resumes ◕ ◕ ◑ ◑ impact of normal • Construction train resumes on • Impact on capex Capex • Delay in high - ticket Industry operations key ongoing allocation by government projects Pushback in outlook and projects might be impacted timelines of some projects construction • Delay in railway • Cost escalations modernization Projects Increase in cost due to • Availability of • Supply • Return of normalcy as related to station project delays to affect equipment chain construction resumes at full - modernization and margins and labor linkages pace procuring new rolling stock • Short - term consistent to be delayed decline in supply of capex RM at sites allocation Source: PGA Labs analysis © PGA Labs | 19 Low High ○◔◑◕● ○◔◑◕● Roads and bridges, and Railways Government can play an instrumental role to ensure continuity of capex plans and availability of WC with contractors to ensure smooth recovery Roads and bridges Railways • Ensure clearance of pending contractor bills to ensure • Ensure clearance of pending contractor bills to ensure ◑ ◑ their WC requirements are met during the phase where their WC requirements are met during the phase where construction is stalled construction is stalled Short - term (1 to 3 months) • Extension of toll collection period for concessionaires to • Ensure completion of planned maintenance works which ◔ ◔ compensate for revenue loss were stuck due to rail traffic movement • Inject liquidity in the system by reducing lending rates for • Ensure adherence to planned capex and timely award of ◑ ◑ companies building roads under BOT / HAM models contracts Medium - term (4 to 8 months) • Set up fund for providing WC at competitive interest • Ensure optimum utilization of freed - up track capacity (due ◕ ◑ rates to smaller sub - contractors who might find it difficult to lower passenger operations) for increasing railways’ to raise additional WC from banks share in freight movement • Ensure more projects are awarded under innovative • Aggressively chase modernization targets such as ◕ ◕ schemes such as HAM to ensure low - risk participation of station redevelopment, track length addition, bullet train private companies in the sector project etc. to ensure investment in the sector Long - term (9 to 12 months) • Speed up clearance for pending highway projects • Speed up clearance of pending proposals for PPP ◕ ◕ • Bundle projects to attract global players to ensure projects consistent flow of equity and debt capital into road projects Source: PGA Labs analysis © PGA Labs | 20 Low impact High impact ○◔◑◕● ○◔◑◕● How we help our clients We work with leading infrastructure asset owners and service providers and help them navigate the uncertainties surrounding the sector and economy Specific practitioner expertise Portfolio strategy Optimizing portfolio of clients by assessing current and future growth Madhur Singhal Aryaman Tandon plans and creating strong pipeline strategies Practice Leader Practice Leader Asset monetization and EPC and Waste Cost optimization investments management Identifying sustainable opportunities for profit improvement by focusing on strategic cost management Growth and scale - up Growing fast and scaling up by optimizing client offerings to target fast - growing infrastructure segments Shishir Mankad Neerav Gupta Domain Leader Domain Leader Customer loyalty and experience Infrastructure services Ports and SEZ Measuring and driving improvement in customer loyalty through detailed customer insights and proven frameworks Investment advisory Assessing market conditions and identifying key assets to acquire / hive off in line with long – term growth plans Anuj Mahajan Ashutosh Somani Practice Member Practice Member Enablement and implementation Urban development and Airports and Roads policy formulation Handholding incubation process of new business units and handling PMO for large - ticket construction projects How we help our clients We work across multiple manufacturing segments(Railways, T&D, Water, Fabrication etc.) to deliver best products at competitive prices Key management On Time Delivery Amrit Acharya Srinath Ramakkrushnan Zetwerk with its manufacturing capabilities ensures 100% On time Cofounder & CEO Cofounder delivery Quality With a quality team of >50 quality engineers, all manufacturing processes go through a stringent inspection ensuring best in class Vishal Chaudhary Rahul Sharma quality. Cofounder Cofounder Transparency and Real Time Visibility Zetwerk’s proprietary project management software ensures real time visibility of progress on ground. Pan India Presence Dheeraj Dhingra Peeyush Agarwal With manufacturing facilities in all corners of the country, we act as one Head Sales Strategy Business Head - Railways stop solution for all your manufacturing needs. Small to Large Projects We execute projects of all sizes ranging from few lakhs to upwards of multiple of crore How we help our clients We have a wide bouquet of deep business research skills and advanced analysis capabilities. Our research is unique, focusses on “What and Why” and our approach is holistic unlike a typical MR firm. We have successfully worked with clients across verticals Benchmarking (cost, Sector360: Scan / 50+ 100+ 250+ product features) fact - base Comparison of players across Detailed review and VC firms Investors Engagements relevant parameters landscape of a sector Our people have deep experience in Business research Company360: Competitor Company review intelligence Aryaman Tandon Seema Karwa Detailed review of company’s Intelligence and analysis Director Vice President details, strategy and operations of a company’s tactics Consumer Internet and FoodTech , Investments, and Ecommerce Consumer tech Survey administration and Voice of the Abhishek Maiti Vaibhav Tamrakar management customer Design, oversee, implement, Customer interviews and Vice President Vice President analyze and present findings survey - based analysis Shared mobility, Hospitality and EdTech, FoodTech , and E - groceries Mobility Mehak Batra Web scraping Process mapping Associate Vice President and analytics and best practices Scraping and analysis of public Enlist best practices Healthcare and Analytics data Connect with us - We will be happy to share perspectives Madhur Singhal Vaibhav Tamrakar Managing Director, Mumbai Vice President, Bengaluru madhur.singhal @praxisga.com vaibhav.tamrakar @praxisga.com M: +91 908 221 8254 M: +91 962 522 6697 Aryaman Tandon Abhishek Maiti For media queries, please Director, Gurugram Vice President, New Delhi contact aryaman.tandon@praxisga.com a bhishek.maiti @praxisga.com T: +91 11 4932 3564 M: +91 962 522 6702 Diksha Bhutani Parul Singhh Seema Karwa Ashutosh Somani Lead, Marketing and Communications Head, Marketing and Communications Vice President, Gurgaon Manager, Gurgaon marketing @praxisga.com pr @praxisga.com seema.karwa @pgalabs.com a shutosh.somani @praxisga.com M: +91 935 413 7148 M: +91 782 794 4926 M: +91 962 522 6696 M: +91 968 995 4290 Disclaimer: This material has been prepared by PGA Labs, which is the trade name of Praxian Global Private Limited (“Praxis”) with the in ten t to showcase our capability and disseminate learnings to potential partners/clients. This material can be referred to by the viewers on the internet but should be referenced to PGA Labs, if reused or adapted in any form or in any forum. The fr ame works, approaches, tools, analysis and opinions are solely Praxis’s intellectual property and are a combination of collection of best data we could find publicly, and Praxis team’s own experiences and observations. We make no representation or warranty, express or implied, that such information is accurate or complete, and nothing contain ed in here can be construed as definitive predictions or forecasts. Before reading further, the Recipient expressly agrees that this might not address any and all risks and challenges facing Recipient, its business and the markets within which it operates, nor all possible ma rk et conditions. No responsibility or liability whatsoever is accepted by any person including Praxis or its Business partners and affiliates and their respective officers, employees or agents for any errors or om issions in this document. This document is not complete without an accompanying oral discussion and presentation by Praxis though Praxis is not obligat ed to do so. Praxis does not have any duty to update or supplement any information in this document. Praxis shall not be responsible for any loss sustained by any person who relies on this presentation. © PGA Labs | 24 THANK YOU