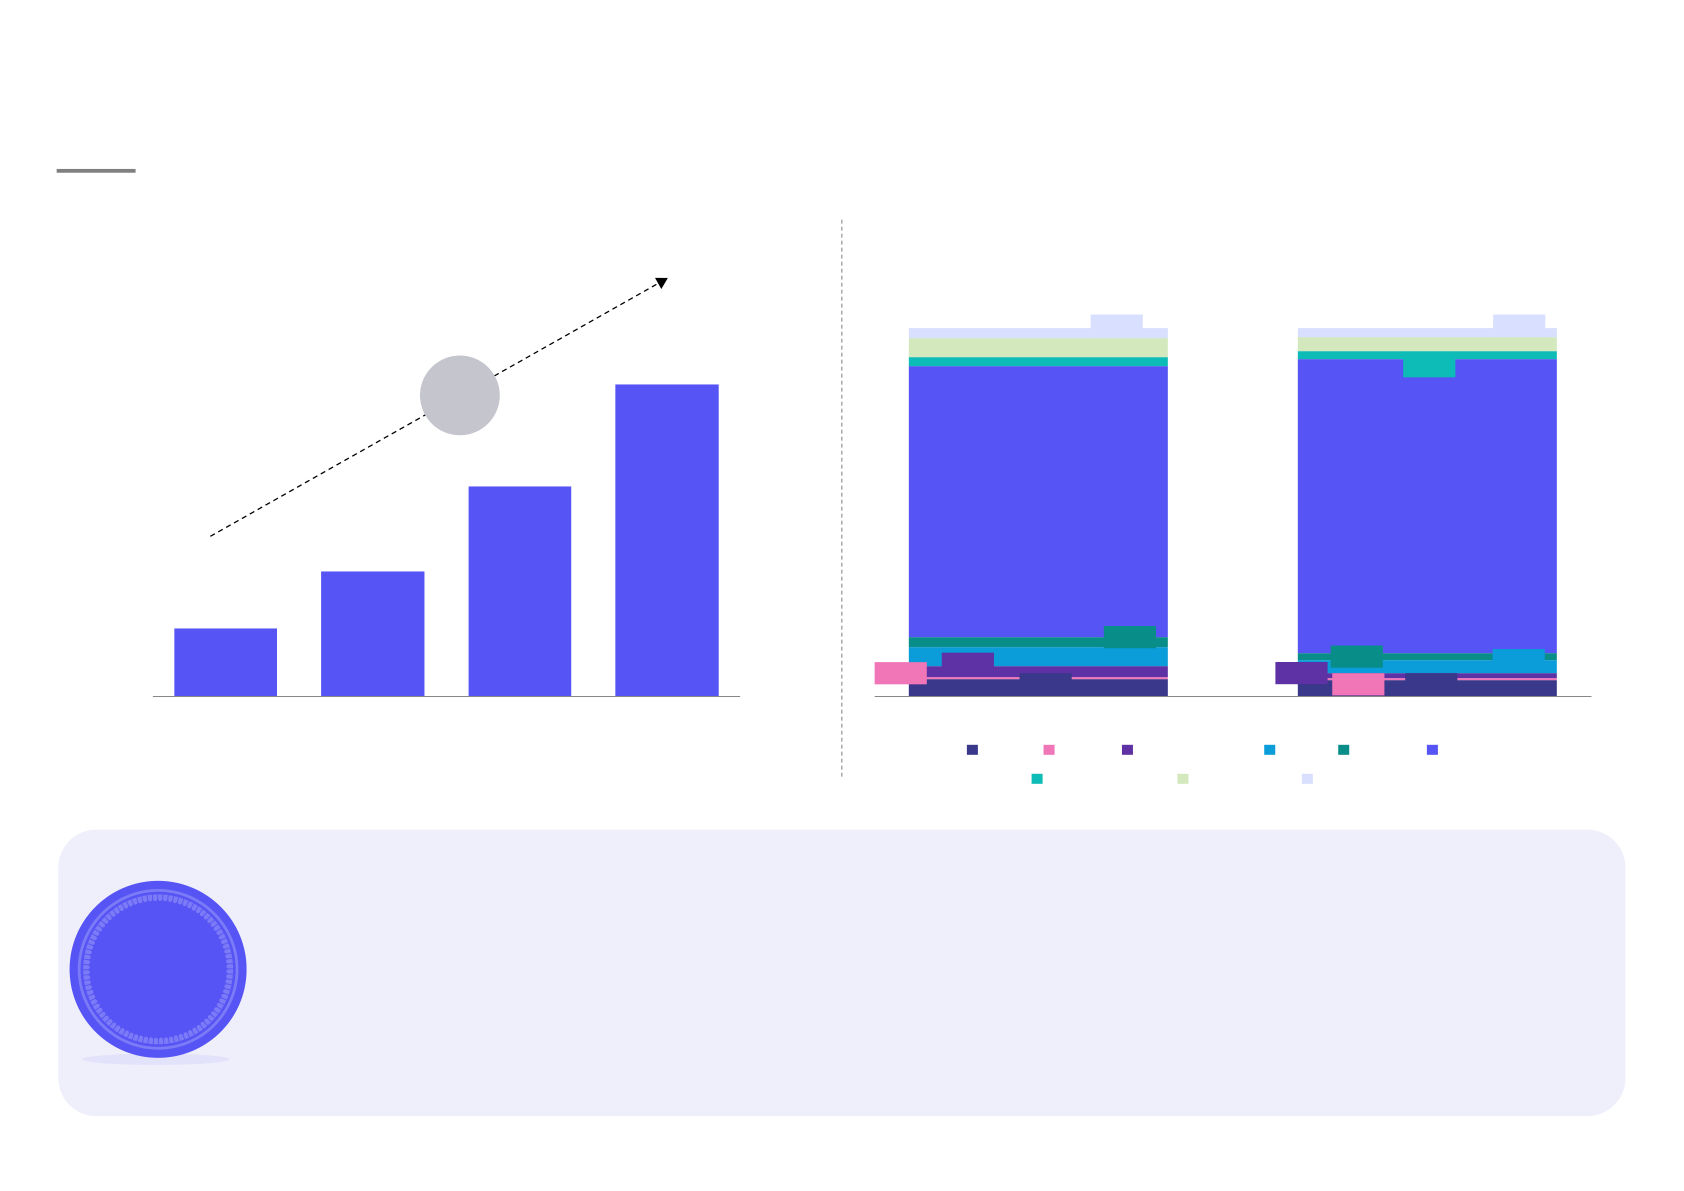
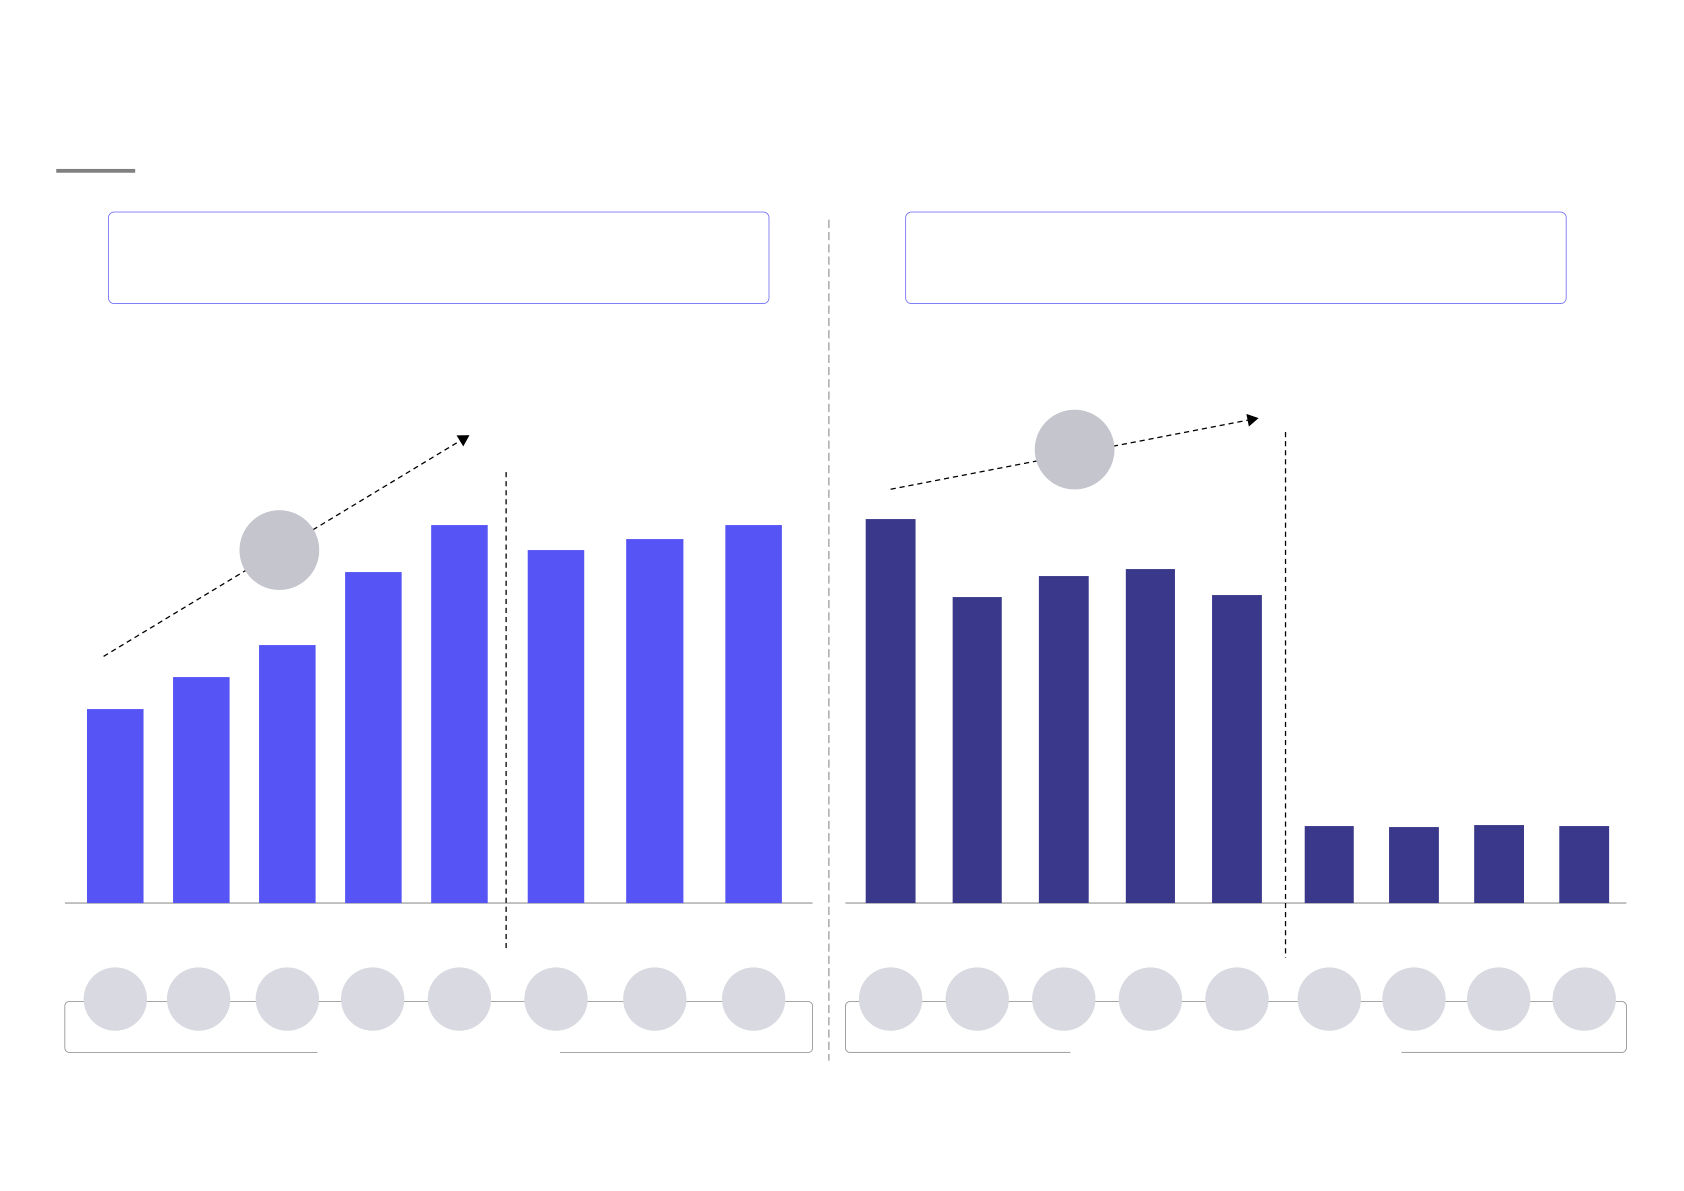
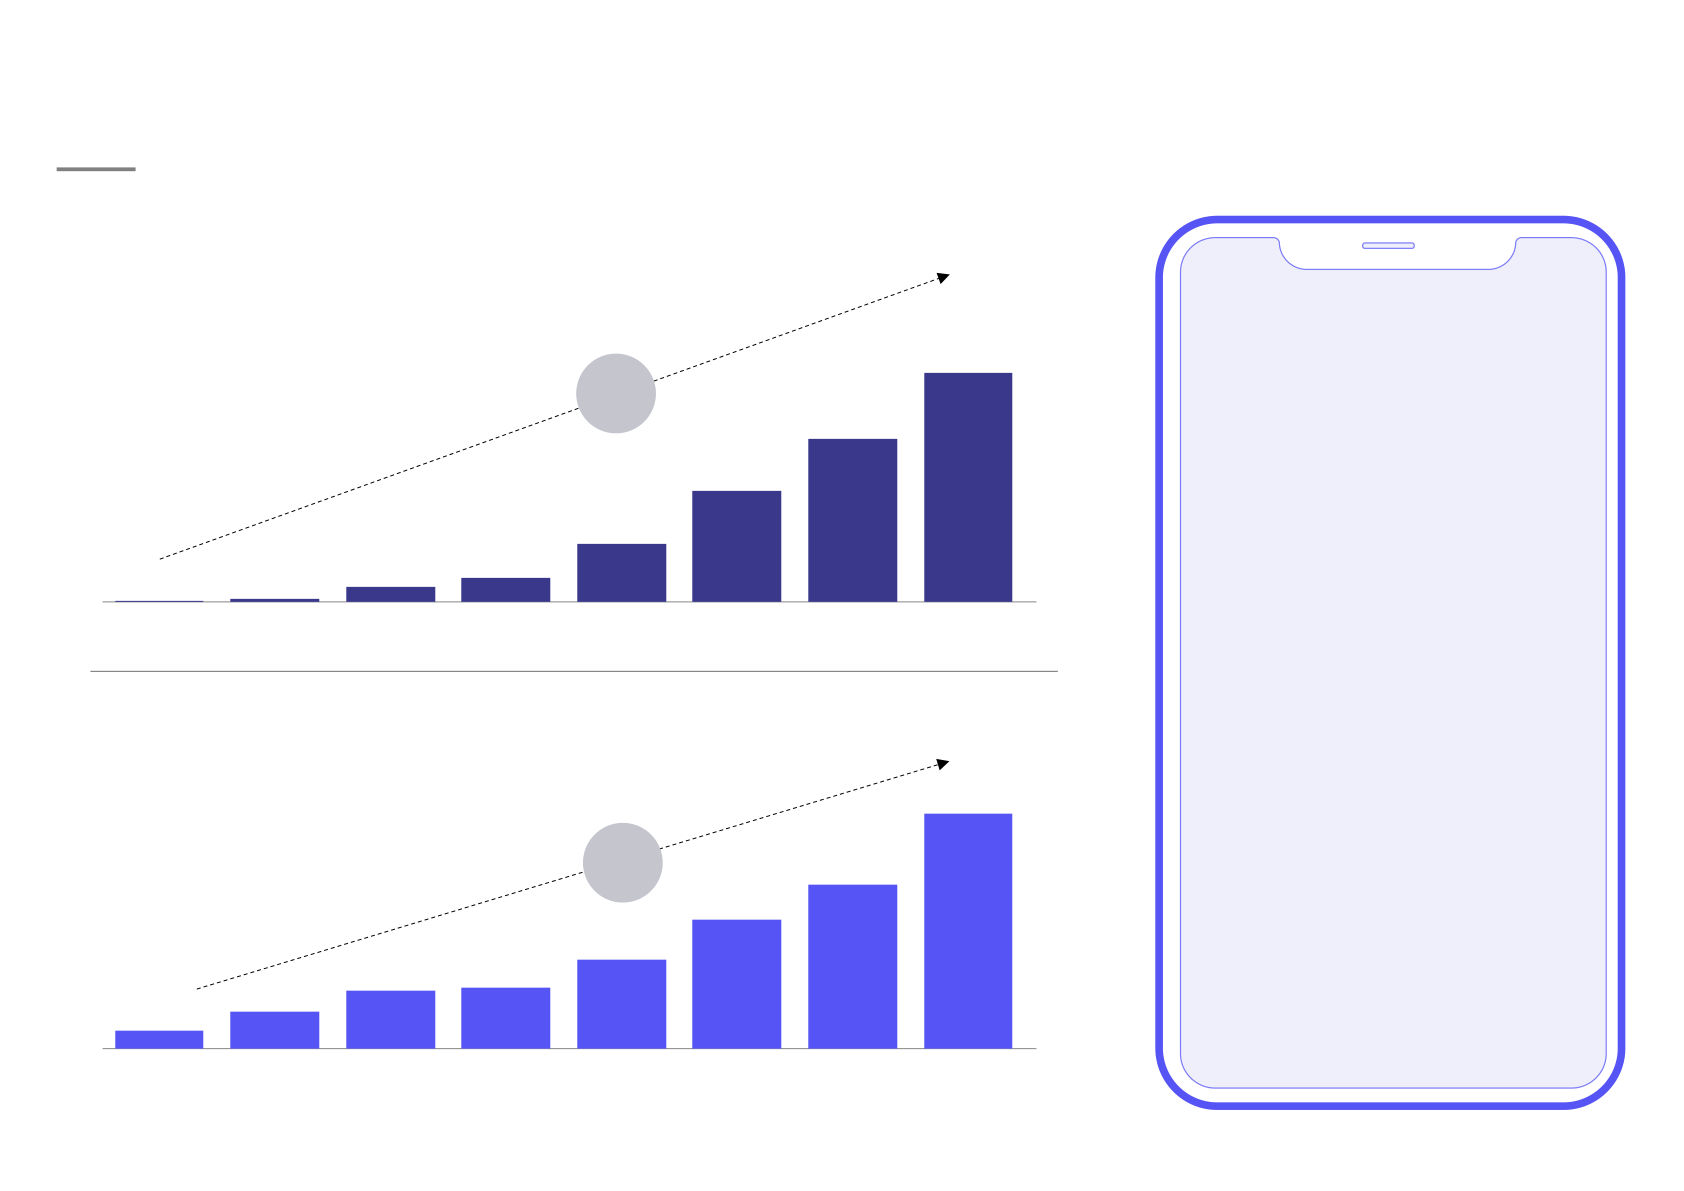
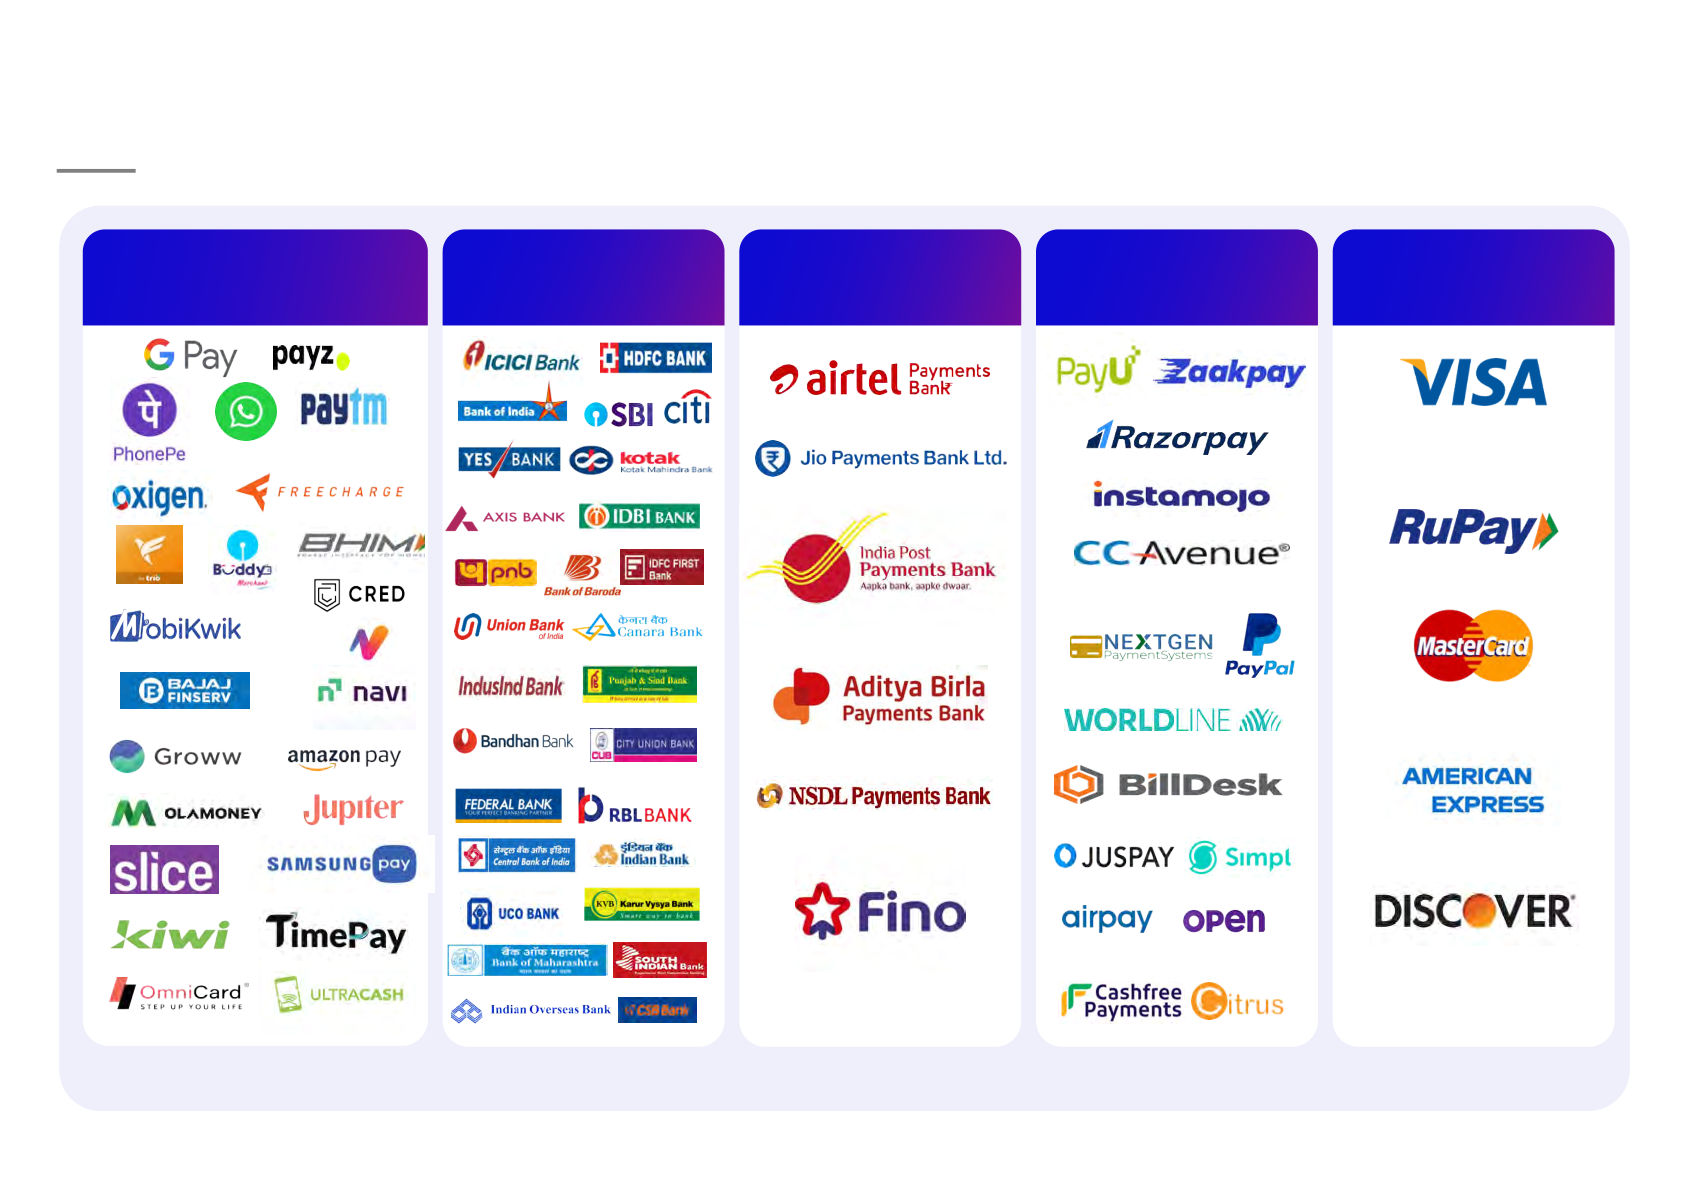
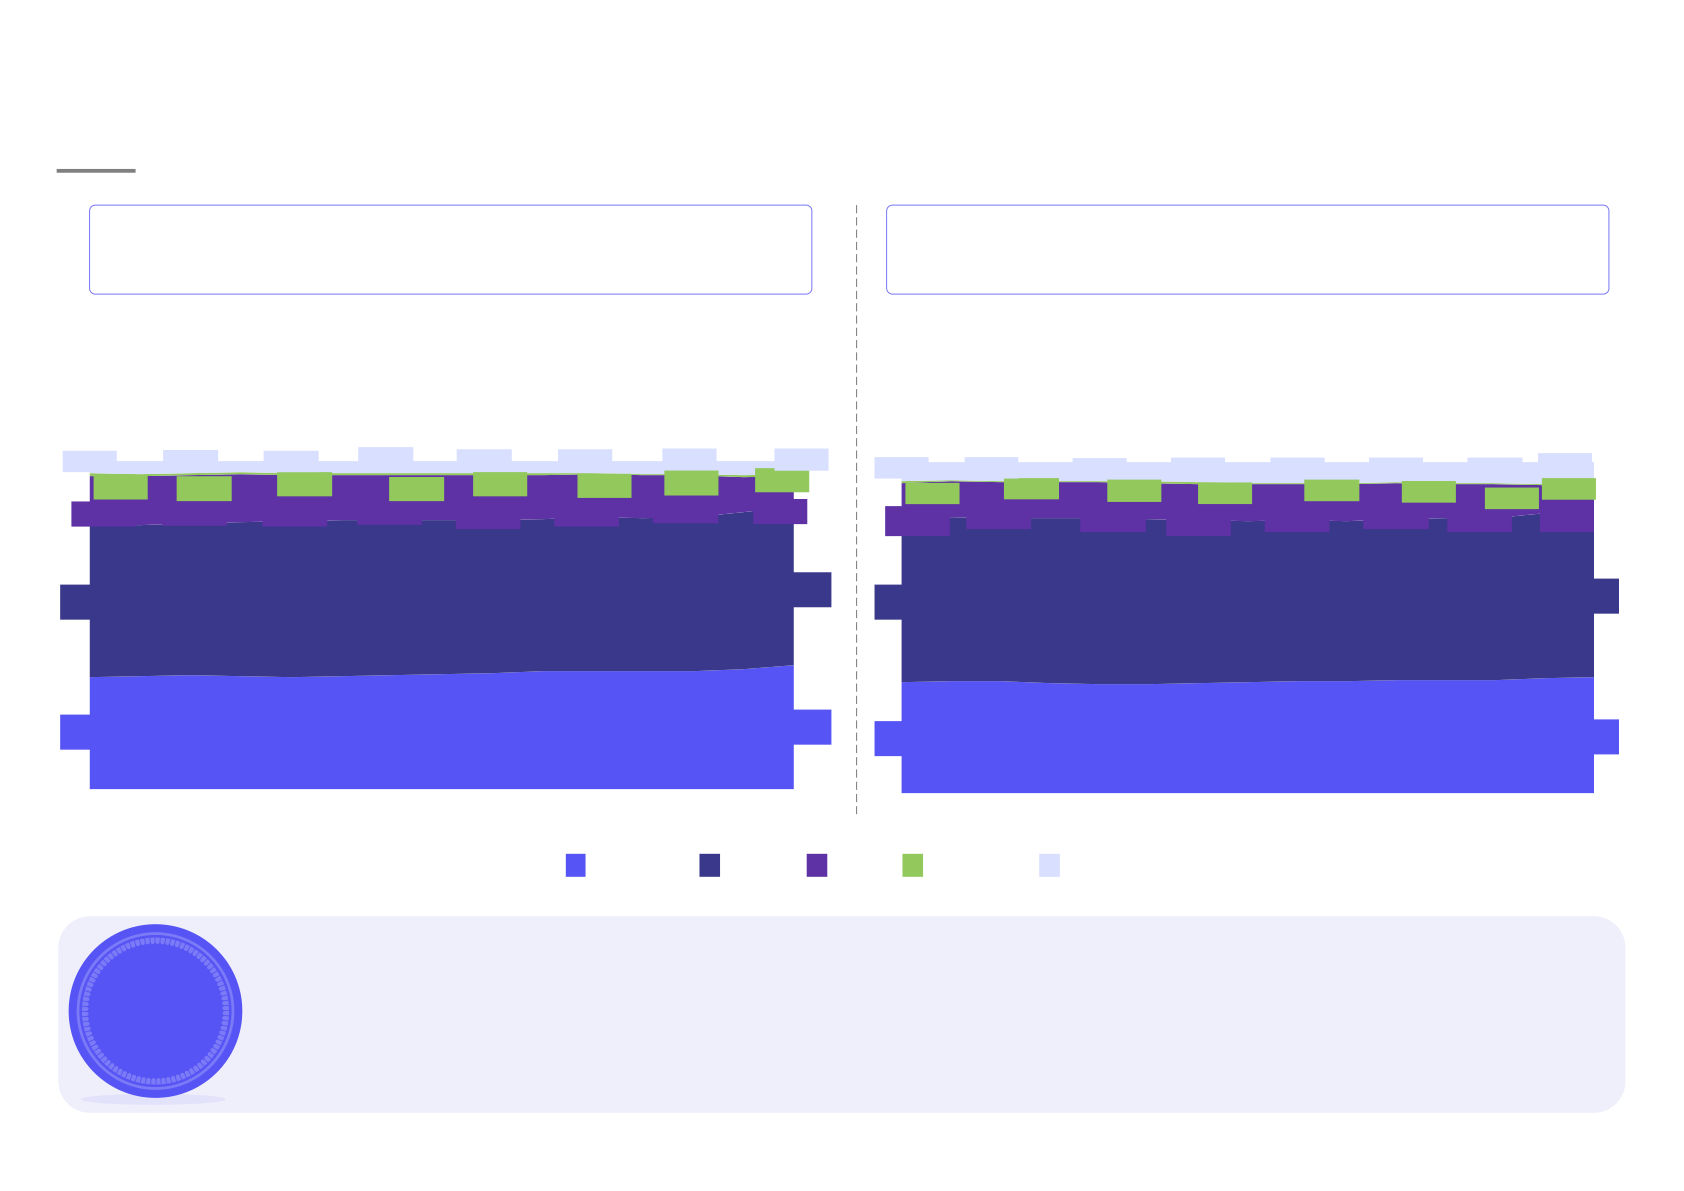
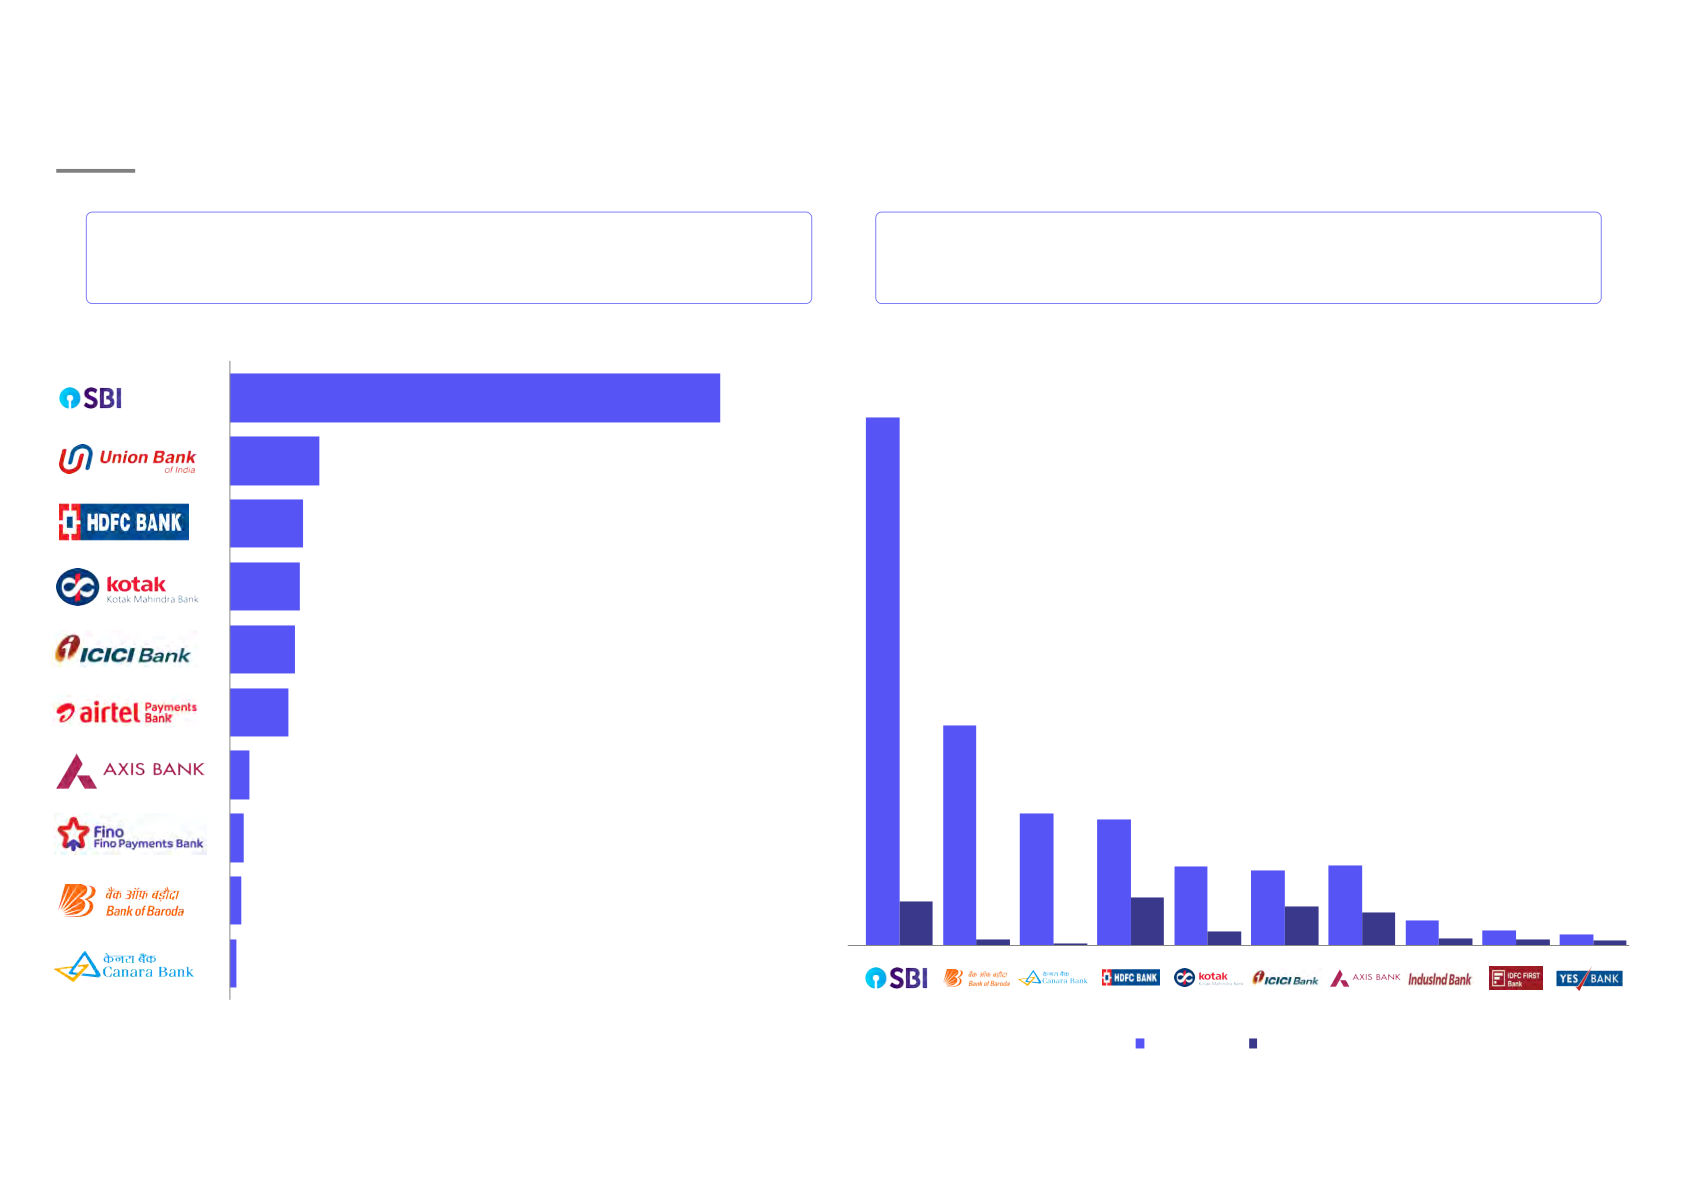
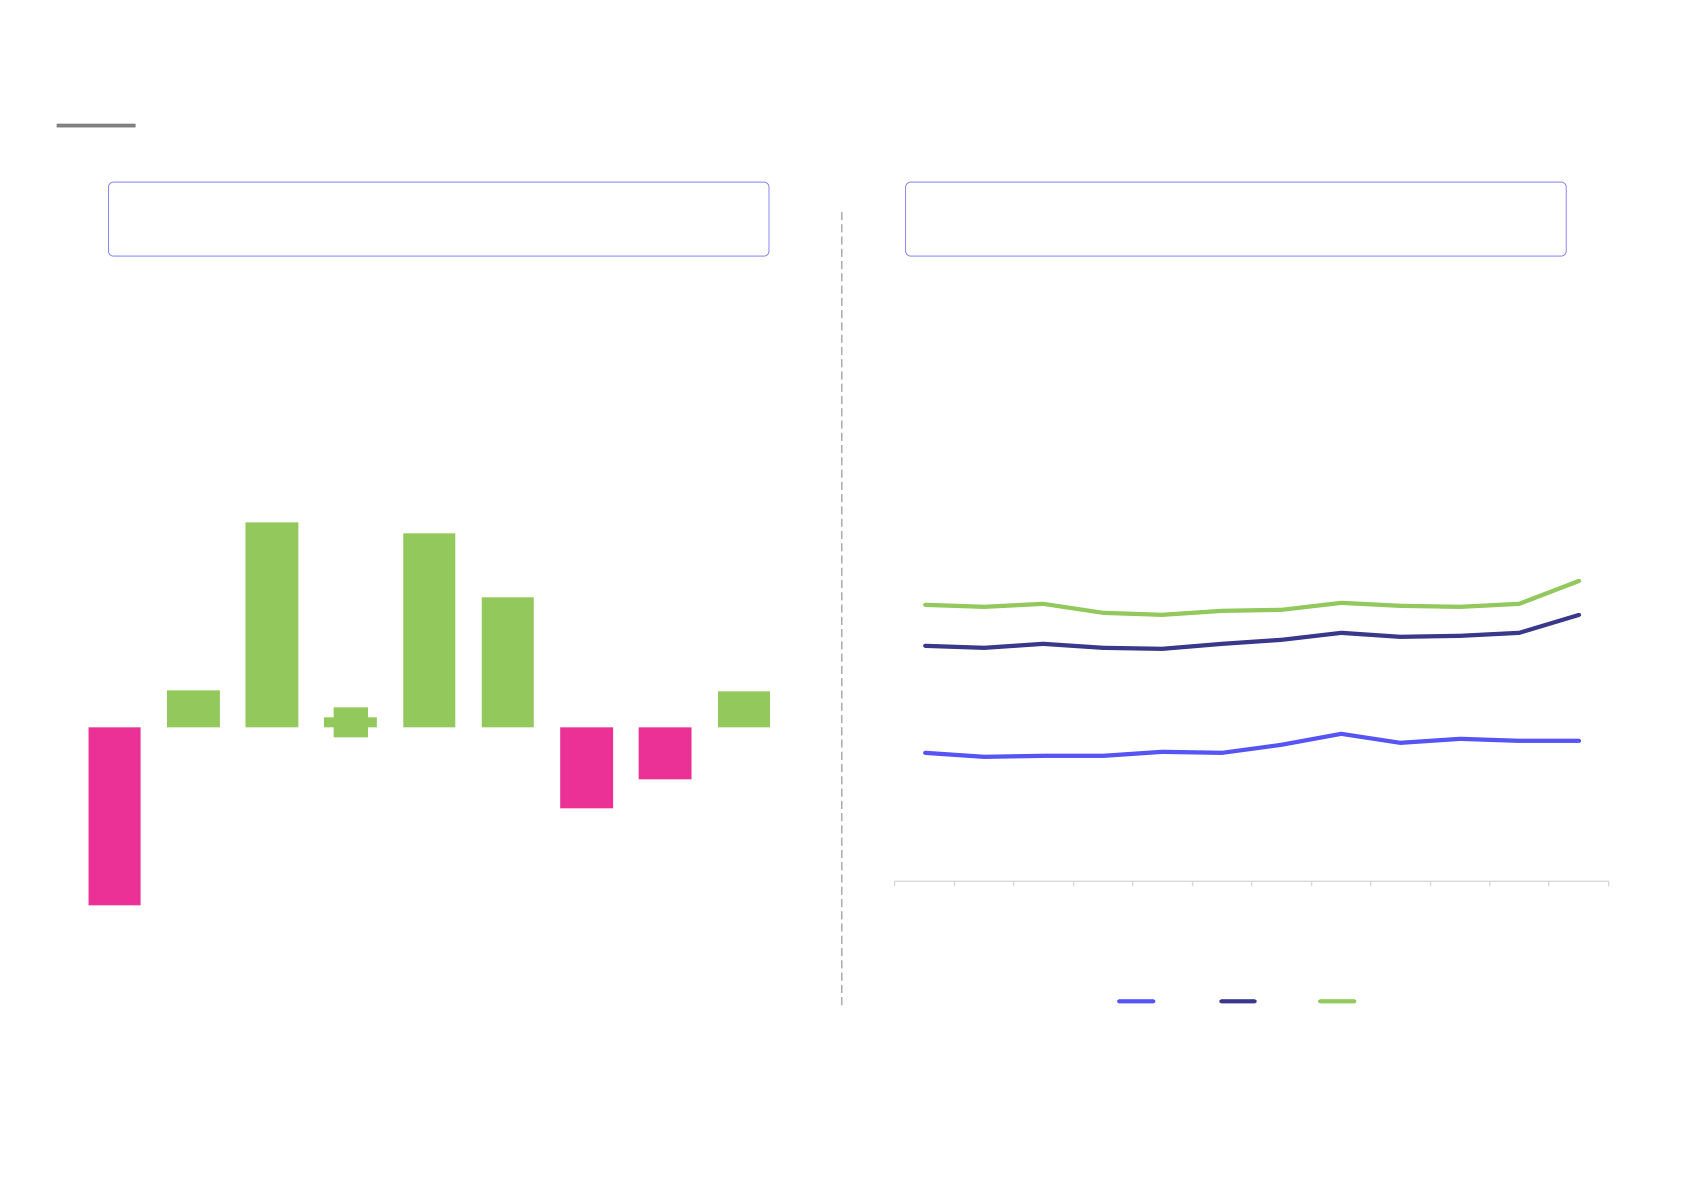
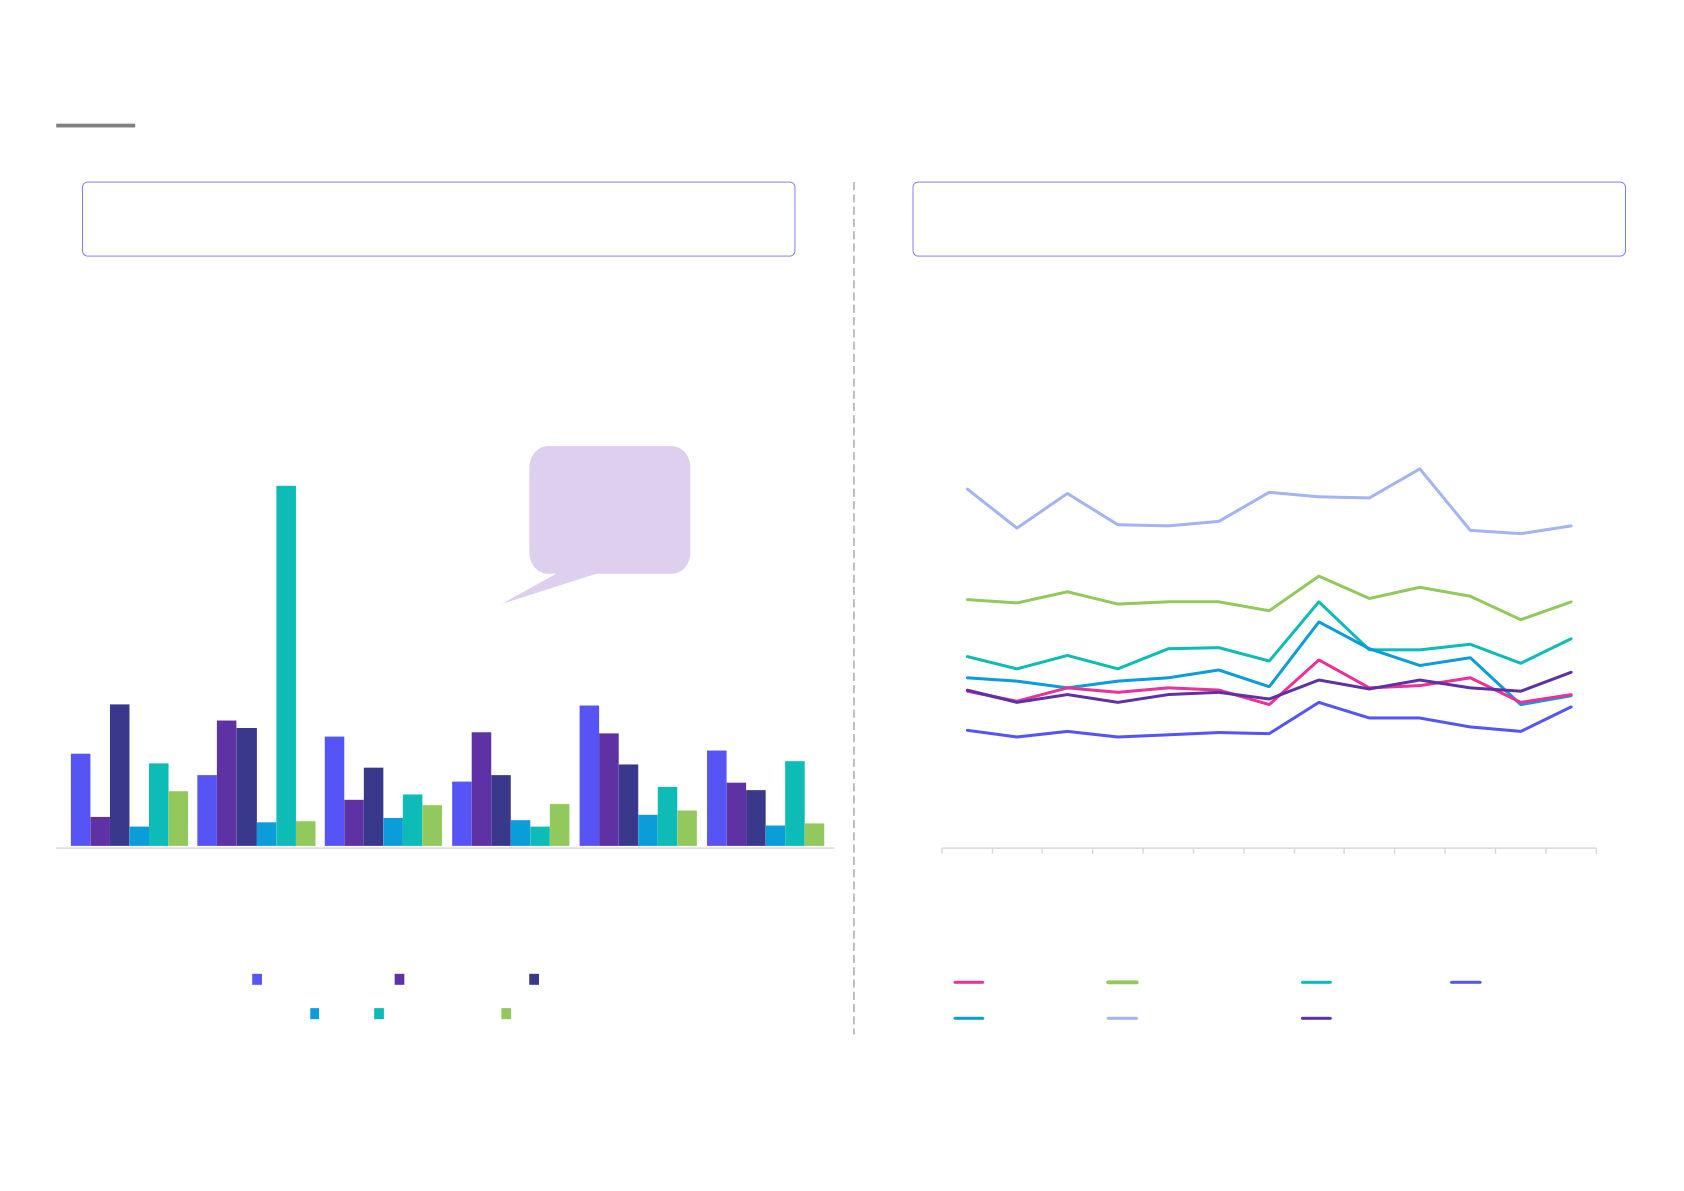
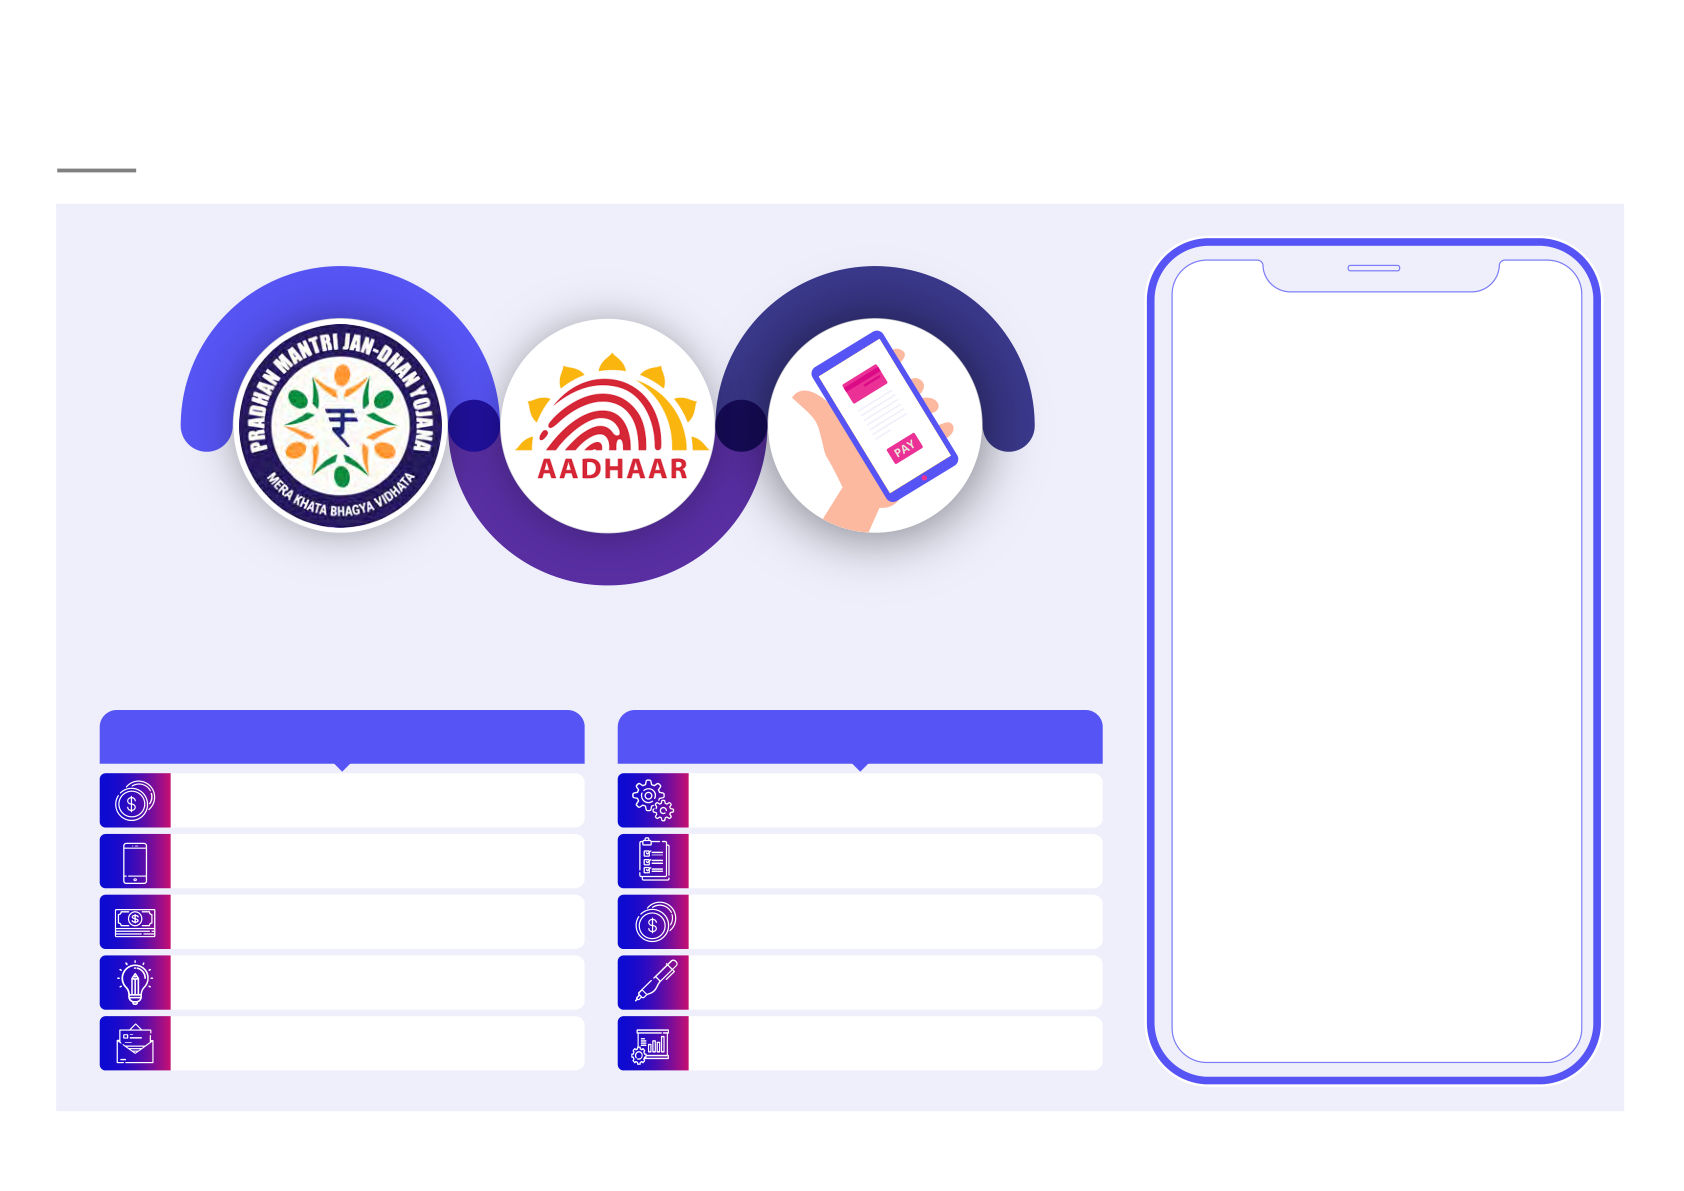
PAYMENTS LANDSCAPE IN INDIA WITH A FOCUS LENS ON UPI Report @Lattice Technologies Pvt. Ltd. JULY, 2024 Foreword India has seen an enormous While UPI continues to expand its growth in digital payments with presence in remote parts of the the volume of transactions country, Government and industry growing at a CAGR of ~55% from bodies are taking initiatives to FY21-FY24. While the value has ensure UPI expansion into grown by 20% in the similar time international remittances and frame. merchant payments to boost adoption further. Final RBI approvals This can be attributed to the in 2024 are expected to enhance "Digital India" initiative and open banking integrations. expansion of e-commerce. The Amar Choudhary Abhilasha Jaju country has evolved from a This report aims to provide various Chief Executive Officer, Director, Banking, Financial cash-centric economy to a digital industry stakeholders, including Services, and Insurance Intelligence and Insights payment ecosystem. Rise in business leaders, an overall disposable income among the perspective on the evolution of middle-class and the growing payment’s market with a focus on economy has led to increased UPI. The situation is evolving rapidly, online consumer spending. Card and some expected scenarios usage has increased since the might have slight variations. The pandemic, indicating a shift report reflects our perspectives as towards digital payments over of June 2024. We look forward to cash transactions at Point-of-Sale continuing the discussion with our terminals. Out of the total digital friends across sectors and payments volume, UPI contributes exchanging notes . a majority ~70-75%. Glossary Acronyms Definition Acronyms Definition 2FA Two Factor Authentication NCCS New Consumer Classification System AePS Aadhaar enabled Payment System NEFT National Electronic Funds Transfer BNPL Buy Now Pay Later NPCI National Payments Corporation of India CAGR Compound Annual Growth Rate PA Payment Aggregator CBDC Central Bank Digital Currency PAC Payments Advisory Council CLS Continuous Linked Settlement PDS Public Distribution System CoFT Card on File Tokenization PoS Point of Sale GDP Gross Domestic Product PPI Prepaid Payment Instrument IMPS Immediate Payment Service PSS Payment & Settlement Systems IoT Internet of Things RBI Reserve Bank of India ISO International Organization for Standardization RTGS Real Time Gross Settlement KYC Know Your Customer SBI State Bank of India LEI Legal Identity Identifier SFMS Structured Financial Messaging System MDR Merchant Discount Rate TSP Technology Service Provider MGNREGA Mahatma Gandhi National Rural Employment UPI Unified Payments Interface Guarantee Act [1/2] Executive summary Evolution of Payments Industry in India Payments Industry Overview • Pre-1980s: Widespread use of currency notes • The "Digital India" initiative and expansion of & coins. e-commerce significantly boosted digital payments. • 1980s-90s: Introduction of card payments and PoS terminals. • The country saw an evolution from a cash-centric economy to a digital payment • 2000s: Internet banking and online ecosystem , with digital payments seeing a transactions. growth of approximately 51%. • 2010s: Rise of mobile payments and digital • Introduction of innovative digital payment wallets. solutions including Hello UPI, UPI Lite, and Tap & Future Trends: Pay further drove growth. - Enhanced security measures with • Rise in disposable income among the AI-powered monitoring. middle-class and the growing economy led to - Emerging use cases in international increased online consumer spending. remittances and merchant payments. • Card usage has increased since the - Introduction of cutting-edge technologies. pandemic, indicating a shift towards digital payments over cash transactions at - Exploring blockchain-based central bank Point-of-Sale terminals. digital currencies. • UPI demonstrated exceptional growth in FY24, Competitive Landscape with a 48% increase in transaction volume • Paytm, PhonePe, Cred, and MobiKwik are the and a 38% increase in transaction value leading domestic payment app providers. Y-o-Y. • Google Pay and Amazon Pay have significant • In FY24, the number of UPI transactions market presence, competing with domestic surpassed 117.6B for the first time, reflecting players. the transformative impact of digital payments. • UPI has been a crucial instrument driving widespread adoption and is a key customer acquisition tool for players. © 1Lattice | 04 [2/2] • Expensive cybersecurity measures leading to ad Regulatory Landscape hoc approaches and vulnerabilities. • The RBI’s Payments Vision 2025 is built on the 4-E • High cost of installing infrastructure like PoS framework: E -payments for E veryone, E verywhere, and terminals discouraging small merchants from E verytime . accepting card payments. • Some of the key steps taken as part of this plan Government Initiatives: include: - Zero customer liability policies. - Authorized 9 payment aggregator (PA) licenses as - Switch-on/switch-off options for digital of Jan’24 . transactions to restore confidence and limit - Increased e-mandate limit for recurring payments customer liability. to INR 100K per transaction for certain categories . - JAM (Jan Dhan-Aadhaar-Mobile). - Pre-sanctioned credit lines can now be linked to - Direct biometric identification. UPI, further driving credit penetration . Future plans: Way Forward for Investment - Internationalization of Indian payment methods • UPI expansion into international remittances and - Drive penetration of UPI further via conversational merchant payments to boost adoption further. payments (UPI Hello) . • Final RBI approvals in 2024 expected to enhance - Regulate FinTechs to evaluate business models open banking integrations. and ensure financial inclusion while protecting • Facilitating fintech innovation and enabling customers. value-added services such as personal financial - Extend market trading hours and introduce UPI in management tools. the equity segment . Emerging Technologies: - Adoption of voice payments, digital rupee, wearables, and contactless cards. Challenges and Government Initiatives • Potential for blockchain to interconnect global Challenges: financial infrastructure. • Limited options for non-smartphone users. - Growing investments from firms and • Fraud due to customer vulnerability and system governments in blockchain technologies. breaches. © 1Lattice | 05 Agenda Payments Industry Overview Evolution of Payments Industry in India Competitive Landscape Regulatory Landscape Challenges & Government Initiatives Way Forward Payments industry overview The total payments volume in India grew by 50.3% from FY22-FY24, primarily driven by digital payments which saw a CAGR of approximately 51% Total Payments Transaction Volume Growth Drivers (# K Cr) • Rising adoption of digital payments - Supported by government initiatives like "Digital India" and the strong growth of e-commerce CAGR 16.5 • Evolution from a cash-based system with limited debit 0.06 –7.41% card usage for cash withdrawals to a digital payments CAGR ecosystem 50.3% • Widespread adoption of multiple payment products and systems 11.5 • India’s growing economy and an increase in disposable 0.071 income among the middle-class contributing to a surge in consumer spending online, including e-commerce, gaming, and financial services 7.3 16.4 50.92% • Growth in digital payments also driven by various factors 0.07 - Launch of new and innovative payment products such as Hello UPI, UPI Lite, tap & pay etc. by companies 11.4 - Rising need for faster payment modes 7.2 - Strong push from the government and regulators towards the adoption of digital channels • Cash to card ratio, indicating the preference for cash over cards, has been on a downward trend since the pandemic, suggesting a FY22 FY23 FY24 shift towards cards for digital payments • Significant decrease in cash usage at point-of-sale terminals Digital Payments Paper-Based Payments Note: Paper-based payments consists of CTS (Cheque Truncation System) & other paper-based modes of payment © 1lattice | 07 Source(s): NPCI, Secondary research, 1Lattice analysis Payments industry overview Transaction volume in the digital payments market has shown a CAGR of 55% from FY21-FY24, with UPI making up ~80% of the total transactions in FY24 Digital payments transaction volume Non-cash retail transactions – volume share (%) (#, K Cr) (%, K Cr) 11.4 16.4 2.7% 2.4% 3.8% 5.2% 16.4 2.2% 2.6% CAGR 55% 11.4 73.5% 79.7% 7.2 4.4 2.9% 5.0% 2.0% 3.7% 3.0% 0.6% 1.4% 0.6% 4.6% 4.4% FY21 FY22 FY23 FY24 FY23 FY24 NEFT CTS Debit Card IMPS NACH UPI Credit Card m-Wallet Others • Digital payments rapidly becoming the preferred method for • Significant rise in mobile commerce adoption in recent years e-commerce transactions - Online retailers extending their reach beyond metropolitan - Paytm, MobiKwik, and PhonePe actively competing with areas to smaller towns and cities, driven by the growing use of mobile internet global players such as Google Pay and Amazon Pay Market - Widespread ownership of smartphones enabling more • Real-time payment solutions like BNPL increasingly popular as Trends Indians to access shopping websites quickly on their devices alternatives to credit cards for e-commerce checkouts - This trend is further supported by the availability of various • Major e-commerce platforms such as Flipkart and Amazon, payment solutions facilitating seamless mobile have introduced their own BNPL services, further driving the transactions adoption of these real-time payment options Source(s): NPCI, DigiDhan, Secondary research, 1Lattice analysis © 1lattice | 08 Payments industry overview The payments infrastructure in India saw major growth with the number of PoS terminals increasing at a rate of 18% from Mar'20 to Mar'24 No. of PoS terminals saw growth of PoS transaction volumes were recorded 3.9% to ~8.9M in Mar’24 at ~1.46B for FY24Q4 Average # PoS terminals in India # PoS transactions # in K # In M CAGR 4% 8,903 8,903 7,277 8,567 8,302 CAGR 7,790 6,337 6,205 18% 5,813 5,847 6,070 5,302 4,566 1,483 1,460 1,444 1,460 Mar 20 Mar 21 Mar 22 Mar 23 Sep-23 Dec-23 Mar-24 FY20 FY21 FY22 FY23 FY24 FY24Q1 FY24Q2 FY24Q3 FY24Q4 Mar 24 432 381 293 263 162 172 169 162 1195 1436 1286 1693 2415 713 589 647 614 Population / Terminal Total transactions (INR K Cr) Source(s): RBI, Worldometers, 1Lattice analysis © 1lattice | © 1lattice | 09 09 Payments industry overview The proliferation of Unified Payments Interface (UPI) transactions in India underscores the nation's rapid transition towards a cashless economy Month-Wise UPI Transaction Value (INR K Cr) Overview • UPI in India demonstrated 1,978 exceptional growth both in CAGR transaction volume and value during 167.8% 1,410 FY24 - Showcasing a Y-o-Y increase of 960 48% and 38% respectively - Growth is indicative of the 505 transformative impact of digital 206 133 payments in reshaping India's 24 2 financial landscape Mar'17 Mar'18 Mar'19 Mar'20 Mar'21 Mar'22 Mar'23 Mar'24 • In FY24, the total number of UPI transactions surpassed a monumental 117.6B No. of Banks Live on UPI • Both the NPCI and government entities have implemented strategies to increase the utilization of UPI 572 • Beyond India's borders, UPI's accessibility has expanded to several CAGR 399 countries, including Sri Lanka, 44.2% Mauritius, France, UAE, Singapore, 314 Bhutan, and Nepal, embracing its 216 utilization 148 142 • No. of banks live on UPI grew at a rate 91 of 44.2% over the course of just 7 44 years, indicating its widespread adoption Mar'17 Mar'18 Mar'19 Mar'20 Mar'21 Mar'22 Mar'23 Mar'24 Source(s): NPCI, Secondary research, 1Lattice analysis © 1lattice | 10 Agenda Payments Industry Overview Evolution of Payments Industry in India Competitive Landscape Regulatory Landscape Challenges & Government Initiatives Way Forward Evolution of payments industry in India The payments landscape in India has been growing rapidly over the past few years, showcasing a significant evolution Timeline of Growth 2016 United Payment 2012 Interface RuPay card (UPI) rolled scheme out launched Digital Payment Revolution (2000s-Present) Introduction of • 2000s: Internet Banking and Card Payments Online Transactions Early Payment (1980s-1990s) 2005 2010 Methods - Net banking enabled NEFT was NPCI rolled out • Introduction of (Pre-1980s) customers to conduct introduced IMPS card payments transactions online • Predominantly by banks & - E-commerce growth led to cash-based financial increased demand for economy, institutions online payment solutions widespread use of • Issuance of currency notes & • 2010s: Rise of Mobile 2004 1999 cards to urban coins Payments and Digital Wallets Oxigen, the first Billdesk introduced customers • Cheque Payments - Accelerated the adoption e-wallet was an e-Payment 1981 • Gradual used for large of mobile payment apps launched. Gateway First credit adoption in transactions and card - Launch of digital wallets retail outlets business dealings introduced like Paytm (2010), MobiKwik through PoS in India • Postal Orders (2009), and others terminals utilized for money - UPI introduced by NPCI in 1700s transfers & bill 2016, revolutionizing Cheques first used by Bank payments, real-time payments of Hindustan in India specifically in rural areas Source(s): Secondary research, 1Lattice analysis © 1lattice | © 1lattice | 12 12 Evolution of payments industry in India In the past 20 years, India has built the world’s largest digital payments infrastructure, with the digital economy set to account for ~20% of the country’s GDP by 2026 Change Drivers Future Ahead • Enhanced security defences - AI-powered monitoring, Risk multi-factor authentication, and Management anonymous sensitive data Sustained profitability - Reworked revenue models to capture Adapting platform value through merchant Business discounts, value-added services, and Models cross-selling opportunities • With support from major banks and payment apps, UPI expected to facilitate majority of all Growth digital payments in India by 2025 of UPI - New use cases around international Emerging technologies remittances and merchant payments to further boost UPI adoption Rising competition • Cutting-edge technologies demonstrate Rise of New various new payment methods Evolving customer needs Payment - Voice payments, digital rupee, wearables, Mechanism and contactless cards Government support towards - Digital rupee pilot by the RBI will also innovation provide insights into blockchain-based central bank digital currencies Source(s): Secondary research, 1Lattice analysis © 1lattice | 13 Agenda Payments Industry Overview Evolution of Payments Industry in India Competitive Landscape Regulatory Landscape Challenges & Government Initiatives Way Forward Competitive landscape The Indian payments market is moderately consolidated, with a few key players dominating the sector UPI & Payments Payments Services Payment Net/Mobile Wallets Banks & Gateways Networks Banking & Cards Note: The above list is indicative, not exhaustive © 1lattice | 15 Source(s): Secondary research, 1Lattice analysis Competitive landscape Both, PhonePe and Google Pay saw an increase in market share in Mar’24 in terms of transaction volume and value Share of Google Pay in terms of value increased to Share of PhonePe in terms of volume increased to ~35.2% in Mar’24 as compared to ~33.8% in Mar’23 ~48.6% in Mar’24 as compared to ~46.4% in Mar’23 Market share of top UPI platforms - Volume Market share of top UPI platforms - Value (B) (INR K Cr) 8.1 8.8 9.5 10.1 10.6 11.3 12.3 13.4 1,318 1,431 1,510 1,553 1,597 1,760 1,860 1,974 3.6% 3.6% 3.6% 3.8% 4.0% 3.6% 3.5% 3.6% 6.8% 5.9% 5.6% 5.6% 6.1% 6.2% 6.1% 6.4% 0.5% 0.5% 0.6% 0.5% 0.4% 0.7% 0.4% 0.3% 0.6% 0.5% 0.4% 0.3% 0.3% 0.4% 0.4% 0.3% 12.8% 13.9% 9.2% 14.6% 14.7% 14.1% 13.1% 10.8% 10.9% 10.9% 11.1% 6.8% 13.7% 10.4% 10.6% 11.1% 48.6% 50.8% 46.7% 46.7% 46.7% 47.2% 46.8% 46.4% 47.3% 49.4% 49.5% 48.5% 48.6% 48.8% 50.1% 49.0% 37.8% 36.2% 36.2% 34.8% 34.8% 35.5% 34.2% 34.4% 34.2% 35.2% 33.7% 33.8% 33.0% 33.4% 33.9% 34.1% Jan-23 Mar-23 May-23 Jul-23 Sep-23 Nov-23 Jan-24 Mar-24 Jan-23 Mar-23 May-23 Jul-23 Sep-23 Nov-23 Jan-24 Mar-24 Google Pay PhonePe Paytm Amazon Pay Others • Google Pay secured a significant market share with 5B services by the end of the year transactions - This cap was first proposed in 2022, pushing existing • Cred processed 138.5M transactions, whereas Paytm handled Market businesses to limit their market share over a two-year 1,117.1M transactions Trends period • NPCI considering revisiting its decision to impose a 30% • P2M transactions witnessed a 77% increase in volume, rising market share cap on payment companies that offer UPI from 21.84 B in FY23H2 to 38.73 B in FY24H2 Source(s): NPCI data, 1Lattice analysis © 1lattice | 16 Competitive landscape SBI dominates the market in terms of highest total number of outstanding cards and most number of active mobile banking users Bank-wise number of active users of mobile banking Bank-wise number of outstanding credit and debit cards # Lakhs (Mar'24) # Lakhs (Mar'24) 1,233.60 2,287 225 185.5 177.2 165.4 954 148.6 50 573 547 35 342.6 346 323 206 189 170 142 29.7 108 60 64 48 25 29 26 20 9 17.7 Debit Cards Credit Cards Source(s): NPCI, Secondary research, 1Lattice analysis © 1lattice | 17 Debit cards: # quarterly addition Debit cards have increased to ~4M in FY24Q4; Spend per debit card increased to ~INR 5K in Mar’24 Total number of debit cards increased by Spend per debit card has reached to 4.0M in JFM 24 ~INR 5K in Mar’24 Total number of debit cards added Average amount transacted per debit card (M, Jan 22 – Mar 24) (INR, Dec 22 – Mar 24) 5,387 4,995 4,936 4,963 4,917 4,980 4,921 4,980 4,823 4,778 4,851 4,862 23.0 21.7 4,773 4,455 4,388 4,403 4,462 14.6 4,329 4,217 4,189 4,262 4,195 4,178 4,260 4.1 4.0 1.1 -5.9 2,642 2,546 2,516 2,516 -9.1 2,449 2,472 2,301 2,313 2,301 2,235 2,250 2,255 -20.0 Apr May Jun Jul Aug Sep Oct Nov Dec Jan Feb Mar JFM AMJ JAS OND JAM AMJ JAS OND JFM 23 23 23 23 23 23 23 23 23 24 24 24 22 22 22 22 23 23 23 23 24 Total ATM PoS Note(s): PoS data has been split into PoS and e-commerce post April 2022 © 1lattice | 18 Source(s): RBI data, 1Lattice analysis New card addition and credit card spend HDFC Bank had the highest net increase in outstanding credit cards for the quarter JFM 24 HDFC Bank had the highest net increase in IndusInd Bank has seen an increase in the monthly outstanding credit cards in JFM 24 spend per credit card for the month of Mar’24 Quarter-wise net credit card additions Month-wise spend per credit card (INR K, Mar 22 – Mar 24) (K, OND 22 – JFM 24) 2,684 This net increase in outstanding credit 31.1 cards of Axis Bank is 28.0 due to acquisition of Citi portfolio 21.3 21.5 18.1 16.6 15.2 14.7 1,055 13.3 1,046 13.7 931 879 13.3 845 815 837 13.6 684 12.3 713 618 10.2 581 627 603 524 530 480 470 409 383 439 344 412 299 311 230 263 211 203 193 180 174 140 139 153 163 OND 22 JFM 23 AMJ 23 JAS 23 OND 22 JFM 23 Mar Apr May Jun Jul Aug Sep Oct Nov Dec Jan Feb Mar 23 23 24 HDFC Bank ICICI Bank SBI cards Axis Bank HDFC Bank ICICI Bank Kotak Bank RBL Axis Bank Kotak SBI Card Induslnd Bank RBL © 1lattice | 19 Source(s): RBI, 1Lattice analysis Agenda Payments Industry Overview Evolution of Payments Industry in India Competitive Landscape Regulatory Landscape Challenges & Government Initiatives Way Forward Regulatory landscape Driven by RBI's Payments Vision 2025, the regulatory regime has evolved around 6 attributes, i.e. safe, secure, fast, convenient, accessible and affordable options Key Regulatory Developments in FY24 PA Licenses: ▪ Around 140 applications were received by the RBI ▪ Seven final authorizations were granted by December 2023, updated to nine by January 2024 ▪ Many existing and new PAs awaiting final approval 4 E’s of the CoFT: Payments Vision ▪ NPCI mandates CoFT directly through card issuers ▪ Cardholders can generate tokens via their bank's platforms with explicit consent and additional factor validation E-Payments for Increased Limit for Recurring Payments: ▪ The e-mandate limit was raised from INR 15K to INR 100K per transaction for certain categories Everyone Cross-Border PA Licensing: ▪ New guidelines issued by RBI for entities facilitating cross-border payments, opening the business to non-bank entities Use of Credit Lines for UPI Payments: Everywhere ▪ Users can now link pre-sanctioned credit lines with UPI accounts, integrating credit line usage with UPI payments Adoption of ISO 20022: ▪ RBI standardizes data requirements for ISO 20022 to align India’s Everytime payment operations with global standards RBI's Regulatory Sandbox for Fraud Prevention: ▪ Six companies selected for the "Test Phase" starting February 2024, with a focus on payments fraud prevention © 1lattice | 21 Source(s): RBI, Secondary research, 1Lattice analysis Regulatory landscape RBI has transformed from being a regulator, operator, and facilitator to a creator of an environment for the structured development of the payments ecosystem Goal posts for Payments Vision 2025 Integrity: Implement alternate authentication methods for digital payments, expand LEI Overview usage in all transactions, and enhance offline contactless transit payments. • NPCI mandated UPI Improve scalability, resilience, and explore local processing of payment systems members to adopt Tap & Pay for in-store payments Inclusion: - Launch of a beta Enable geotagging of payment infrastructure, update PPI guidelines, and regulate program for using UPI in significant payment intermediaries. Enhance Cheque Truncation System, extend the equity segment market trading hours, regulate BigTechs/FinTechs, evaluate charges, and digitize government transactions - "Hello UPI" for conversational payments • Fintech startups received Innovation: substantial funding, with Develop a framework for IoT and context-based payments, migrate RBI payment digital payments companies messages to ISO 20022. Establish a system for online merchant payments, review being major beneficiaries multiple payment identifiers, and explore guidelines for BNPL services - Significant mergers and acquisitions in the Fintech Institutionalization: space Conduct a comprehensive review of PSS Act provisions, establish a PAC, and • Regulations expected for operationalize the National Card Switch for PoS transactions. Actively engage in web-aggregation of loan international standard-setting discussions products and TSPs • Dedicated information Internationalization: repository for the Fintech Promote global adoption of RTGS, NEFT, UPI, RuPay cards, and expand SFMS & InFiNet ecosystem proposed frameworks internationally. Implement 2FA for cross-border card transactions, seek INR inclusion in CLS, and enhance payment processing efficiency with the introduction of CBDCs for domestic & cross-border transactions Source(s): RBI, Secondary research, 1Lattice analysis © 1lattice | 22 Agenda Payments Industry Overview Evolution of Payments Industry in India Competitive Landscape Regulatory Landscape Challenges & Government Initiatives Way Forward Challenges & government initiatives A substantial 71% of digital payment users predominantly reside in urban areas, with half of them belonging to the NCCS A category Challenges Overview • Lack of options in digital payment products for a non-smartphone user • Instances of frauds, mostly due to Infrastructure Lack of Digital customer vulnerability or sometimes Strain Literacy on account of system breaches • Apprehension in new users to move towards digital payments - Steps such as zero customer liability, switch-on / switch-off of digital transactions taken as customer protection measures to 01 02 restore customer confidence and limit the liability of the customer • High cost of implementation of cyber security measures leads to a tendency 04 03 of an ad hoc approach which become points of vulnerability leading to instances of system breaches - Cost of digital payments is a deterrence for users to adopt digital payments as against cash which is perceived to be free by Gap in Financial Security such users Inclusion Concerns • Cost of installation of infrastructure like PoS dissuades certain small merchants to adopt them Note: NCCS A Category comprises of all those who are literate and own at least 6 durables © 1lattice | 24 Source(s): Secondary research, 1Lattice analysis Challenges & government initiatives Financial inclusion in payments in India has been driven by the government’s adoption of the JAM strategy JAM Trinity Jan Dhan Yojana Mobile Overview • JAM- Three modes of identification to implement one of the biggest reforms in independent India – direct subsidy transfers to the poor • Current subsidy schemes take Aadhaar an indirect route to reach the poor of the country. Examples are the PDS, the MGNREGA, etc. RBI and NPCI have taken various steps over the years to accelerate innovation and development in the payments industry in India - Costlier to the exchequer, plagued by corruption, numerous intermediaries NPCI RBI before the actual benefit reach the poor Support towards Jan Dhan Yojana Reduction of MDR • With Aadhaar helping in direct biometric identification of Implementation of Aadhaar-based KYC Introduction of UPI disadvantaged citizens and Jan Dhan bank accounts and Digital payment acceptance tax rebate Rolling out of RuPay Cards mobile phones allowing direct transfers of funds into their Simplified branch authorization policy Introduction of IMPS accounts, it may be possible to cut out all the intermediaries Implementation of AePS KYC relaxation for small transactions Source(s): RBI, NPCI, Secondary research, 1Lattice analysis © 1lattice | 25 Agenda Payments Industry Overview Evolution of Payments Industry in India Competitive Landscape Regulatory Landscape Challenges & Government Initiatives Way Forward Way forward The industry is undergoing massive shifts due to new technologies, rising expectations, integration with other industries, and skyrocketing digital adoption Future Outlook Overview • UPI has revolutionized P2P transfers in India since its launch in 2016, Growth of UPI clocking over 22.7B transactions worth INR 6,415.8K Cr in FY24 - With support from major banks and payment apps, UPI is expected to facilitate over half of all digital payments in India - New use cases around international remittances and merchant payments to further boost UPI adoption Expansion of Account - NPCI aims to double up to 15-20B monthly UPI transaction Aggregator Framework volumes • As more AAs receive final RBI approvals in CY24, this is expected to facilitate deeper open banking integrations, fuel fintech innovation, and enable value-added services like personal financial management tools Rise of New Payment • Cutting-edge techniques demonstrate various new payment Mechanisms methods, including voice payments, digital rupee, wearables and contactless cards • The digital rupee pilot by the RBI in select cities and industries will provide insights into blockchain-based central bank digital currencies • Blockchain technology can interconnect financial infrastructure Regulatory across the world Developments - As more firms and governments invest in these fields, there is a growing level of confidence in blockchain technologies Source(s): Secondary Research, 1Lattice analysis © 1lattice | 27 We are here for you Let us know how we can meet your business requirement? Abhilasha Jaju Amar Choudhary Chirag Khandelwal Director, Insights and Consulting Chief Executive Officer Senior Associate E: abhilasha.jaju@1lattice.com E: amar@1lattice.com E: khandelwal.chirag@1lattice.com For media queries, Vaishnav Kumar Rai please contact Manager – Corporate Communications E: communications@1lattice.com M: +91 782 794 4925 www.1lattice.com Disclaimer: This material has been prepared by 1Lattice, which is the trade name of Lattice Technologies Private Limited (“1Lattice”, “we” or “our”) with the intent to showcase our capability and disseminate learnings to potential partners/clients. This material can be referred to by the readers on the internet but should be referenced to 1Lattice, if reused or adapted in any form, or medium and on any forum. The frameworks, approaches, tools, analysis and opinions are solely 1Lattice’s intellectual property and are a combination of the collection of the best data we could find publicly, and the 1Lattice team’s own experiences and observations. Any information provided herein is only for informational purposes and you are advised to perform an independent analysis of the same before making any decision based on such information. The information does not constitute any business advice or guidance and is to be construed as a general summary based upon the publicly available information and our interpretation of the same using our resources. For this material, we may have relied upon different sources of information which may be primary sources, publicly available information, and relevant information available with us. We make no representation or warranty, expressed or implied, that such information is accurate or complete, and nothing contained here can be construed as definitive predictions or forecasts. Before reading further, the Recipient expressly agrees that this might not address any and all risks and challenges facing the Recipient, its business, and the markets within which it operates, nor all possible market conditions. Any use of the information provided herein by the viewer shall be at the sole risk of the viewer and 1Lattice or its business partners, affiliates, agents, officers or employees shall not be liable for any unintended or adverse effect or outcome from the use of such information by the reader. 1Lattice does not have any duty to update or supplement any information in this document. 1Lattice shall not be responsible for any business or commercial loss sustained by any person who relies on any information provided herein. Any and all logos of companies used in the information provided herein have been published for information purposes only and 1Lattice does not hold any liability in connection therewith. Product in Spotlight - Pulse This report was curated using our cutting-edge product, Pulse. Pulse provides comprehensive visibility into your industry benchmarks and best practices. From tracking macro indicators and government regulations to specific operating metrics and best practices of your peers, from monitoring pricing strategies to evaluating brand reputation through sentiment analysis and social listening, Pulse covers all bases to help you adapt your strategies for beating the industry standards. This report offers invaluable insights into India's robust economy, driven by ongoing reforms that enhance the business environment. In this report, Pulse empowered our expert team with comprehensive research tools to analyze the overall UPI and payments landscape. By leveraging Pulse, we gained a detailed understanding of the factors driving payment trends and the opportunities they present. This comprehensive approach allowed us to present a thorough analysis of the current payments landscape in India, offering you the insights needed to navigate and capitalize on emerging opportunities. Equip your business with the intelligence provided by Pulse to stay ahead in today's competitive market, consistently outperform industry standards, and achieve sustainable success WHAT WE DO 4 200+ Making organizations effective through Offices in India Annual data-driven insights, innovative Vision engagements products solutions and proven expertise to enable better decisions To provide technology led solutions 130+ 50+ that unlock that power of trustable Mission Team members Inhouse data, actionable research, and deep research team network of experts 1,000+ 2M+ On-ground staff B2C Panel Data + Accumulated People/ Professionals/ knowledge Service providers 500K+ 300K+ B2B Panel Experts & professionals 20% 100% Cost savings Controlled output & timeline Research +91 976 925 3702 abhilasha.jaju@1lattice.com Delhi NCR | Mumbai | Bengaluru | UAE | KSA | Singapore