
- India’s 2030 data center capacity forecasts vary significantly, but each scenario implies a substantial increase in standby generation requirements.
- Redundancy architecture, gas substitution, and storage adoption can influence the scale of genset demand, while the 1.5x standby convention remains a key assumption.
- As data center capacity expands beyond established hubs, the opportunity for genset OEMs increasingly depends on service-network coverage and geographic readiness.
India’s data centre build implies incremental standby demand several times the size of the entire genset market. Argue about the scenario all you like; the conclusion holds in everyone.
Data center capacity forecasts for India in 2030 range from 4 GW to 12 GW. That is an unusually wide spread, driven almost entirely by assumptions about AI workload growth that cannot yet be settled.
Rather than pick a side, it is more useful to ask a different question: Does the genset conclusion change depending on which forecast you believe?
The calculation
Published convention puts standby generation at approximately 1.5 MW per 1 MW of IT load (IMARC). Applying that to the three main Indian forecasts gives the following incremental standby requirement through 2030.
Implied incremental standby capacity to 2030, three scenarios
Conversion applied: 1.5 MW standby per 1 MW IT load. The shaded floor is the argument
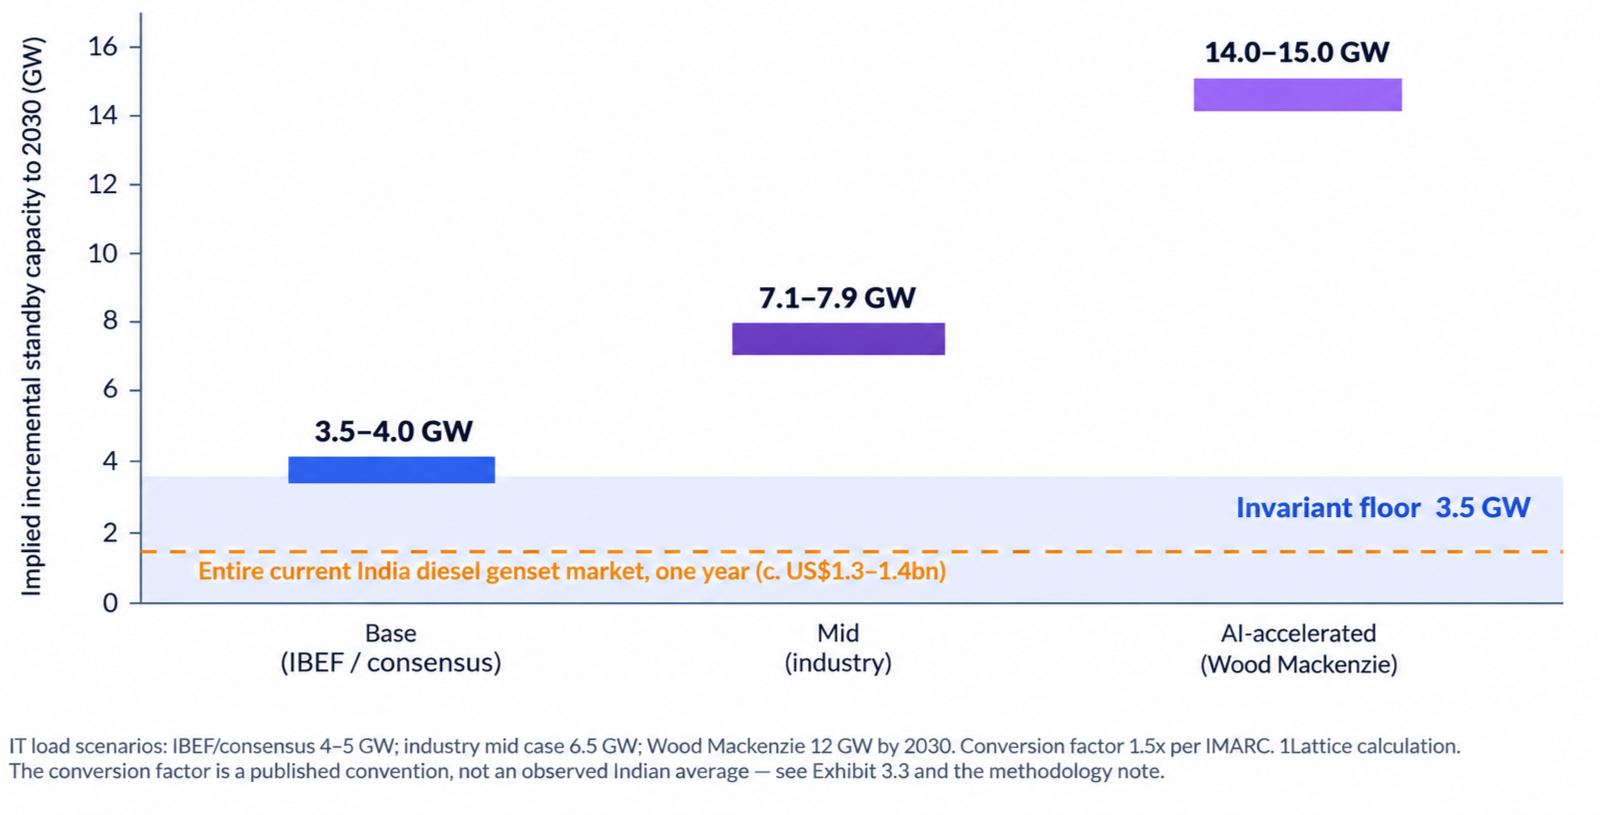
India’s entire diesel genset market currently stands at roughly USD 1.3–1.4B annually (IMARC, 2026). Even the base scenario implies incremental demand from a single end-use segment equivalent to several years of current national output.
The shaded region is the point. Readers will disagree, legitimately and probably strongly, about which scenario is right. But nobody in that disagreement can push the implied standby requirement below about 3.5 GW without rejecting the lowest published forecast outright.
An argument that survives the reader’s own assumptions is worth more than one that requires them to adopt yours.
The context, briefly
India added 387 MW of IT capacity in 2025, more than double the 191 MW added in 2024 (Rubix Data Sciences, 2026). By January 2026, the country had 271 operational data centers.
Commitments from Amazon Web Services, Microsoft, and Google total roughly USD 67.5B, with a broader announced pipeline of USD 60–70B over five years (IBEF, 2026). A 20-year tax holiday framework runs through 2047, while construction costs are 30–40% below those in China and the United States.
Three variables that move the number
- Redundancy architecture: The gap between N+1 and 2N is roughly the difference between 1.25x and 2.0x standby capacity per MW of IT load. This is the largest single swing factor, determined by the tier certification target, tenant covenant, and cost of capital.
- Gas substitution at the large end: Reciprocating gas and turbine solutions are taking a greater share of prime power globally. Indian penetration depends on gas availability at the site and remains modest for now, although the direction is established.
- Storage displacement of standby duty: At some facilities, storage takes over part of the standby function without replacing generation. Issue 4 sets out that boundary precisely.
Flexing each of these individually across its plausible range does not take the mid-case estimate below the base scenario. Compressing the number toward the floor requires an adverse combination of all four assumptions at once. Possible, but not a base case.
The honest caveat
The 1.5x factor carries most of the weight here, and it is a published convention, not an observed Indian average. It shifts with redundancy architecture and with how much of a site’s load is classified as critical versus mechanical.
We have not validated it empirically against Indian deployments, and we would rather say so than imply a level of precision we do not have.
Validating it against deployed architectures at eight to 10 Indian facilities is near the top of our research list. If the Indian figure turns out to differ from the published convention in either direction, that finding would be worth more than the estimate it corrects.
The part that is actually actionable
The demand number is the headline. Where that demand lands is the decision.
Maharashtra and Tamil Nadu hold approximately 65% of installed IT load today (Wood Mackenzie, 2026), with Mumbai alone accounting for roughly 49% of national capacity.
The next phase looks much broader: Andhra Pradesh, Telangana, Uttar Pradesh, and Karnataka, supported by state programs including Telangana’s AI cluster memoranda worth approximately INR 10,500 crore and Uttar Pradesh’s eight data center parks targeting 900 MW by 2030 (Eninrac, 2026).
For an OEM, that is not a demand statistic. It is a service-network design problem with a two-year lead time of its own.
No hyperscale tenant accepts a four-hour response commitment served from a depot three states away. Where the second field engineer goes, where the parts depot goes, and which local partner gets certified those decisions have to be made before the capacity arrives.