
- India’s 2030 data center forecasts range from 4–12 GW, implying significant incremental standby generation demand across scenarios.
- State-level power availability, generation mix, tariffs, and infrastructure can materially influence where new data center capacity is developed.
- For genset OEMs, the opportunity is increasingly tied to where data center demand lands and how standby generation and service networks are positioned around it.
India’s data centre build implies incremental standby capacity several times the size of the entire annual genset market. The demand conclusion holds under every scenario. Whether the host states can supply that load is a separate question, and the answer differs sharply between them.
India added 387 MW of IT capacity in 2025, more than double the 191 MW added in 2024 (Rubix Data Sciences, 2026). Announced commitments from AWS, Microsoft, and Google total roughly USD 67.5B, against a pipeline of USD 60–70B over five years (IBEF, 2026), supported by a tax holiday running to 2047 and construction costs 30–40% below those in China and the United States.
That is a national competitiveness story before it is a genset story. Two questions follow: How much generation does the build imply, and can the host states supply it in the form data centers actually buy?
The calculation
The published convention puts standby generation at roughly 1.5 MW per 1 MW of IT load (IMARC). Applied to the three main Indian forecasts:
Implied incremental standby capacity to 2030, three scenarios
Conversion applied: 1.5 MW standby per 1 MW IT load. The shaded floor is the argument
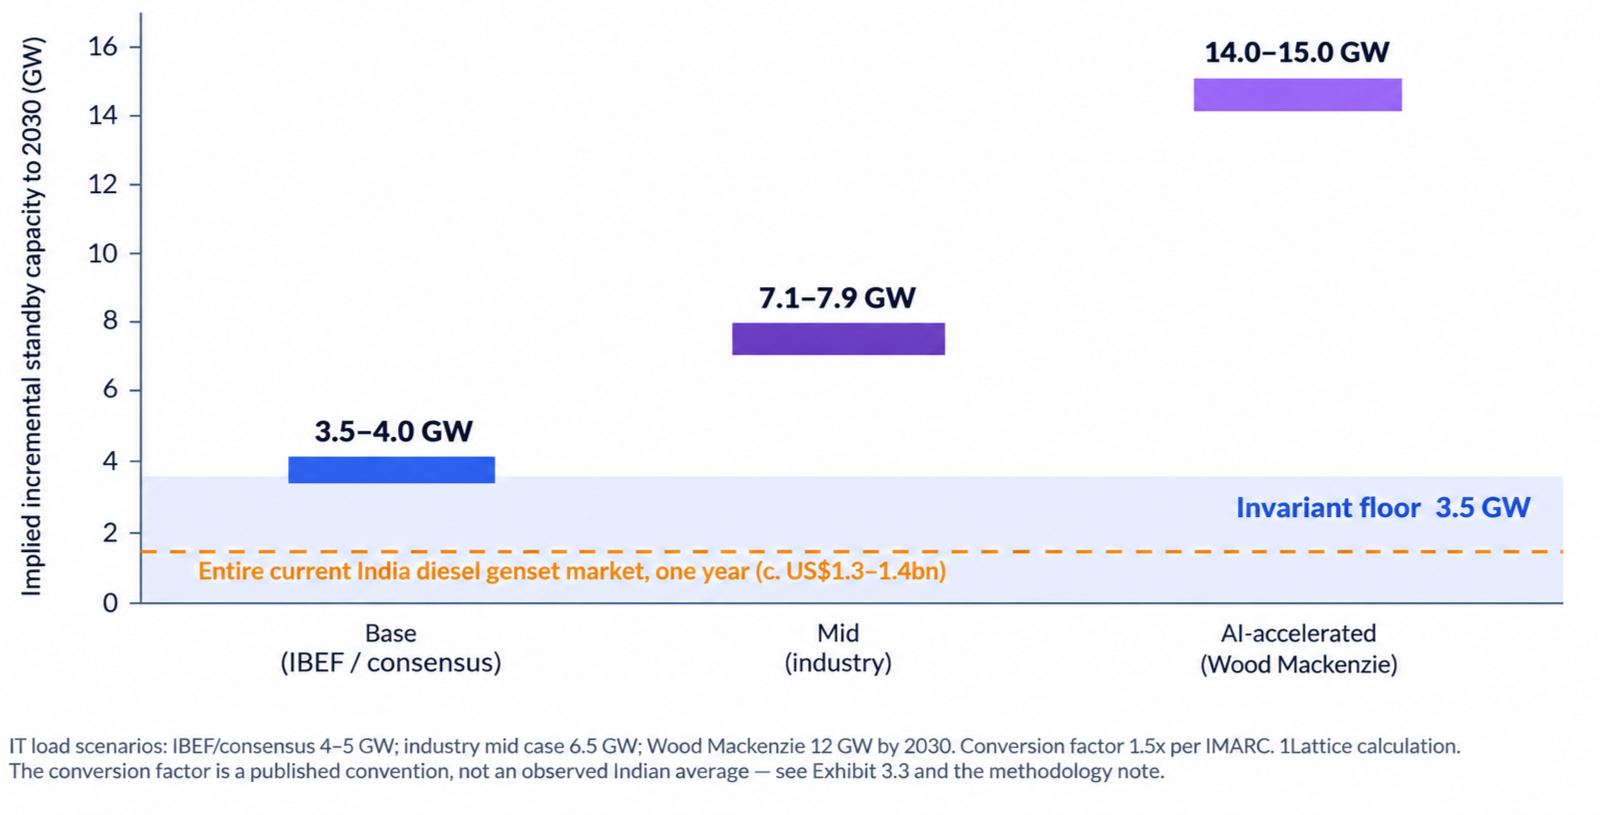
India’s diesel genset market runs at roughly USD 1.3–1.4B a year (IMARC, 2026). Even the base scenario implies incremental demand from one end-use segment worth several years of present national output.
Readers will disagree about which scenario is right, and a 2030 range of 4–12 GW is unusually wide. But nobody in that disagreement can push the implied standby number below about 3.5 GW without rejecting the lowest published forecast outright. The shaded floor is the argument.
Three variables that move the number
- Redundancy architecture: N+1 versus 2N is roughly the difference between 1.25x and 2.0x standby capacity per MW of IT load, and it is the largest single swing factor.
- Gas substitution at the large end: Reciprocating gas turbines are taking prime-power share globally. Indian penetration depends on gas availability at the site and remains modest for now.
- Battery storage displacement: At some facilities, storage is taking over part of the standby function without replacing generation outright.
Sensitivity of the mid-case estimate
No single variable across its plausible range takes the estimate below the base scenario
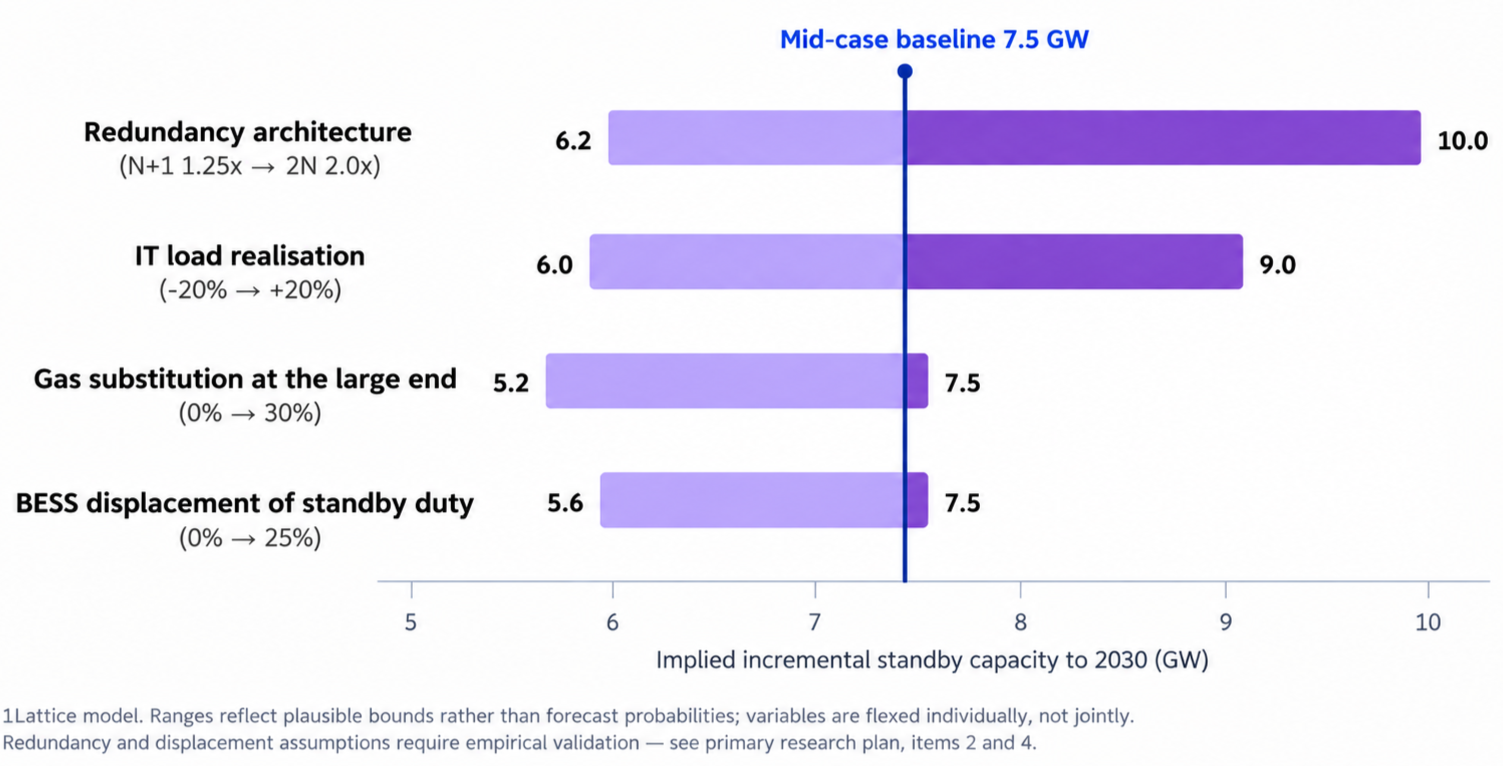
Flexed individually, no single variable at the least favorable end of its range takes the mid-case estimate below the base scenario. Compressing it towards the floor would require all four variables to move adversely at once, which is possible but not our base case.
Can the host states carry it?
Those forecasts are demand-side. They say nothing about whether the states absorbing this load can supply it, and that question produces sharper findings than the demand number does.
One gigawatt of IT load converts at a PUE of 1.4 to roughly 1.4 GW of continuous draw, and at an 85% load factor to about 10,400 million units a year. Set against each candidate state’s existing system, the same campus is a very different proposition depending on where it lands.
What one gigawatt of IT load costs a host state
The same campus is a rounding error in one state and a structural commitment in another
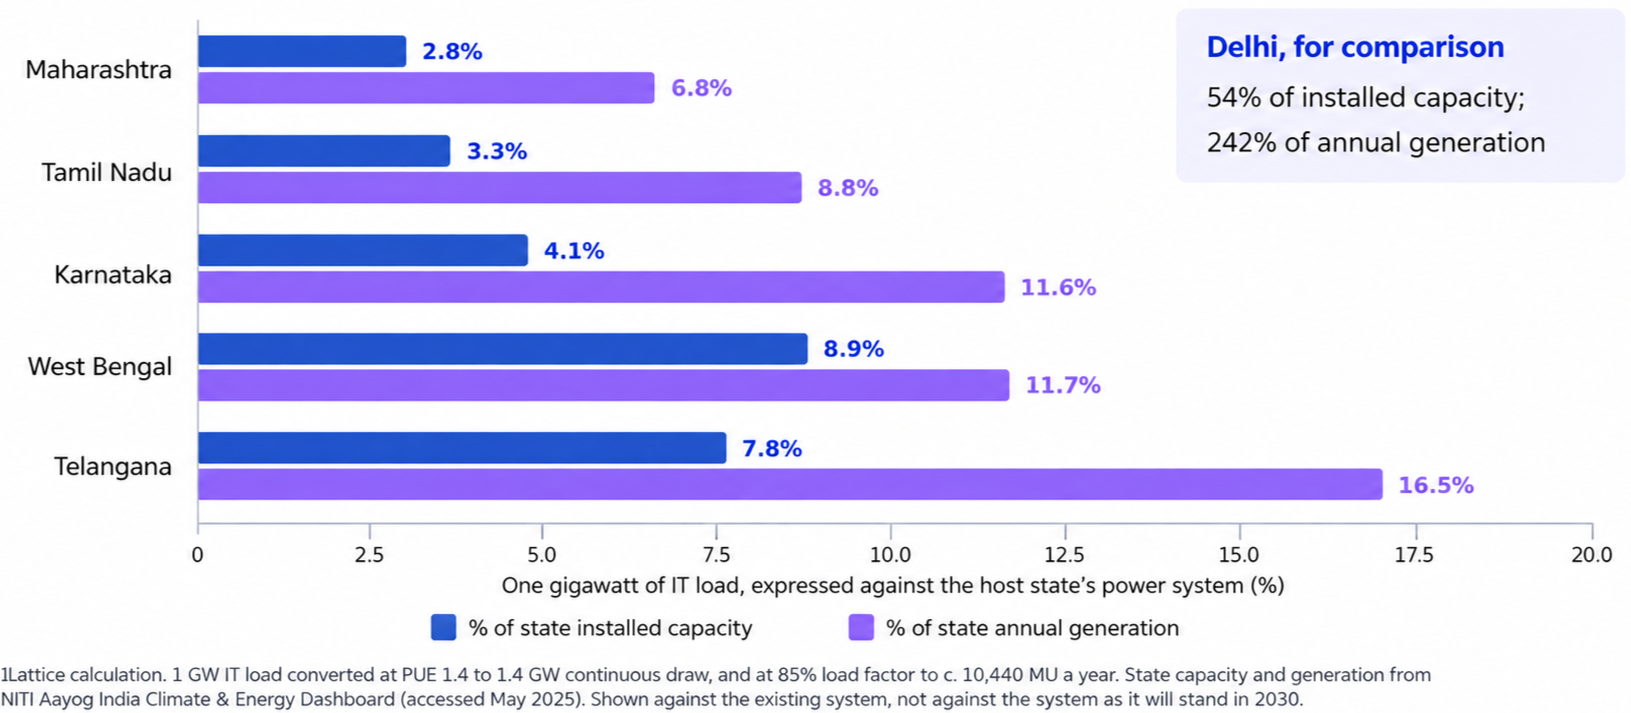
In Maharashtra, one gigawatt of IT load is 2.8% of installed capacity and 6.8% of annual generation. In Telangana, it is 7.8% and 16.5%, roughly two and a half times the relative system commitment for the same campus. Delhi sits off the chart at 54% and 242%, which is the structural reason NCR data center growth sits in Uttar Pradesh and Haryana and depends on imported power.
For a genset manufacturer, relative system commitment is a reasonable proxy for how much standby and bridging generation a developer specifies, and for how long connection sequencing takes. Where a campus consumes a larger share of the existing system, on-site generation carries more of the ramp.
The distinction the renewable numbers conceal
Karnataka holds approximately 33,830 MW of installed capacity, 23,955 MW of it non-fossil, about 71% against a national 47.4%. Tamil Nadu has the largest non-fossil fleet among the leading data center states at 27,025 MW of 42,417 MW. Maharashtra carries the largest system at 50,857 MW but the smallest non-fossil share at 45%.
Generation tells a different story. Data centers do not contract nameplate megawatts; they contract delivered units, around the clock, at availability approaching four nines. The gap between installed and generated is the number that matters.
The firming gap
A renewable megawatt installed is not a renewable megawatt delivered – and a data center contacts for the second
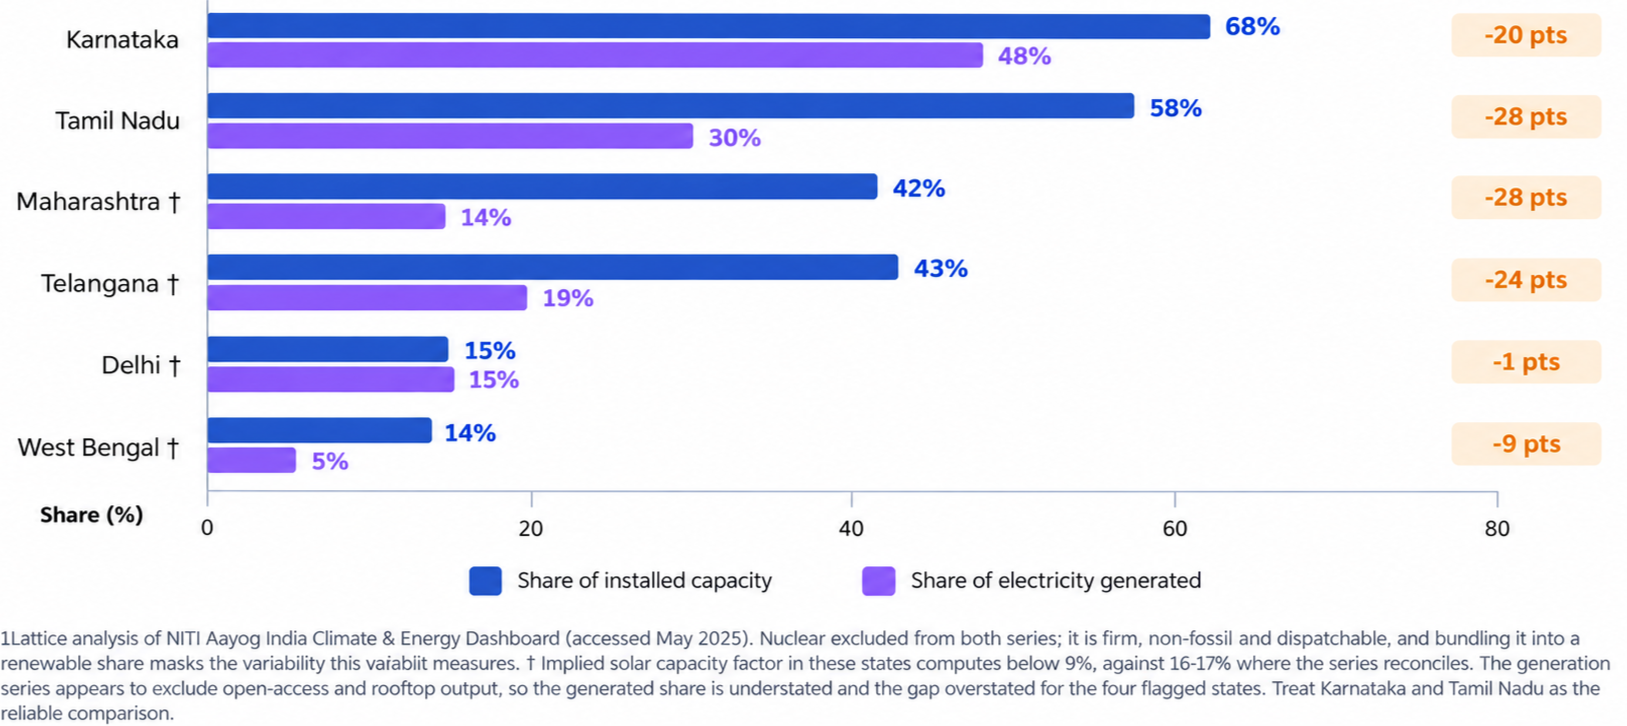
Karnataka’s non-fossil fleet, excluding nuclear, is 68% of installed capacity and delivers 48% of generated units, a gap of 20 percentage points. Tamil Nadu’s is 58% and 30%. That gap is the firming requirement, expressed in the only terms a procurement conversation recognizes.
Tamil Nadu’s headline non-fossil share falls from 64% to 58% once nuclear is stripped out. But nuclear is firm, dispatchable, and carbon-free, which is exactly the profile a data center wants. Its real advantage is not that the fleet is renewable; it is that part of it is firm. No single renewable percentage shows that.
Two supply-side factors that shorten timelines
Two further variables bear on the critical path. The first is transformer density. Karnataka leads on distribution transformer count and capacity, Maharashtra runs a balanced ecosystem across all tiers, and Telangana shows a high step-down count. With transformers and switchgear carrying lead times approaching two years globally, equipment already in the ground is headroom no incentive can substitute for.
The second is tariff classification. Data centers normally sit under industrial tariffs, but practice varies by state and DISCOM. On CEA data for FY23–24, the high-tension commercial-to-industrial gap runs to INR 4.71 per kWh in Maharashtra and INR 1.00–1.85 in Karnataka and Delhi-NCR, while Telangana runs the opposite way. With power at 40–60% of operating cost, that classification moves campus economics more than any capital subsidy.
Neither variable is a criticism of any state framework; both are inputs a developer’s advisers quantify during site selection.
Where this leaves the demand number
None of this revises the forecasts. IT load projections are built from tenant demand, capital commitments, and construction pipelines. What the supply-side work changes is where that load lands, and therefore where the standby generation attached to it gets bought.
Maharashtra and Tamil Nadu hold approximately 65% of installed IT load (Wood Mackenzie, 2026), with Mumbai alone at roughly 49% of national capacity. The next phase broadens into Andhra Pradesh, Telangana, Uttar Pradesh, and Karnataka, supported by state programs including Telangana’s INR 10,500 crore AI cluster memoranda and Uttar Pradesh’s eight parks targeting 900 MW by 2030 (Eninrac, 2026). AdaniConneX alone has announced a 2.6 GW pipeline.
The states absorbing the most load today are not the states with the largest non-fossil headroom, and the states with the most headroom carry the smallest systems. That mismatch is the single most useful thing an OEM can know about this market, because it determines both where campuses go and what gets specified when they arrive.
It is also a service-network design problem with a two-year lead time of its own. No hyperscale tenant accepts a four-hour response commitment served from a depot three states away. Mapping the announced pipeline against organized OEM service point density would be the most useful single piece of work an Indian genset manufacturer could commission this year.